Supercharge Your Innovation With Domain-Expert AI Agents!

A method for creating a relational graph by combining ECharts

A technology of graphs and associations, applied in the computer field, can solve problems such as the inability to intuitively display the hierarchical relationship between data, and achieve the effect of good promotion and application value and increased flexibility.

Active Publication Date: 2019-05-28
INSPUR SOFTWARE TECH CO LTD
View PDF3 Cites 2 Cited by
  • Summary
  • Abstract
  • Description
  • Claims
  • Application Information

AI Technical Summary

Problems solved by technology

The graph of ECharts can be used to build graphs. By default, there are two layout methods: circular layout and force-guided layout. However, these two layout methods cannot intuitively show the hierarchical relationship between data and need further improvement.

Method used


Image

  • A method for creating a relational graph by combining ECharts

Examples


Embodiment

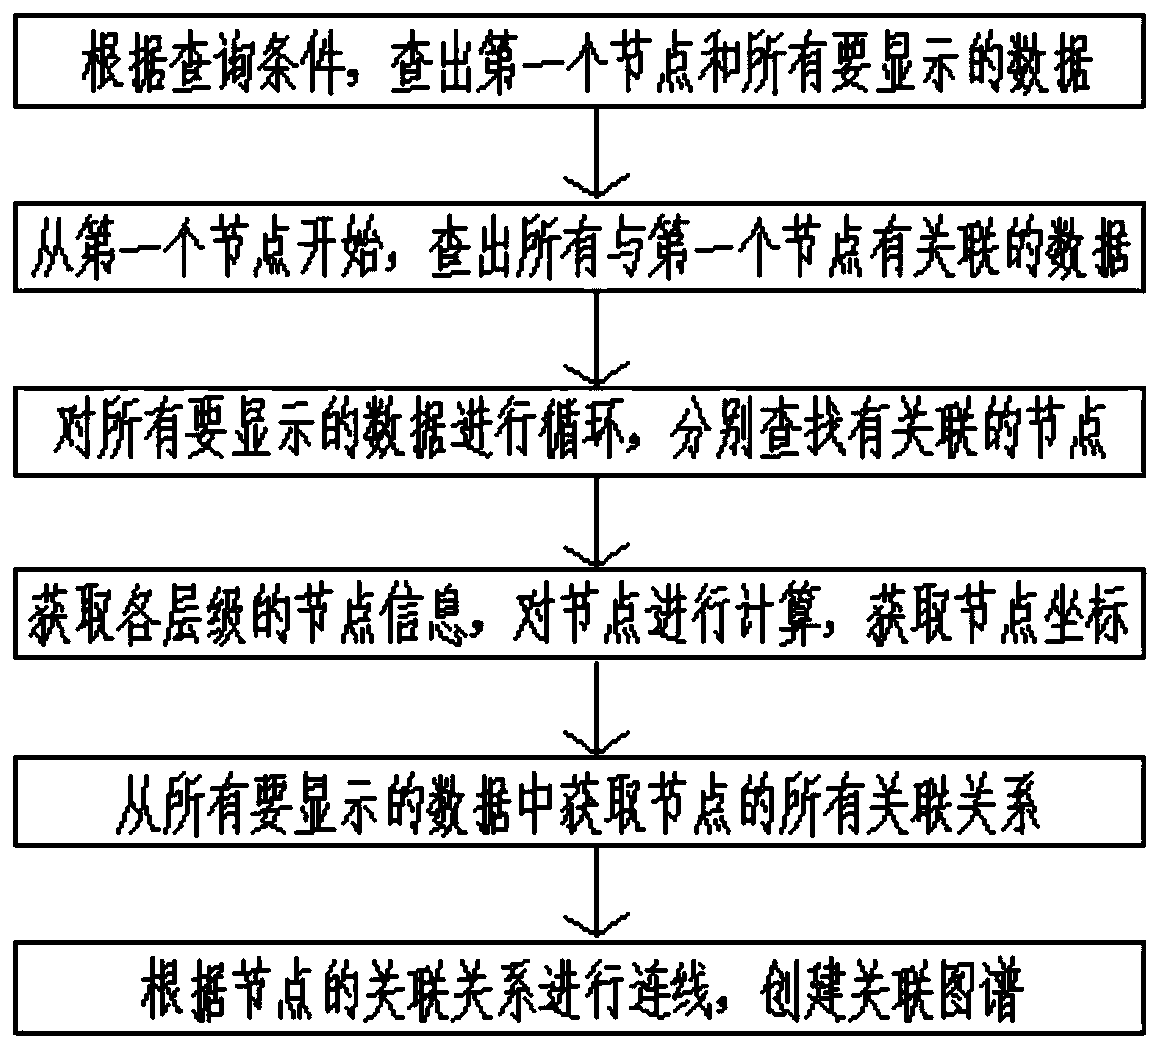
[0049] Such as figure 1 As shown, the method of the present invention in combination with ECharts to create an associated map mainly includes the following steps:

[0050] S1. Find out the first node and all the data to be displayed according to the query condition.

[0051] According to the query conditions, find out the first node L1 and all the data to be displayed ListData.

[0052] S2. Starting from the first node, find out all data associated with the first node.

[0053] Starting from the first node L1, find out all the data associated with L1, which are respectively recorded as L1.1, L1.2, L1.3...L1.n.

[0054] S3. Loop through all the data to be displayed, and search for associated nodes respectively.

[0055]Loop through L1.1, L1.2, L1.3...L1.n, and search for associated nodes respectively, such as the mth one, then find out L1.m.1...L1.m.n, and remove the previous nodes that have appeared.

[0056] S4. Acquiring node information of each level, calculating the n...


PUM


Abstract

The invention discloses a method for creating a relational map by combining ECharts, and belongs to the technical field of computers. The method for creating the relational map by combining the ECharts comprises the following steps of S1, finding out a first node and all to-be-displayed data according to a query condition; S2, starting from the first node, finding out all data associated with thefirst node; S3, circulating all to-be-displayed data, and respectively searching associated nodes; S4, obtaining node information of each level, calculating nodes, and obtaining node coordinates; S5,acquiring all association relationships of the nodes from all to-be-displayed data; and S6, carrying out line connection according to the association relationship of the nodes, and creating an association map. According to the method for relational map by combining the ECharts, the numerous and complex data can be clearly displayed, meanwhile, the nodes can be freely dragged, and the method has very good application and popularization value.

Description

technical field [0001] The invention relates to the field of computer technology, and specifically provides a method for creating an association map in combination with ECharts. Background technique [0002] ECharts is the abbreviation of Enterprise Charts. It is a commercial-grade data chart. It is an open source visualization library implemented using JavaScript. It can run smoothly on PCs and mobile devices and is compatible with most current browsers (IE8 / 9 / 10 / 11, Chrome, Firefox, Safari, etc.), the bottom layer relies on the lightweight graphics library ZRender, which provides intuitive, interactive and highly customizable data visualization charts. The graph of ECharts can be used to build graphs. By default, there are two layout methods: circular layout and force-guided layout. However, these two layout methods cannot intuitively show the hierarchical relationship between data and need further improvement. Contents of the invention [0003] The technical task of th...

Claims


Application Information

Patent Timeline
IPC IPC(8): G06F16/22G06F16/248
CPCY02D10/00
Inventor 肖庆超程林杨培强
Owner INSPUR SOFTWARE TECH CO LTD
Features
  • R&D
  • Intellectual Property
  • Life Sciences
  • Materials
  • Tech Scout
  • Unparalleled Data Quality
  • Higher Quality Content
  • 60% Fewer Hallucinations
Learn More