Data display method based on Echarts

A data display and data technology, applied in the field of neural signal processing, can solve the problems that the floating prompt box cannot meet the needs of diversified display scenarios of big data, the data display method is not flexible enough, and the user experience is not friendly

Active Publication Date: 2019-09-27
BEIJING INST OF COMP TECH & APPL
View PDF3 Cites 8 Cited by
  • Summary
  • Abstract
  • Description
  • Claims
  • Application Information

AI Technical Summary

Problems solved by technology

As a data visualization technology, Echarts is used by many front-end developers as a technology selection for data display. Echarts strictly encapsulates most of the functions and styles, which cannot meet the requirements of some individual needs. Among them, it is used as a data display The function of the floating prompt box cannot meet the needs of diverse display scenarios of big data, the display method of data is not flexible enough, and there is a very unfriendly user experience

Method used


Image

  • Data display method based on Echarts
  • Data display method based on Echarts
  • Data display method based on Echarts

Examples


Embodiment Construction

[0071] In order to make the purpose, content, and advantages of the present invention clearer, the specific implementation manners of the present invention will be further described in detail below in conjunction with the accompanying drawings and embodiments.

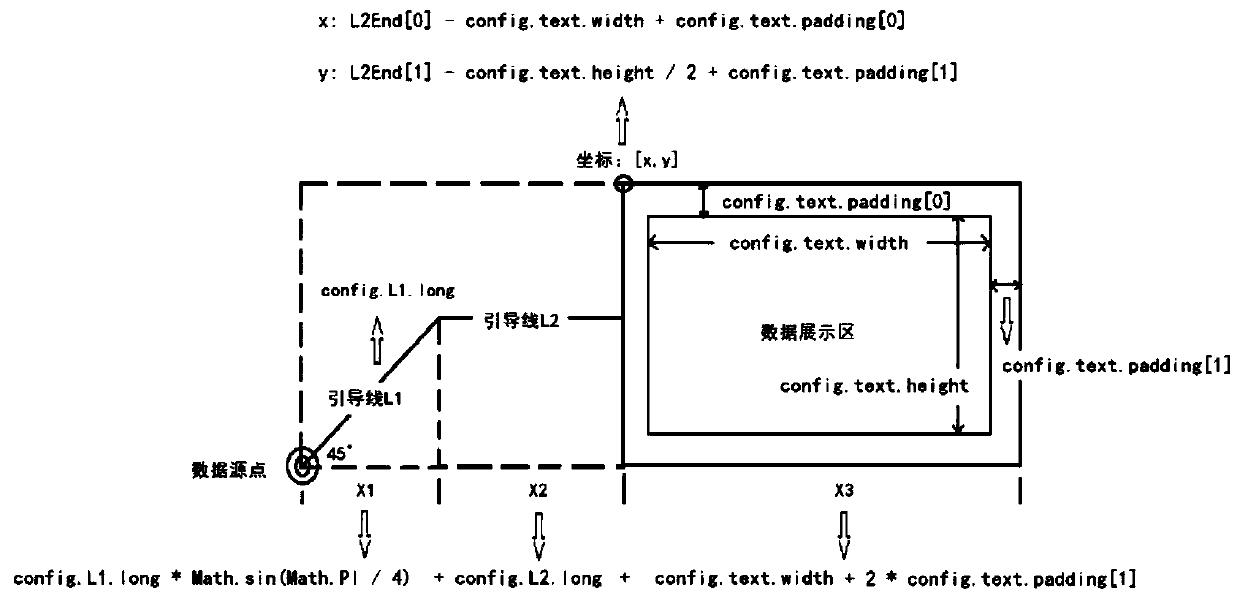
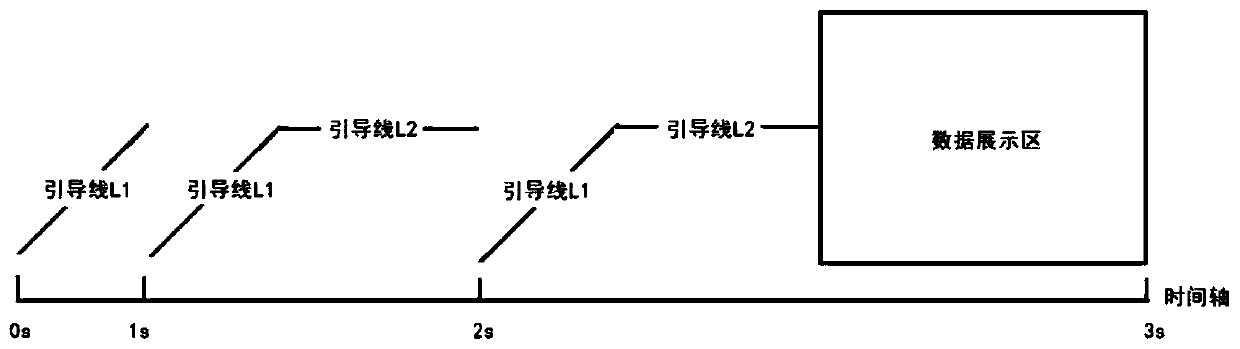
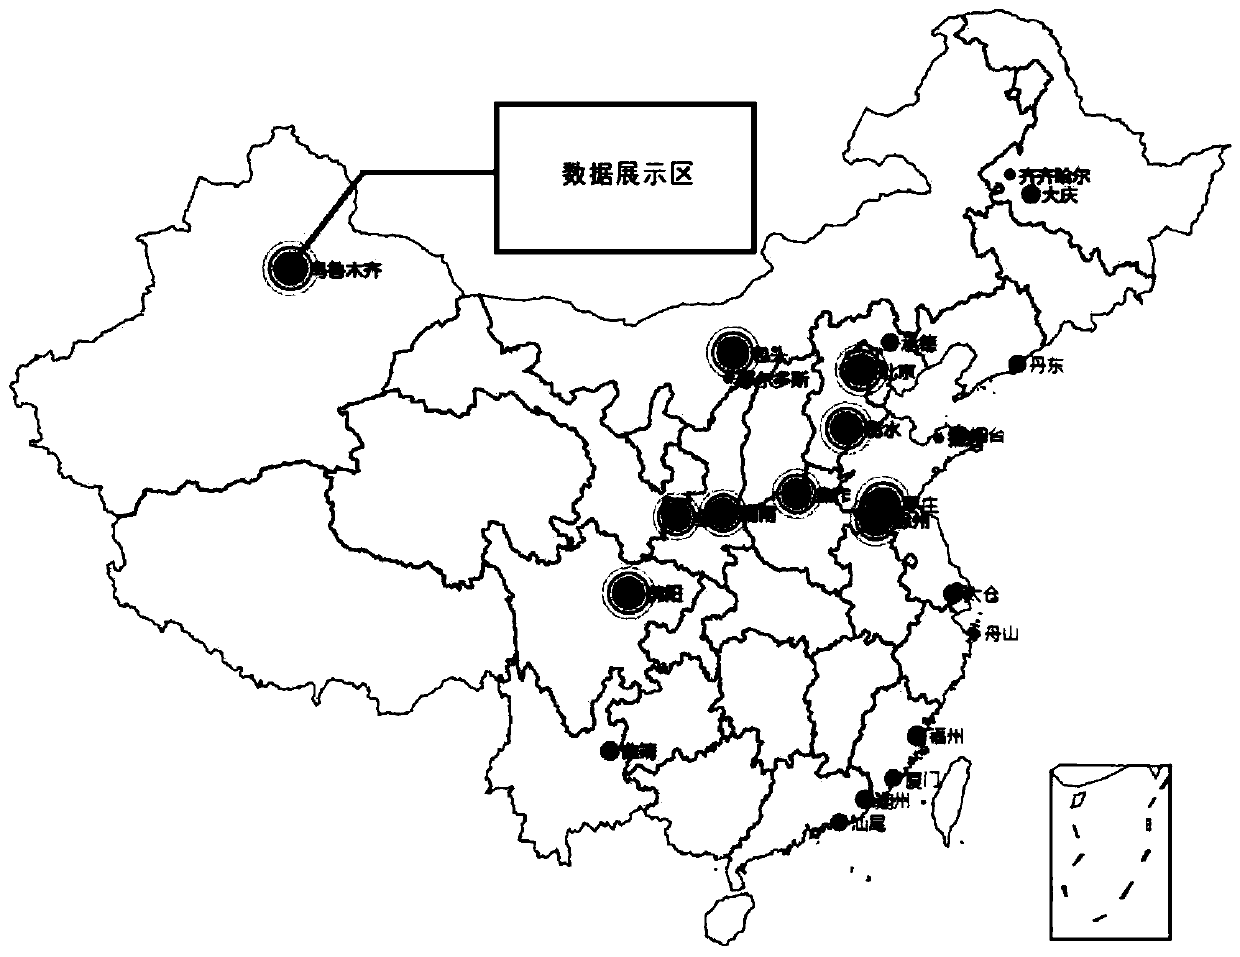
[0072] The invention provides a data display method based on Echarts, especially a data display method of a floating prompt box, which can be customized according to user needs and meet the needs of different scenarios. As a leader in the field of data visualization, Echarts meets the current visualization needs to a large extent functionally, but it is still not flexible enough in terms of data display. Since Echarts is developed based on Canvas of HTML5, the present invention selects the js library CreateJS (a set of modular code library and tool suite) that also operates Canvas to implement a data display box for Echarts instance (hereinafter all Use tooltip instead), which can realize the flexible display of data. ...


PUM


Abstract

The invention relates to a data display method based on Echarts, and relates to the technical field of data visualization. The invention provides the data display method based on Echarts, in particular to a suspension prompt box data display method, which can be customized individually according to user requirements and meet the requirements of different scenes. Echarts is the best in the field of data visualization, the current visualization requirement is met to a great extent in function, but the Echarts are still not flexible in the aspect of data display. Due to the fact that the Echarts is developed on the basis of Canvas of HTML5, a js library Create JS matching method for operating the Canvas is selected for achieving a data display box used for an Echarts instance, and flexible display of data can be achieved.

Description

technical field [0001] The invention relates to the technical field of neural signal processing, in particular to an Echarts-based data display method. Background technique [0002] In recent years, data visualization technology, as a kind of high-tech, is particularly important in the era of big data, and has been applied to data display in various fields and scenarios. As a data visualization technology, Echarts is used by many front-end developers as a technology selection for data display. Echarts strictly encapsulates most of the functions and styles, which cannot meet the requirements of some individual needs. Among them, it is used as a data display The functional floating prompt box cannot meet the needs of diverse display scenarios of big data. The display method of data is not flexible enough, and there is a very unfriendly user experience. Contents of the invention [0003] (1) Technical problems to be solved [0004] The technical problem to be solved by the ...

Claims


Application Information

Patent Timeline
Patent Type & Authority Applications(China)
IPC IPC(8): G06F8/38G06F9/451
CPCG06F8/38G06F9/451
Inventor 徐晶石波胡佳谢小明王伟男
Owner BEIJING INST OF COMP TECH & APPL
Why Eureka
Try Eureka