Eureka AIR delivers breakthrough ideas for toughest innovation challenges, trusted by R&D personnel around the world.

Multivariate statistical evaluation method for state of overhead line system

A technology of multivariate statistics and evaluation methods, applied in computing, instruments, data processing applications, etc., can solve problems such as evaluation result conflicts, catenary status abnormalities, catenary status judgments are not comprehensive enough, etc., to achieve convenient application, eliminate abnormalities, and judge Intuitive effect of the result image

Inactive Publication Date: 2020-03-27
EAST CHINA JIAOTONG UNIVERSITY
View PDF5 Cites 3 Cited by
  • Summary
  • Abstract
  • Description
  • Claims
  • Application Information

AI Technical Summary

Problems solved by technology

[0004] At present, the catenary detection vehicle is mainly used to detect the state parameters of the catenary. The detection vehicle measures the pull-out value, guide height, contact pressure, hard point, offline and other mechanical and electrical parameters of the catenary through the installed sensors, and then Compare the measured parameters with the pre-set thresholds. If any parameter exceeds the limit, it is considered that the state of the catenary is abnormal; this multi-indicator single-parameter threshold comparison method is to judge each indicator separately and ignore the contact network. There is no reasonable basis for the threshold setting, the judgment of the catenary status is not comprehensive enough, the judgment results are not intuitive enough, and sometimes even the evaluation results conflict with each other, which brings troubles to the operation and maintenance of the catenary on site

Method used


Image

  • Multivariate statistical evaluation method for state of overhead line system
  • Multivariate statistical evaluation method for state of overhead line system
  • Multivariate statistical evaluation method for state of overhead line system

Examples


Embodiment Construction

[0028] In order to make the technical means, creative features, goals and effects achieved by the present invention easy to understand, the present invention will be further described below in conjunction with specific embodiments.

[0029] A multivariate statistical evaluation method for catenary status, the specific steps are as follows:

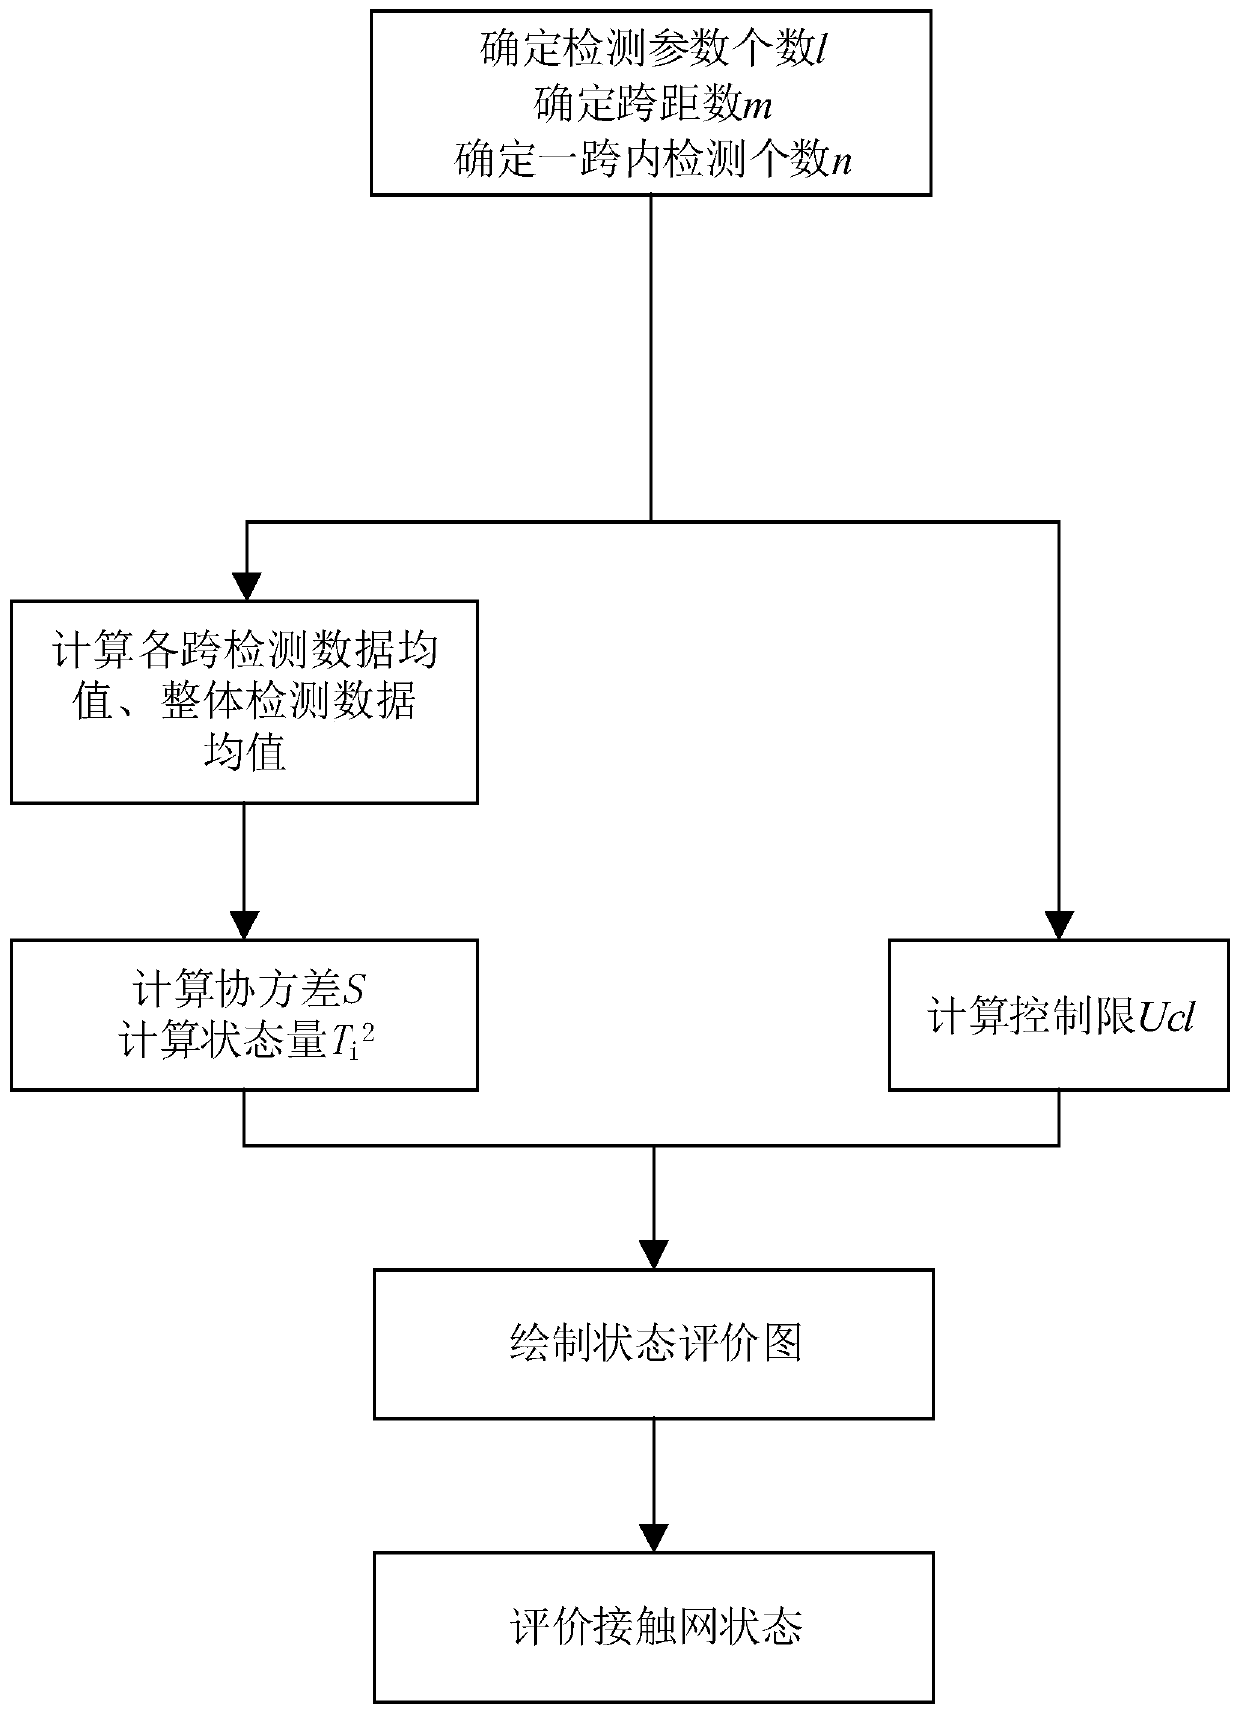
[0030] (1) Determine the number l of the catenary geometric detection parameters in the state to be evaluated. The geometric detection parameters include pull-out value, guide height, slope, hard point and height difference, and then form the catenary state evaluation vector X=( x 拉出值 , X 导高 , X 坡度 , X 硬点 , X 高差 );

[0031] (2) Taking the mean value of the catenary geometric detection parameter data within a span as a subgroup value of the state vector subgroup, each detection parameter in a subgroup vector can be expressed as:

[0032] Among them, n is the number of detection data in a span, and j represents the jth group of spa...


PUM


Abstract

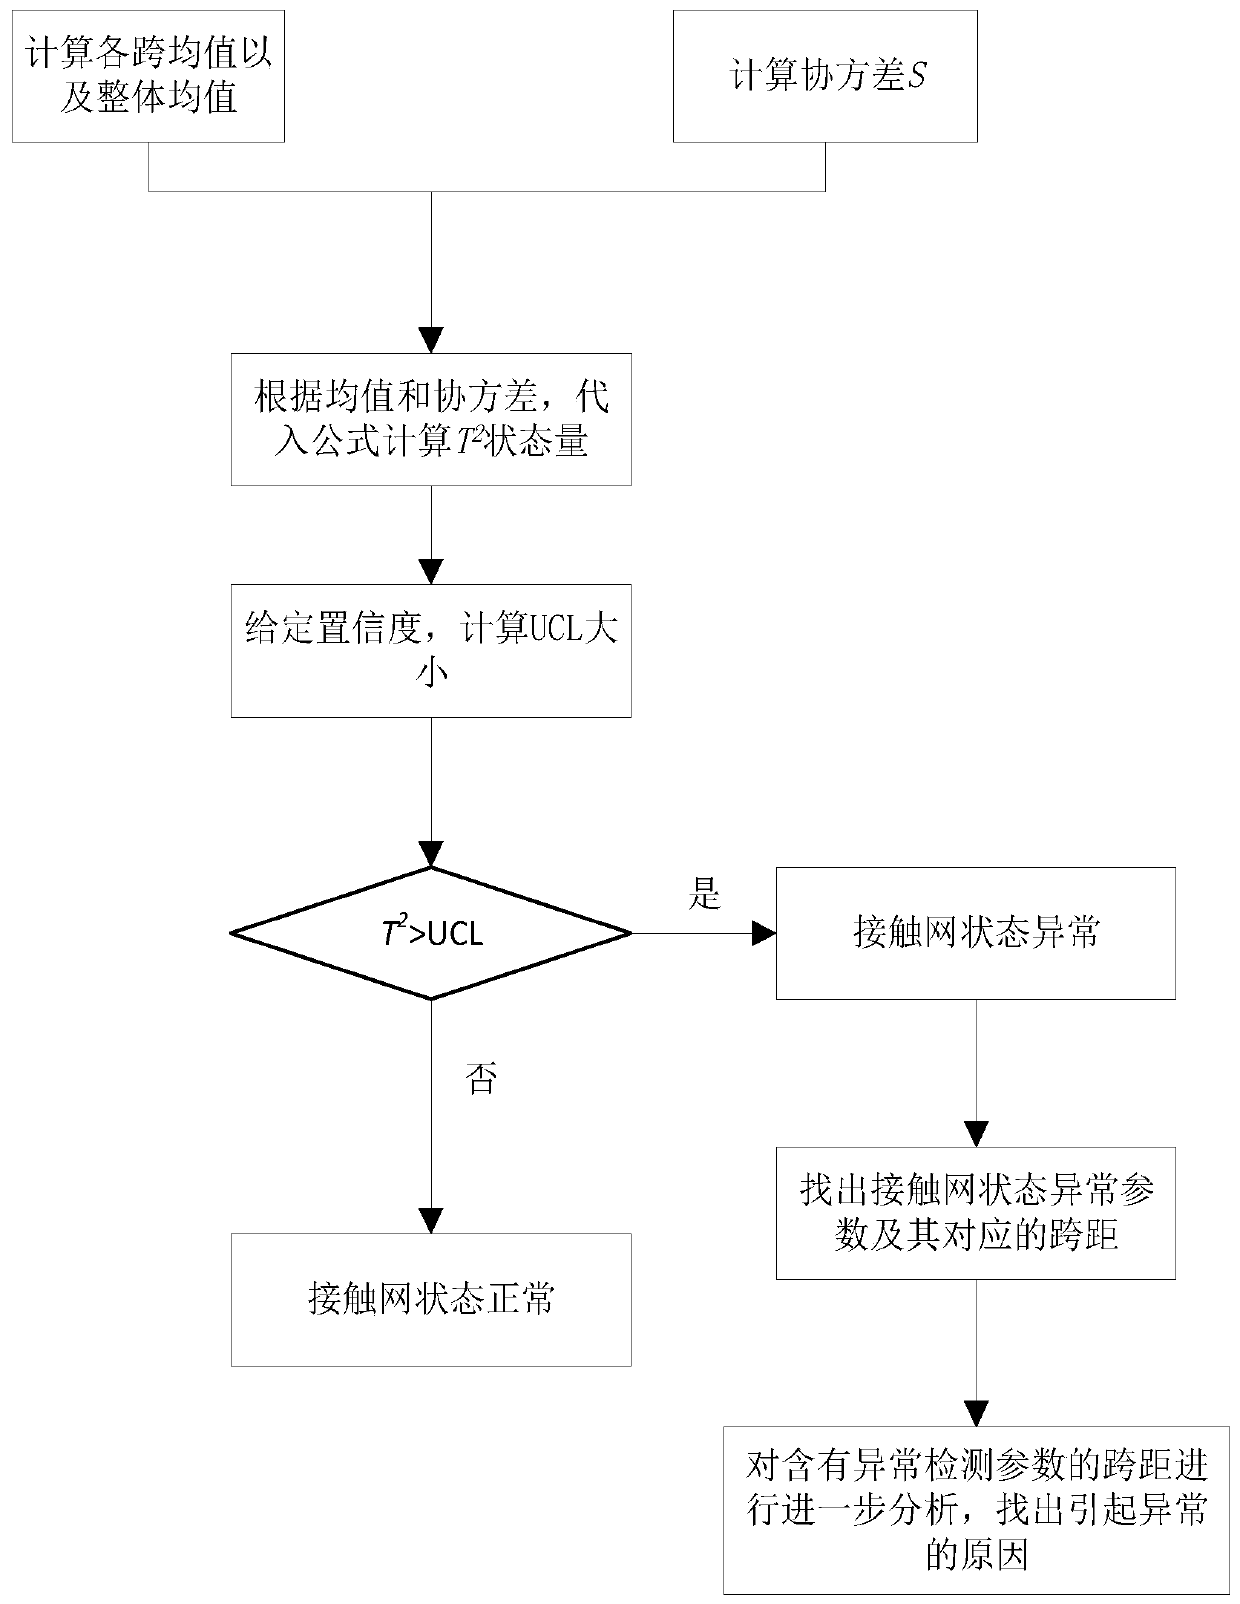
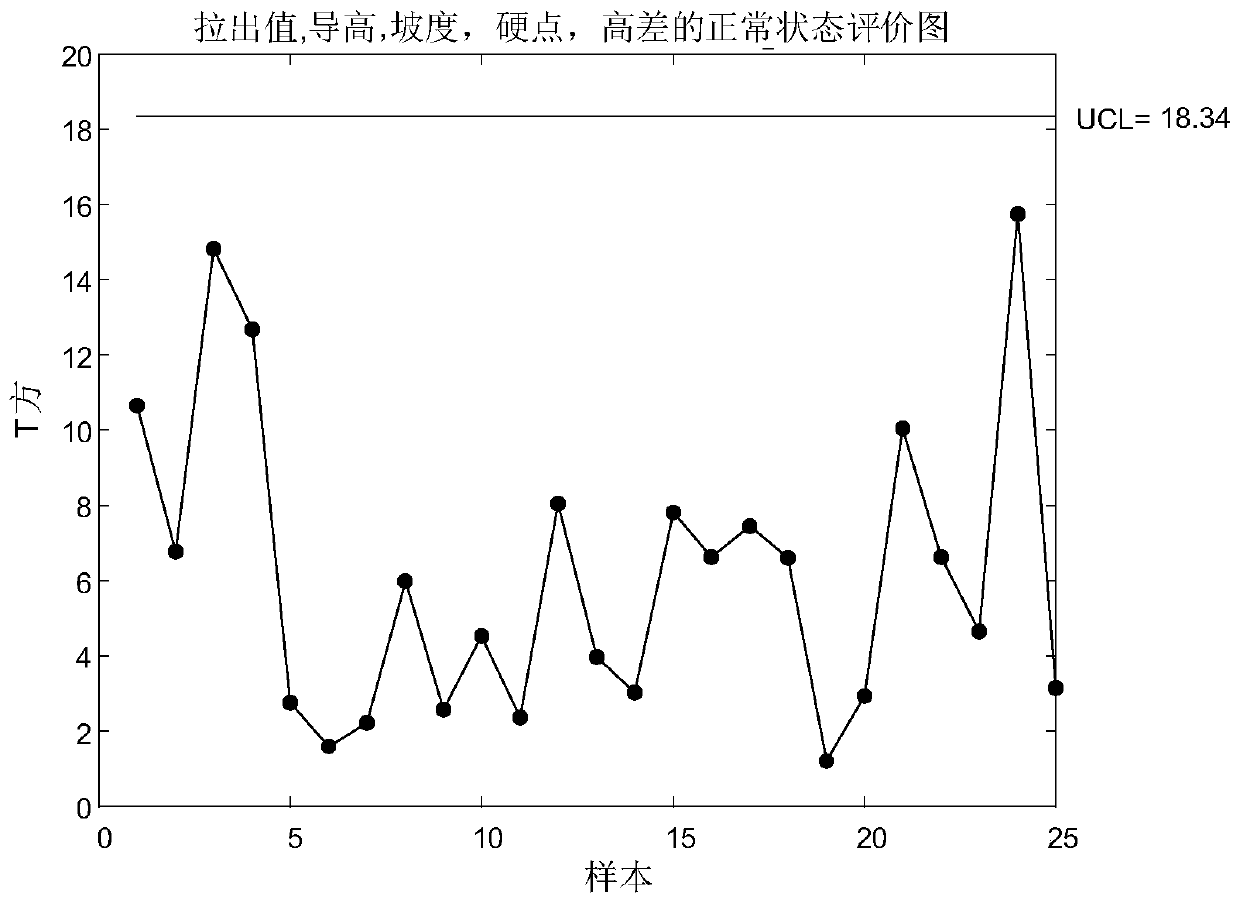
A multivariate statistical evaluation method for the state of an overhead line system comprises the following steps: firstly, determining the number of geometric parameters of the overhead line systemin a to-be-evaluated state, then determining a detection data subset vector in a span and a detection parameter state matrix in a span moment, and then calculating the overall mean value of span detection parameters and Ti2 statistics and a covariance matrix S of each span in the span; determining the confidence alpha, and determining the highest upper limit Ucl of the state value according to the F distribution; and finally, drawing a state statistics graph, drawing the highest upper limit of the statistics on the graph in a straight line parallel to the abscissa, judging whether points exceeding the upper limit exist in the statistical value or not according to the drawn graph, judging that the state is abnormal if the points exceeding the upper limit exist, analyzing an abnormal group,and finding out an abnormal reason, and if not, judging that the state of the contact network is normal. The multivariate statistical evaluation method has the advantages that graphical display is achieved, and the judgment result is vivid and visual, and application is convenient.

Description

technical field [0001] The invention relates to the technical field of catenary parameter evaluation, in particular to a multivariate statistical evaluation method for catenary status. Background technique [0002] Electrified railway is an important mode of transportation. The catenary is erected along the sky above the railway and undertakes the important task of providing electric energy to electric locomotives. Accurate evaluation of catenary detection status is the basis and premise of catenary condition maintenance. [0003] Accurate evaluation of catenary detection status can detect abnormal catenary status in time, and provide a basis for preventive maintenance of catenary, thereby reducing the occurrence of catenary failures, reducing the negative impact of catenary abnormalities on railway transportation, and ensuring the safety of electrified railways. Safe and on time. [0004] At present, the catenary detection vehicle is mainly used to detect the state parame...

Claims


Application Information

Patent Timeline
Patent Type & Authority Applications(China)
IPC IPC(8): G06Q10/06
CPCG06Q10/06393
Inventor 程宏波王佳鑫伦利
Owner EAST CHINA JIAOTONG UNIVERSITY
Why Eureka
Eureka Blog
Learn More