
Ionized layer three-dimensional display method and device

A three-dimensional display and ionosphere technology, applied in image data processing, 3D modeling, instruments, etc., can solve the problem of not being able to reflect the full picture and details of the original data field

Pending Publication Date: 2020-09-15
北京天工科仪空间技术有限公司
View PDF5 Cites 2 Cited by
  • Summary
  • Abstract
  • Description
  • Claims
  • Application Information

AI Technical Summary

Problems solved by technology

[0003] Traditional ionospheric data visualization mainly includes methods such as surface drawing and customizing kml files, but these methods only express part of the information characteristics of the data, and cannot reflect the full picture and details of the original data field

Method used


Image

  • Ionized layer three-dimensional display method and device
  • Ionized layer three-dimensional display method and device
  • Ionized layer three-dimensional display method and device

Examples


Embodiment

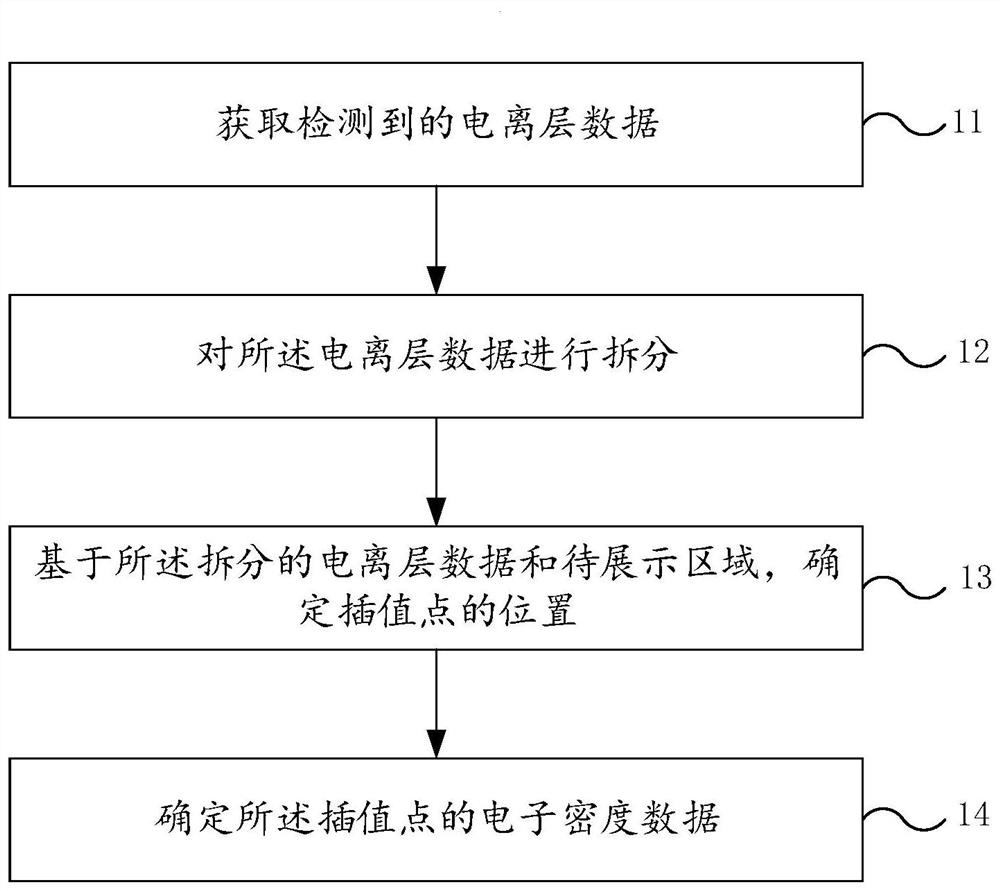
[0052] see figure 1 , figure 1 It is a flow chart of a method for three-dimensional display of the ionosphere provided by an embodiment of the present application.

[0053] like figure 1 As shown, a method for three-dimensional display of the ionosphere provided in this embodiment at least includes the following steps:

[0054] Step 11, obtaining detected ionospheric data;

[0055] Obtaining the detected ionospheric data here refers to obtaining raw data obtained by various ionospheric monitoring devices. Generally, these raw data are sliced ​​data. For example: ionospheric data can be: begbtection, slices in the height direction, a total of six, the size is 51*41, and the heights are 300, 400, 500, 600, 800, 1000 (unit: km); lonSection, slices in the longitude direction, a total of 5, the size 51*32, the longitudes are 100, 105, 110, 115, 120 respectively; latSection, the latitude and azimuth slices, a total of 6 slices, the size is 41*32, and the latitudes are 10, 15, 2...


PUM


Abstract

The invention relates to the related technical field of ionized layer observation, in particular to an ionized layer three-dimensional display method and device. The ionized layer three-dimensional display method comprises the following steps: acquiring detected ionized layer data; splitting the ionized layer data; determining the position of an interpolation point based on the split ionized layerdata and the to-be-displayed area; and determining electron density data of the interpolation point: based on the position of the interpolation point and the electron density data, performing point cloud rendering on the surface of the virtual earth to obtain an ionized layer three-dimensional display image.

Description

technical field [0001] The present application relates to the related technical field of ionospheric observation, in particular to a method and device for three-dimensional display of ionosphere. Background technique [0002] As an important part of the sun-terrestrial space environment, the ionosphere is one of the important sources of measurement errors in many radio information systems such as satellite navigation, communication and radar. In order to meet the needs of high-precision ionospheric error correction, it is very important to obtain ionospheric characteristic parameters. Among the many characteristic parameters of the ionosphere, the electron density distribution is one of the key characteristic parameters that characterize the state change of the ionosphere. The visualization study of ionospheric electron density not only allows users to analyze data in an intuitive way, but also helps to discover complex laws hidden in the data. [0003] Traditional ionosph...

Claims


Application Information

Patent Timeline
Patent Type & Authority Applications(China)
IPC IPC(8): G06T17/00G06T19/20
CPCG06T17/00G06T19/20Y02A90/10
Inventor 张坤王世金李子平姜丙凯郭豪男
Owner 北京天工科仪空间技术有限公司
Learn More