Supercharge Your Innovation With Domain-Expert AI Agents!

Quantification method of ecosystem attribute component composition structure change

A technology of ecosystems and quantitative methods, applied in the field of quantification of changes in ecosystem composition and structure, can solve problems such as lack of quantitative expression methods

Active Publication Date: 2022-04-12
NORTHEAST INST OF GEOGRAPHY & AGRIECOLOGY C A S
View PDF1 Cites 0 Cited by
  • Summary
  • Abstract
  • Description
  • Claims
  • Application Information

AI Technical Summary

Problems solved by technology

[0003] The purpose of the present invention is to solve the technical problem that the existing method lacks the quantitative expression method of the composition structure change of the attribute components between two periods, and provides a quantitative method for the composition structure change of the ecosystem attribute components

Method used


Image

  • Quantification method of ecosystem attribute component composition structure change
  • Quantification method of ecosystem attribute component composition structure change
  • Quantification method of ecosystem attribute component composition structure change

Examples


specific Embodiment approach 1

[0023] Specific implementation mode 1: In this implementation mode, the quantitative method for the composition and structure change of the ecosystem attribute components is as follows:

[0024] 1. Acquisition of frequency change distribution of attribute components:

[0025] Obtain the frequency distribution data of attribute components from the raster data of ecosystem attributes in two periods;

[0026] Calculate the frequency difference corresponding to each attribute group between the two periods, and obtain the frequency difference distribution data of the attribute group;

[0027] According to the difference, the frequency difference distribution data is divided into three types: frequency increase, frequency decrease and frequency constant;

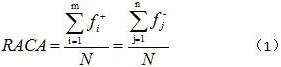
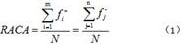
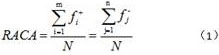
[0028] 2. Calculation of the proportion index of attribute change area:

[0029] Substitute the frequency difference data of the type of frequency increase or frequency decrease into formula (1), and calculate the area ratio of ...

specific Embodiment approach 2

[0036] Embodiment 2: This embodiment differs from Embodiment 1 in that the ecosystem attribute grid data in step 1 is vegetation index or ecological parameter grid data. Others are the same as the first embodiment.

[0037] Adopt following experiment verification effect of the present invention:


PUM


Abstract

The method for quantifying the change of composition structure of ecosystem attribute components relates to a method for quantifying the change of composition structure of ecosystem. The present invention aims to solve the technical problem that the existing method lacks a quantitative expression method for the structural changes of attribute components between two periods. The method is as follows: 1. Acquisition of frequency change distribution of attribute components; 2. Calculation of proportion index of attribute change area; 3. Calculation of index of average range of attribute change. The present invention introduces two indexes, the proportion of attribute change area and the average range of attribute change, to quantitatively describe the variation of the frequency difference distribution of attribute components in the two periods before and after the change of the ecosystem, and realize the composition structure of the attribute components of the ecosystem Quantitative characterization of evolution status. The invention belongs to the technical field of quantification of composition structure change of ecosystem attribute components.

Description

technical field [0001] The invention relates to a method for quantifying the composition and structure change of an ecological system. Background technique [0002] The patent "A Method for Describing Changes in the Composition and Structure of Ecosystem Attributes" reveals the characteristics of changes in the composition and structure of ecosystem attributes by constructing frequency difference distribution diagrams of ecosystem attributes and components, but the above method can only express ecosystem attributes intuitively However, there is a lack of quantitative expression methods for the changes in the composition and structure of attributes between two periods. Contents of the invention [0003] The purpose of the present invention is to solve the technical problem that the existing method lacks a quantitative expression method for the composition structure change of attribute components between two periods, and provides a quantitative method for the composition str...

Claims


Application Information

Patent Timeline
Patent Type & Authority Patents(China)
IPC IPC(8): G06Q10/06G06Q50/26
CPCG06Q10/06393G06Q50/26
Inventor 刘兆礼陈子琦侯光雷
Owner NORTHEAST INST OF GEOGRAPHY & AGRIECOLOGY C A S
Features
  • R&D
  • Intellectual Property
  • Life Sciences
  • Materials
  • Tech Scout
  • Unparalleled Data Quality
  • Higher Quality Content
  • 60% Fewer Hallucinations
Learn More