
City diversity index analysis and visual modeling system based on remote sensing data inversion

A technology of remote sensing data and data inversion, applied in structured data retrieval, geographic information database, special data processing applications, etc., can solve problems such as low efficiency and poor applicability

Active Publication Date: 2021-04-13
河南省航空物探遥感中心
View PDF5 Cites 0 Cited by
  • Summary
  • Abstract
  • Description
  • Claims
  • Application Information

AI Technical Summary

Problems solved by technology

[0006] However, in the actual decision-making and application process, the solutions proposed by the above-mentioned prior art are only for the analysis of a specific type of single index
When urban decision makers need to predict urban diversity from multiple perspectives, they need to collect and evolve data one by one, resulting in low efficiency and poor applicability

Method used


Image

  • City diversity index analysis and visual modeling system based on remote sensing data inversion
  • City diversity index analysis and visual modeling system based on remote sensing data inversion
  • City diversity index analysis and visual modeling system based on remote sensing data inversion

Examples


Embodiment Construction

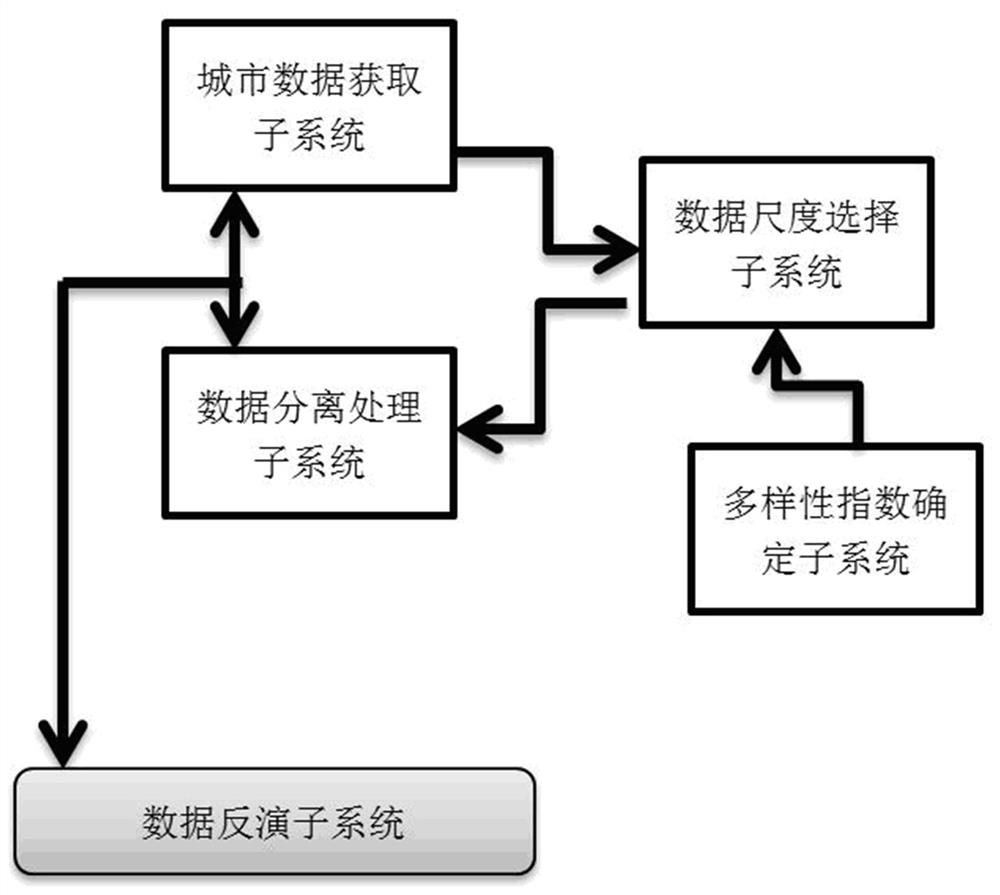
[0041] see figure 1 , a subsystem combination architecture diagram of an urban diversity index analysis system based on remote sensing data inversion according to an embodiment of the present invention.

[0042] exist figure 1 Among them, the system includes urban data acquisition subsystem, data scale selection subsystem, data separation processing subsystem, diversity index determination subsystem and data inversion subsystem.

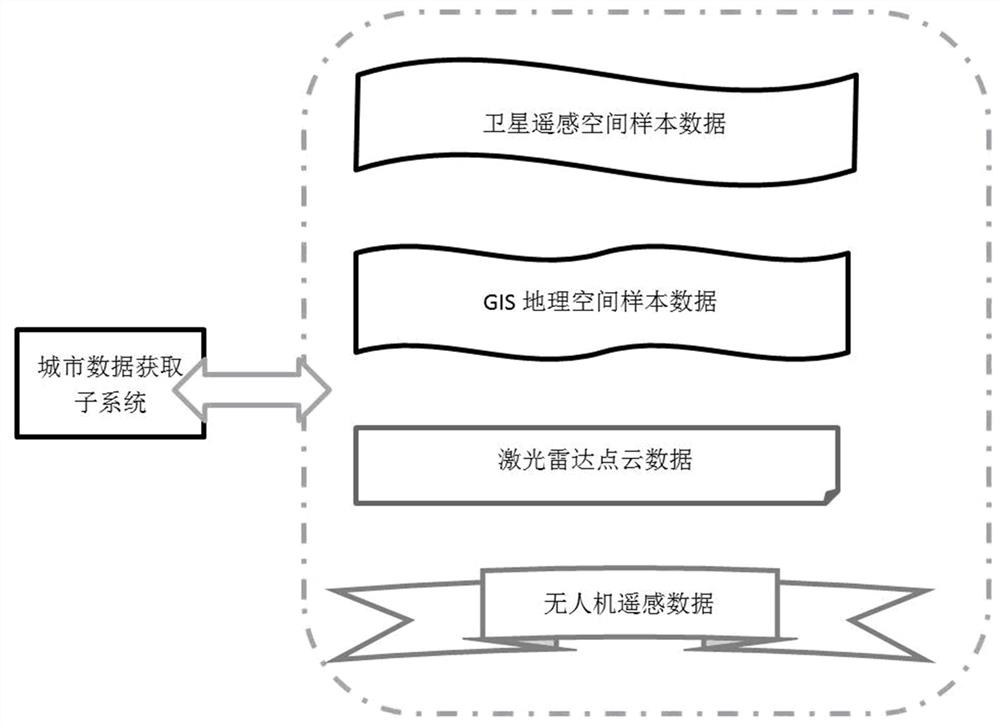
[0043] The urban data acquisition subsystem is used to obtain a variety of sample data of the city;

[0044]The data scale selection subsystem saves the relationship table between different diversity indices and the required corresponding types of city data scales, and automatically recommends the target diversity index type based on the target diversity index type determined by the diversity index determination subsystem. The urban data types and urban data scales required by the sex index;

[0045] The data separation processing subsystem is use...


PUM


Abstract

The invention provides a city diversity index analysis and visual modeling system based on remote sensing data inversion and a diversity analysis method. The system comprises a city data acquisition subsystem, a data scale selection subsystem, a data separation processing subsystem, a diversity index determination subsystem and a data inversion subsystem. The data scale selection subsystem automatically recommends a city data type and a city data scale required by the target diversity index; the data separation processing subsystem is used for separating target city data corresponding to the city data type and the city data scale from the city data acquisition subsystem; and the data inversion subsystem performs inversion processing on the target city data based on a predetermined data inversion model to obtain a target diversity index, and displays a trend chart of different first diversity indexes changing with time and space on a human-computer interaction interface. According to the invention, visual display of different types of diversity indexes can be realized.

Description

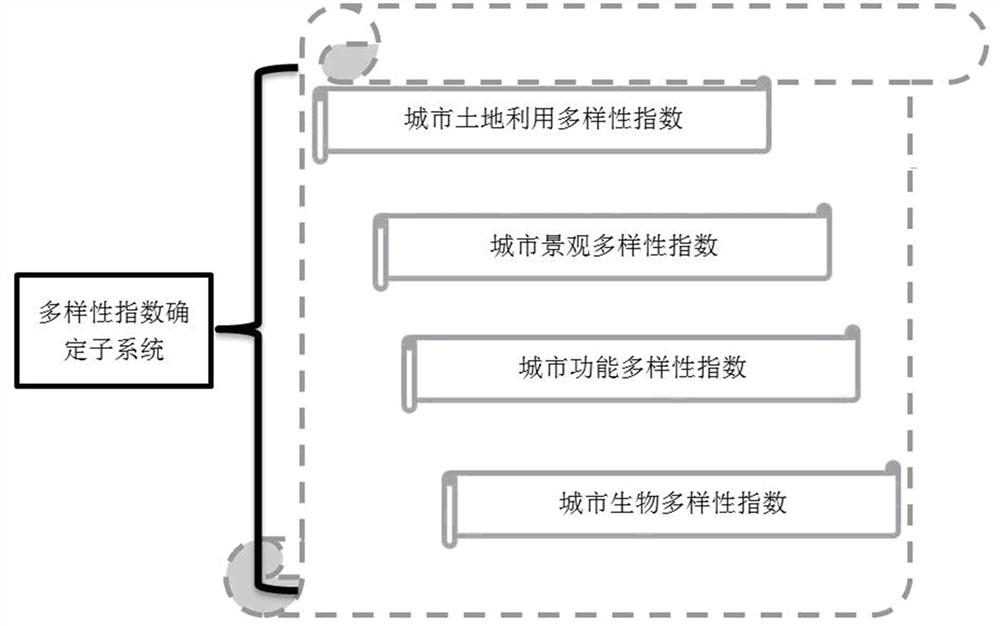
technical field [0001] The invention belongs to the technical field of urban diversity analysis, and in particular relates to an urban diversity index analysis and visualization modeling system and a diversity analysis method based on remote sensing data inversion. Background technique [0002] Diversity is one of the basic factors for the survival of human society, an important measure for human society to protect the natural ecological environment, and a fundamental guarantee for realizing the common and sustainable development goals of man and nature. Urban diversity is reflected in many aspects, including biodiversity, functional diversity, landscape diversity and land use diversity. [0003] With the breakthrough of emerging scientific theories and research technologies at home and abroad, the development from traditional field evaluation to remote sensing evaluation methods and model evaluation methods in recent years has been realized. The diversity of evaluation an...

Claims


Application Information

Patent Timeline
Patent Type & Authority Applications(China)
IPC IPC(8): G06F30/20G06F16/29
CPCG06F16/29G06F30/20
Inventor 李光辉董耀杨志
Owner 河南省航空物探遥感中心
Learn More