
Audio visualization method and terminal

A technology of audio and audio data, applied in audio visualization methods and terminal fields, can solve problems such as poor display effect, long processing time, cumbersome audio data processing process, etc., and achieve the effect of improving visual effect and optimizing data processing process

Active Publication Date: 2021-04-16
FUJIAN STAR NET EVIDEO INFORMATION SYST CO LTD
View PDF8 Cites 0 Cited by
  • Summary
  • Abstract
  • Description
  • Claims
  • Application Information

AI Technical Summary

Problems solved by technology

However, the audio data processing process of the existing audio visualization method is cumbersome, the processing time is long, and the display effect is poor. to experience

Method used


Image

  • Audio visualization method and terminal
  • Audio visualization method and terminal
  • Audio visualization method and terminal

Examples


Embodiment 1

[0056] This embodiment discloses an audio visualization method, which specifically includes the following steps:

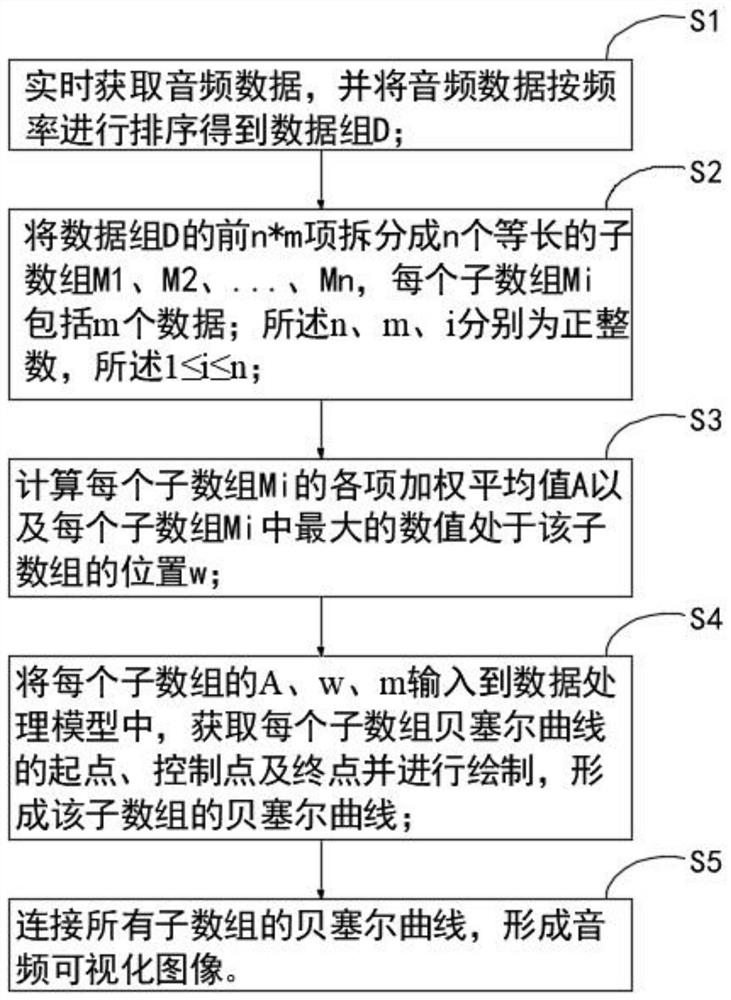
[0057] Step 1: Obtain audio data, and sort the audio data by frequency to obtain a data group D; wherein, the audio data is subjected to Fourier transform to obtain freq data, which is a floating-point numerical array, and the freq data Sort by frequency from low to high to get data group D; this is the data source, and the visual image changes according to this data;

[0058] Step 2: define floating-point numerical sub-arrays M1, M2, ..., Mn, a total of n sub-arrays, the length of each sub-array is m, and the length of the first n*m items is less than or equal to the length of the data group D; because The data group D is the freq data obtained by Fourier transforming the audio data, and has a large number of sub-arrays. Since this embodiment mainly considers visualizing the audio based on the frequency of the audio, when the frequency of the audio is too high, ...

Embodiment 2

[0074] The present invention also discloses an audio visualization terminal, which includes a memory, a processor, and a computer program stored on the memory and operable on the processor. When the processor executes the computer program, the audio frequency is realized. Visualize the individual steps in the method.


PUM


Abstract

The invention discloses an audio visualization method and terminal, and the method comprises the following steps: S1, obtaining audio data in real time, and carrying out the sorting of the audio data according to the frequency, and obtaining a data group D; S2, splitting the first n * m items of the data set D into n sub-arrays M1, M2,..., Mn with the same length, wherein each sub-array Mi comprises m pieces of data; S3, calculating each weighted average value A of each sub-array Mi and the position w of the maximum numerical value in each sub-array Mi in the sub-array; S4, inputting A, w and m of each sub-array into the data processing model, obtaining a starting point, a control point and an end point of a Bezier curve of each sub-array, and drawing to form the Bezier curve of the sub-array; and S5, connecting the Bezier curves of all the sub-arrays to form an audio visual image. According to the invention, the corresponding pattern can be displayed by acquiring the audio data, so that the image can be changed along with the change of the audio when the audio is played, and a corresponding visual effect is provided for people while the people listen to music.

Description

technical field [0001] The invention relates to the technical field of signal processing, in particular to an audio visualization method and terminal. Background technique [0002] With the development of society, there are more and more types of audio devices on the market, and their functions are more and more abundant. Many audio devices are provided with multiple audio input interfaces and multiple audio output interfaces. Some existing music software has visualization functions, such as the transformation of shapes, graphics, colors, etc. However, the audio data processing process of the existing audio visualization method is cumbersome, the processing time is long, and the display effect is poor. experience. Contents of the invention [0003] The object of the present invention is to provide an audio visualization method and terminal. The audio visualization method can display corresponding patterns by acquiring audio data, so that when the audio is played, the pat...

Claims


Application Information

Patent Timeline
Patent Type & Authority Applications(China)
IPC IPC(8): G06F16/44G06F16/483G06F16/64G06F16/683
Inventor 李山鑫
Owner FUJIAN STAR NET EVIDEO INFORMATION SYST CO LTD
Learn More