Method, system and equipment for drawing ground temperature curve graph of test point and medium

A technology of test points and graphs, applied in 2D image generation, image data processing, instruments, etc., can solve the problem of inconvenient post-informatization archiving and post-data re-extraction and utilization, and achieve convenient re-extraction and utilization, and improve Work efficiency, effect of reducing drawing time

Pending Publication Date: 2021-05-07
SHANGHAI MUNICIPAL ENG DESIGN INST GRP
View PDF4 Cites 1 Cited by
  • Summary
  • Abstract
  • Description
  • Claims
  • Application Information

AI Technical Summary

Problems solved by technology

[0003] The technical problem to be solved by the present invention is to overcome the drawbacks in the prior art that manual mapping is used to draw ground temperature curves, which is inconvenient for later informatization archiving and re-extraction and utilization of later data, and to provide a ground temperature curve for test points. Drawing method, system, device and medium

Method used


Image

  • Method, system and equipment for drawing ground temperature curve graph of test point and medium
  • Method, system and equipment for drawing ground temperature curve graph of test point and medium
  • Method, system and equipment for drawing ground temperature curve graph of test point and medium

Examples


Embodiment 1

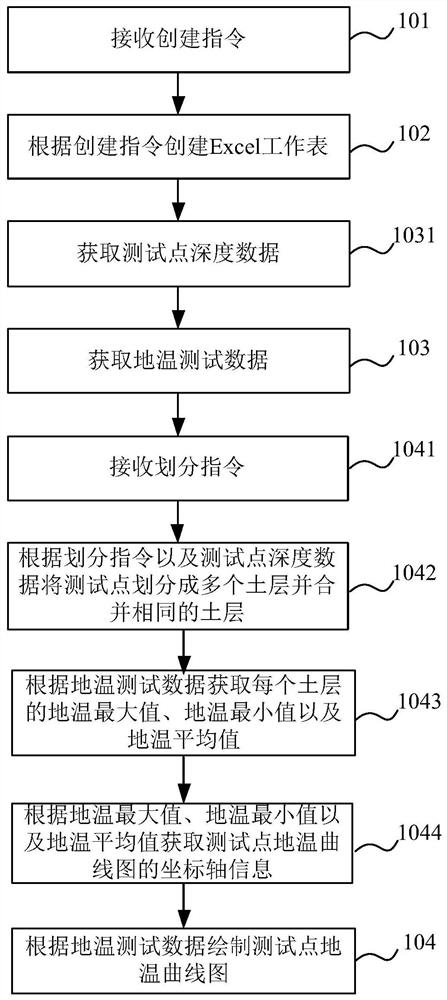
[0050] Such as figure 1 As shown, this embodiment provides a method for drawing geothermal curves at test points. The drawing method can be applied to the client, so it can be executed by the client. The client can be a tablet computer or a desktop computer, or it can be a Other clients that can run this drawing method are not specifically limited here. Specifically, the drawing method includes:

[0051] Step 101, receiving a creation instruction.

[0052] Step 102, create an Excel worksheet according to the creation instruction, and the Excel worksheet includes ground temperature test data.

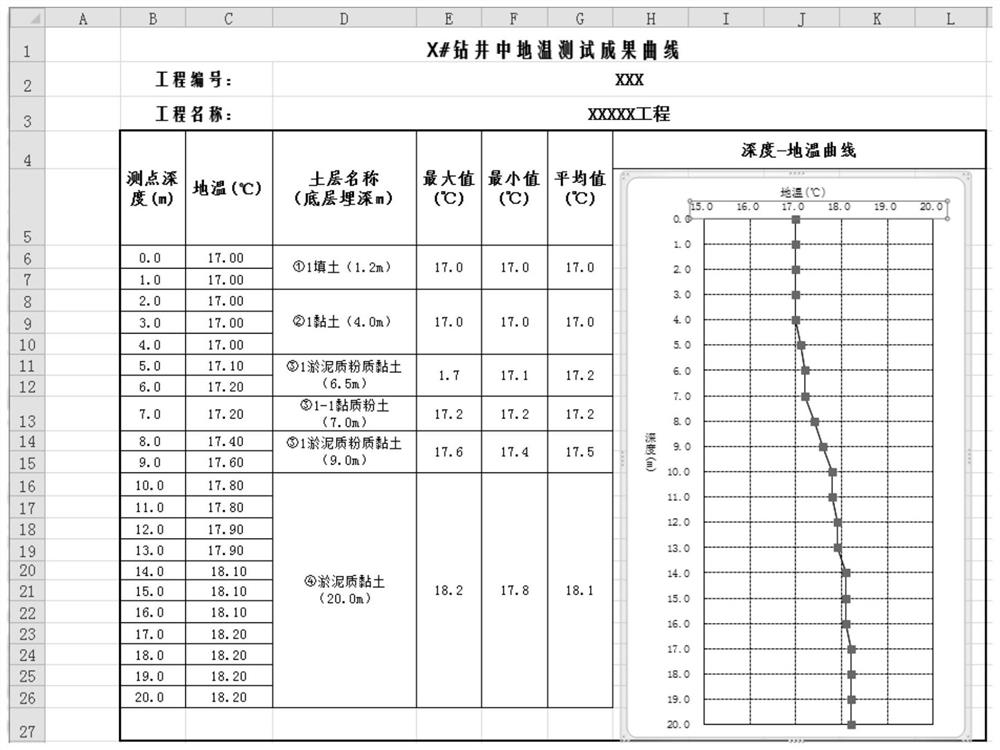
[0053] In this embodiment, the Excel worksheet also includes header information, project number and project name. For example, if figure 2 As shown, the header information in the Excel worksheet: the geothermal test result curve in X# drilling (that is, the geothermal test curve of the test point in X# drilling); project number: XXX; project name: XXXXX project; the header informati...

Embodiment 2

[0077] Such as Figure 4 As shown, this embodiment provides a system for drawing ground temperature curves at test points, and the drawing system includes a first receiving module 1 , a creation module 2 , a first acquisition module 3 and a drawing module 4 .

[0078] The first receiving module 1 is used for receiving creation instructions.

[0079] Creation module 2 is used to create an Excel worksheet according to the creation instruction, and the Excel worksheet includes geothermal test data.

[0080] In this embodiment, the Excel worksheet also includes header information, project number and project name. For example, if Figure 4 As shown, the header information in the Excel worksheet: the geothermal test result curve in X# drilling (that is, the geothermal test curve of the test point in X# drilling); project number: XXX; project name: XXXXX project; the header information can be set in the Excel work In the first row of the table, the project number and project name ...

Embodiment 3

[0104] Figure 5 It is a schematic structural diagram of an electronic device provided by Embodiment 3 of the present invention. The electronic equipment includes a memory, a processor, and a computer program stored on the memory and operable on the processor. When the processor executes the computer program, the method for drawing the ground temperature curve of the test point in Embodiment 1 is realized. Figure 5 The electronic device 30 shown is only an example, and should not limit the functions and scope of use of the embodiments of the present invention.

[0105] Such as Figure 5 As shown, electronic device 30 may take the form of a general-purpose computing device, which may be a server device, for example. Components of the electronic device 30 may include, but are not limited to: at least one processor 31 , at least one memory 32 , and a bus 33 connecting different system components (including the memory 32 and the processor 31 ).

[0106] The bus 33 includes a d...


PUM


Abstract

The invention discloses a method, system and equipment for drawing a ground temperature curve graph of a test point and a medium. The drawing method comprises the steps of receiving a creation instruction; creating an Excel worksheet according to the creation instruction, wherein the Excel worksheet comprises ground temperature test data; acquiring ground temperature test data; and drawing a test point ground temperature curve chart according to the ground temperature test data. According to the method, the ground temperature test data is acquired from the created Excel worksheet, and the ground temperature curve graph of the test point is drawn according to the ground temperature test data, so that the mode that the ground temperature test curve graph of the test point can be automatically drawn only by acquiring the ground temperature test data is adopted, later informatization archiving and later data re-extraction and utilization are facilitated, the drawing time of the ground temperature test curve graph of the test point is reduced, and the working efficiency is improved.

Description

technical field [0001] The invention relates to the field of geothermal test data processing, in particular to a method, system, equipment and medium for drawing geothermal curves at test points. Background technique [0002] At present, most geothermal curves are made by manual drawing. Firstly, a large amount of statistics are required before drawing, and mistakes are prone to occur in the statistical process. The process of drawing is mostly mechanical repetition; secondly, different technicians The standards are different and cannot be used uniformly; the results of manual mapping are not easy to archive in the later stage of informationization, and it is inconvenient to extract and use the data again in the later stage. Contents of the invention [0003] The technical problem to be solved by the present invention is to overcome the drawbacks in the prior art that manual mapping is used to draw ground temperature curves, which is inconvenient for later informatization ...

Claims


Application Information

Patent Timeline
Patent Type & Authority Applications(China)
IPC IPC(8): G06T11/20G06F40/18
CPCG06T11/203G06F40/18
Inventor 王庆磊陈严峻刘飞
Owner SHANGHAI MUNICIPAL ENG DESIGN INST GRP
Why Eureka
Try Eureka