
Data analysis method based on graphical presentation intercommunication

A technology for data analysis and number of calls, which is applied in the field of data analysis based on graphs to display mutual calls. It can solve problems such as low accuracy, easy omission of key clues, and a large number of call bill data, and achieves the effect of getting rid of data restrictions.

Pending Publication Date: 2022-05-13
INSPUR SOFTWARE TECH CO LTD
View PDF0 Cites 0 Cited by
  • Summary
  • Abstract
  • Description
  • Claims
  • Application Information

AI Technical Summary

Problems solved by technology

However, the reality is that there are a lot of bill data, and it is undoubtedly a difficult job for the case handlers to search and judge manually only through a simple bill list or simply converting the table into a graph, and the accuracy is not high. , it is easy to miss key clues

Method used


Image

  • Data analysis method based on graphical presentation intercommunication
  • Data analysis method based on graphical presentation intercommunication
  • Data analysis method based on graphical presentation intercommunication

Examples


Embodiment Construction

[0028] In order to make the purpose, technical solutions and advantages of the embodiments of the present invention clearer, the technical solutions in the embodiments of the present invention will be clearly and completely described below in conjunction with the drawings in the embodiments of the present invention. Obviously, the described embodiments It is a part of the embodiments of the present invention, but not all of them. Based on the embodiments of the present invention, all other embodiments obtained by those of ordinary skill in the art without creative work belong to the protection of the present invention. scope.

[0029] The present invention provides a method for visually displaying bill call data, comprising the following steps:

[0030] Step 1. Data preprocessing: establish the index of the owner’s name and the local number column for the call record table in the database to improve the efficiency of data retrieval; find the data in the data where the two part...


PUM


Abstract

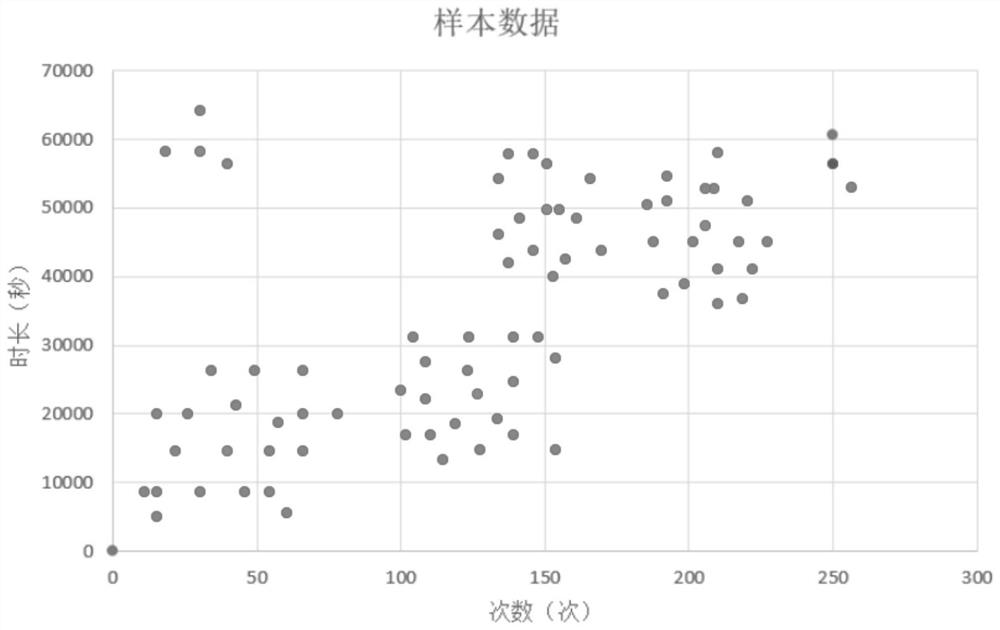
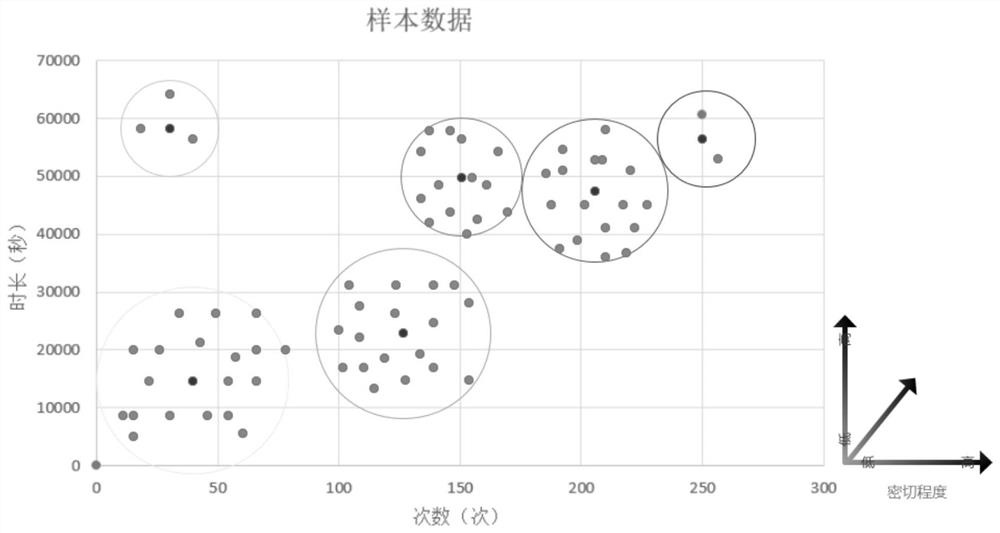
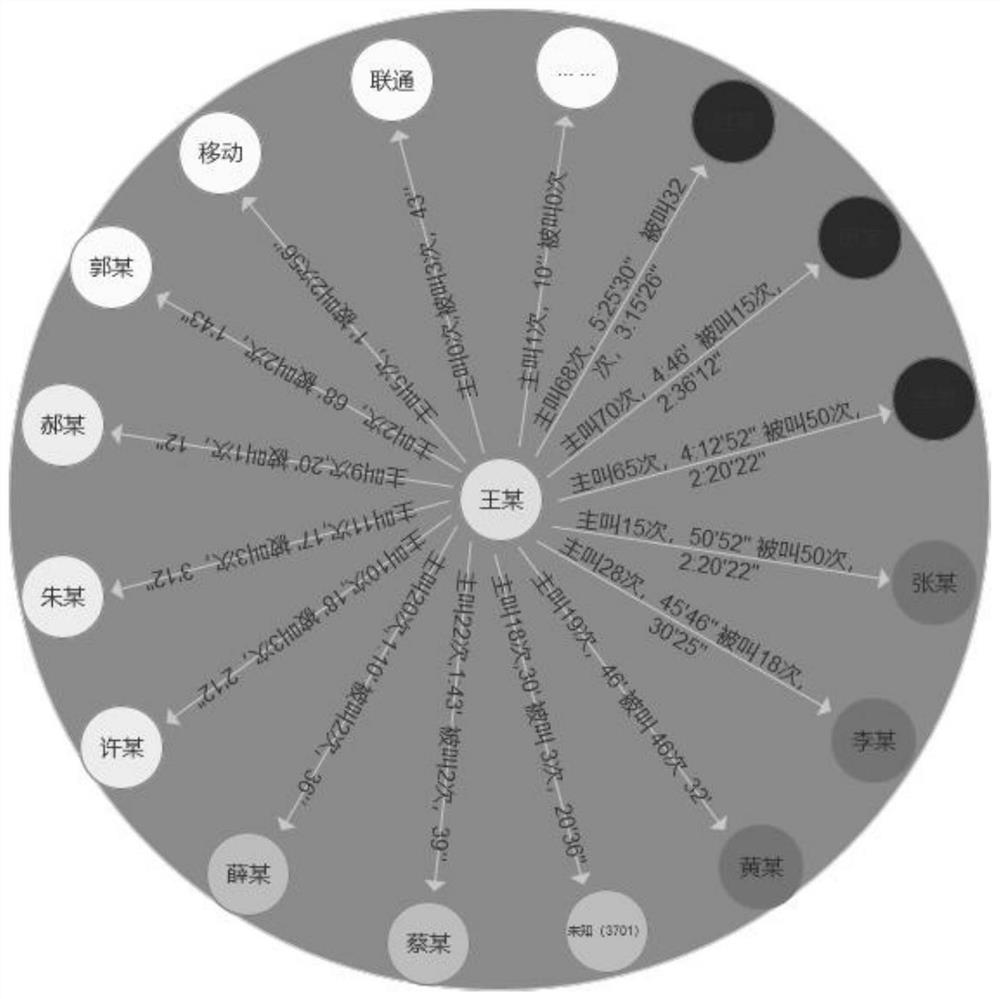
The invention provides a data analysis method for displaying mutual communication based on a graph, and belongs to the technical field of data processing and clustering. Call ticket data are integrated to obtain a mapping data set of communication duration and number of times, and then the mapping data set of the communication duration and number of times is obtained by using a bipartite k-means algorithm with the communication duration as a horizontal axis and the communication number of times as a longitudinal axis; call contact persons are clustered to obtain a plurality of possible relation person clusters, and weighting and position processing are carried out on different clusters according to a clustering result and abscissas (call times). And finally realizing the visual display of the call relation person and the call condition on the basis of the call behavior by means of a relational graph in a graphic display tool (such as echarts and other graphic tools supporting the relational graph according to the node relation and the position connection line).

Description

technical field [0001] The invention relates to the technical field of data processing and clustering, and in particular to a data analysis method based on graphic display and mutual communication. Background technique [0002] With the multi-dimensional and diverse development of surveillance business, the analysis of the suspect's call data has become an indispensable part of the case investigation process. However, the reality is that there are a lot of bill data, and it is undoubtedly a difficult job for the case handlers to search and judge manually only through a simple bill list or simply converting the table into a graph, and the accuracy is not high. , it is easy to miss key clues. Contents of the invention [0003] In order to solve the above technical problems, the present invention provides a data analysis method based on graphical display of mutual calls, which integrates and pre-analyzes the dialogue list data, and realizes the visual display of the parties ...

Claims


Application Information

Patent Timeline
IPC IPC(8): G06F16/2455G06F16/248G06F16/28G06K9/62
CPCG06F16/2455G06F16/248G06F16/285G06F18/23213
Inventor 张庆兵
Owner INSPUR SOFTWARE TECH CO LTD
Learn More