Method of using a gene expression profile to determine cancer responsiveness to an anti-angiogenic agent
a gene expression profile and anti-angiogenic agent technology, applied in the field of molecular diagnostic tests, can solve the problems of substantial differences in the effectiveness of many established drugs, the paradigm is clearly not the best treatment method for certain diseases, and approximately 70% will experience a recurren
- Summary
- Abstract
- Description
- Claims
- Application Information
AI Technical Summary
Benefits of technology
Problems solved by technology
Method used
Image
Examples
example 1
ocessing, Hierarchical Clustering, Subtype Identification and Classifier Development
Tumor Material.
[0123]Exemplary expression signatures were identified from gene expression analysis of a cohort of macrodissected epithelial serous ovarian tumor FFPE tissue samples sourced from the NHS Lothian and University of Edinburgh.
[0124]The protocol for histological classification of epithelial ovarian cancer to define serous, endometrioid, clear cell and mucinous histologies has recently been updated. One of the consequences of this is that many tumors that would previously been classified as endometrioid are now being classified as serous. (McCluggage, W. G. “Morphological subtypes of ovarian carcinoma: a review with emphasis on new developments and pathogenesis,” PATHOLOGY 2011 August; 43(5):420-32). Serous samples that were used in this study were among a larger set of epithelial ovarian cancer samples of all histologies that were harvested between 1984 and 2006. Pathology to assign histol...
example 2
Validation of the Angiogenesis Subtype and Angiogenesis Classifier Models
[0157]The performance of both the 25-gene (original approach) and 45-gene (reclassification approach) angiogenesis classifier models were validated by the Area Under the ROC (Receiver Operator Characteristic) Curve (AUC) within the original Almac epithelial serous ovarian cancer dataset and two independent datasets. The AUC is a statistic calculated on the observed disease scale and is a measure of the efficacy of prediction of a phenotype using a classifier model (Wray et. al., PLoS Genetics Vol 6, 1-9). An AUC of 0.5 is typical of a random classifier, and an AUC of 1.0 would represent perfect separation of classes. Therefore, in order to determine if the angiogenesis subtype classifier model is capable of predicting response to, and selecting patients for anti-angiogenic ovarian cancer therapeutic drug classes either as single agent or in combination with standard of care therapies, the hypothesis is that the...
example 4
ation of and in Silico Validation of an Anti-Angiogenic “Non-Responsive” Subgroup of Ovarian Cancer
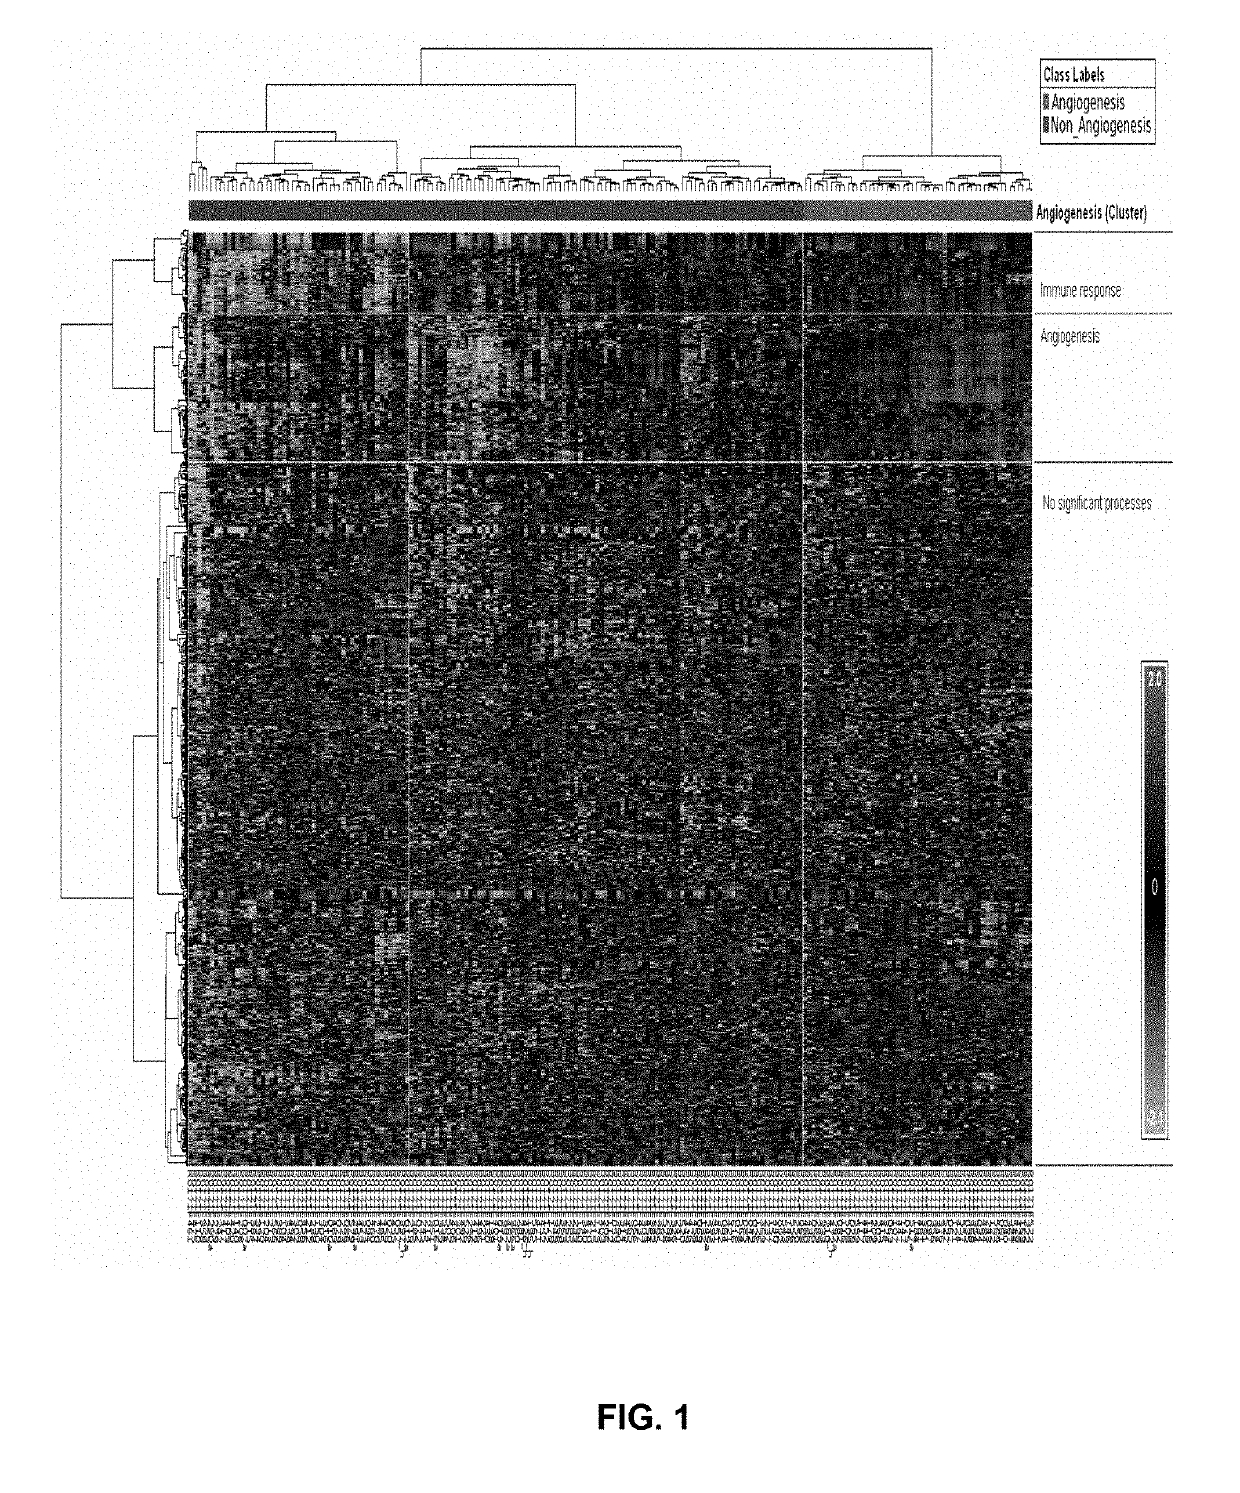
[0160]The expression of angiogenesis genes in probeset cluster 2 is down regulated in all samples in Cluster 2 of hierarchical clustering of 265 samples newly classified as serous (FIG. 6 and FIG. 10). These samples in sample cluster 2 have a better prognosis than the rest of the serous samples in samples from cluster 1 and 3 combined together as demonstrated in FIG. 11. This indicated that this group is defined by down regulation of expression of the angiogenesis genes identified in Table 2B. Patients with downregulation of genes involved in angiogeniesis and therefore this subgroup is termed a “non-responsive” group.” This phenotype has also been identified in ER+ and ER+ breast cancer as can be see the middle sample group in FIG. 12A and the second sample group in FIG. 12B.
PUM
| Property | Measurement | Unit |
|---|---|---|
| resistance | aaaaa | aaaaa |
Abstract
Description
Claims
Application Information
 - R&D
- Intellectual Property
- Life Sciences
- Materials
- Tech Scout
- Unparalleled Data Quality
- Higher Quality Content
- 60% Fewer Hallucinations
Browse by: Latest US Patents, China's latest patents, Technical Efficacy Thesaurus, Application Domain, Technology Topic, Popular Technical Reports.
© 2025 PatSnap. All rights reserved.Legal|Privacy policy|Modern Slavery Act Transparency Statement|Sitemap|About US| Contact US: help@patsnap.com


