Optimized data visualization according to natural language query

a data visualization and natural language technology, applied in the field of optimizing data visualization according to natural language query, can solve the problems of not being able to assist, becoming exponentially more difficult to graph or visualize, and all three-dimensional data properties do not lend themselves to these types of representations

Active Publication Date: 2020-02-25
INT BUSINESS MASCH CORP
View PDF30 Cites 2 Cited by
  • Summary
  • Abstract
  • Description
  • Claims
  • Application Information

AI Technical Summary

Problems solved by technology

Some spreadsheet program have graphing “wizards” which help the user configure a particular chart type, but they generally do not assist in picking the chart type which conveys the information that the user wants to communicate about the data.
When the data is multi-dimensional above two-dimensions, it becomes exponentially more difficult to graph or visualize because human brains are particularly limited in their abilities to comprehend multi-dimensional data.
All three-dimensional data properties do not lend themselves to these types of representations using three apparently orthogonal axes which are actually reflected onto a two-dimensional medium such as paper or a flat computer screen.
This, however, requires a certain level of expertise on the user's part to even know what these “relationships” are and to suspect that such a relationship exists in the data.
Such a situation, then, produces a quandary for a novice user, or for a user investigating a data set containing unknown or unidentified characteristics.

Method used


Image

  • Optimized data visualization according to natural language query
  • Optimized data visualization according to natural language query
  • Optimized data visualization according to natural language query

Examples


operational examples

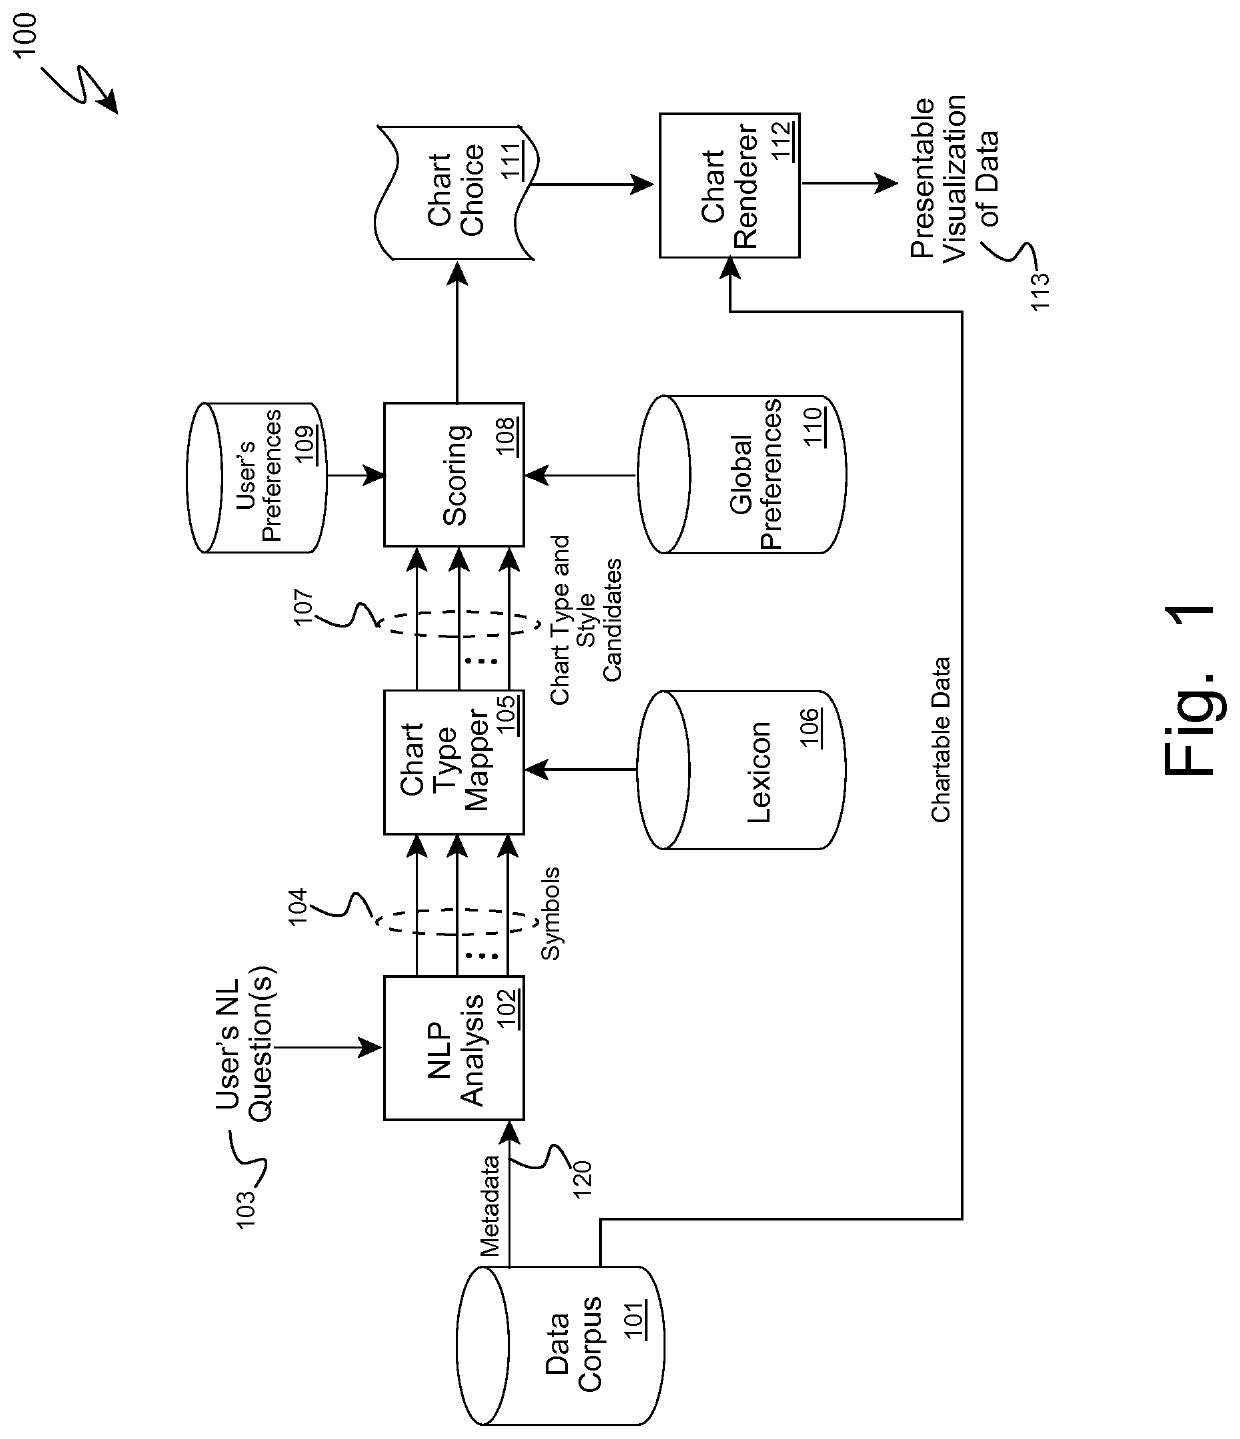
Consider a system initialized (500) as shown in FIG. 5. In a first example of operation, the user brings up their data in a web page or has data stored in a repository from business data. For the web example, the user enters a description of the data into an input field, and enters a natural language question about the data into a second input field. Next, the user clicks a button, the system performs the aforementioned operations, and an optimal chart is automatically selected and built for the user answering the question about their data. For repository data in a business process management system, the business analysts “asks questions” about the data, and a visualization for that data is presented to them.

Now, consider again the previous example regarding attendees to a conference event, and an analyst wishing to know the breakdown of attendees by country of origin. Suppose the data reflects answers of USA=15, Canada=10, India=5, China=9, and Brazil=4. The user might input a ques...


PUM


Abstract

An optimal visualization format for a data corpus is automatically selected and generated based upon a natural language query or statement about the data corpus from a user by accessing the subject data corpus; receiving the query or statement from the user a natural language expression; identifying symbols in the query or statement through natural language processing; mapping the symbols to weights for a plurality of visualization formats; scoring the visualization formats; and generating a visualization of the subject data corpus according to the scores. Optional metadata, such as row and column labels, database field labels, and XML DTD's may be mined for symbols, as well. The new tool may generate the visualization as a digital image file, a digital document file, a digital movie file, a digital three-dimensional model file, or a combination of these.

Description

FIELD OF THE INVENTIONThe invention generally relates automated methods, systems and tools which select and prepare a data visualization or graphical representation according to a user's natural language query and descriptive information about the subject data set.BACKGROUND OF INVENTIONTwo-dimensional data such as data which is represented in “flat” tables or spreadsheets is often converted into graphical visualizations such as pie charts, bar graphs, and the like. Such two-dimensional data can be described as having “meta-data” at least in the form of the row names and the column names. The graphical visualizations can be presented using colors and line styles (dashed, dotted, etc.) to make the data more easily discerned by a viewer. Some spreadsheet program have graphing “wizards” which help the user configure a particular chart type, but they generally do not assist in picking the chart type which conveys the information that the user wants to communicate about the data.It turns...

Claims


Application Information

Patent Timeline
Patent Type & Authority Patents(United States)
IPC IPC(8): G06F16/25G06F16/242
CPCG06F16/243
Inventor ALLEN, CORVILLE O.FREED, ANDREW RONALD
Owner INT BUSINESS MASCH CORP
Why Eureka
Try Eureka