Providing efficient graphical user interfaces for visualizing large datasets

a graphical user interface and dataset technology, applied in visual data mining, instruments, marketing, etc., can solve the problems of inefficient reporting, inaccurate conclusions and incorrect decisions, and conventional systems that fail to fully realize the insights that can be gained from large datasets, so as to reduce the number of user interactions

Active Publication Date: 2021-10-05
QUALTRICS
View PDF4 Cites 4 Cited by
  • Summary
  • Abstract
  • Description
  • Claims
  • Application Information

AI Technical Summary

Benefits of technology

[0007]Embodiments of the present disclosure provide benefits and / or solve one or more of the foregoing or other problems in the art with systems, non-transitory computer-readable media, and methods for an improved user interface for displaying and visualizing large amounts of data on computer devices. For example, the systems and methods provide a report management system for simultaneously visualizing large amounts of different types of data for presentation to a user via a computer device. For instance, the systems and methods provide, within a graphical user interface, a multidata display element that displays multiple types of data in a single display element. Further, in some embodiments, the systems and methods dynamically update the multidata display element within the graphical user interface to provide intuitive visualizations of changes to the multiple types of data over various time frames with a reduced number of needed user interactions.

Problems solved by technology

While there have been improvements in the collection and storage techniques of large amounts of data, conventional systems often fail to fully realize the insights that can be gained from large datasets due to the inability to provide users an efficient and effective way to interact with and understand the large datasets.
Indeed, the limited data reporting capabilities of most conventional systems often result in a time-intensive report building process that ultimately can result in inaccurate conclusions and incorrect decisions.
To illustrate, many conventional systems provide data reporting systems that are difficult to navigate and inefficient at creating reports.
Indeed, the number of parameters can become overwhelming when considering the amount of data types and the various different formats of reports a user may want to build to try and visualize the data.
The amount of parameter options often leads to a user providing numerous different selections and interactions in a time-consuming multiple-layer graphical interface process within a report builder interface to define parameters for even a single report.
Moreover, if the resulting report does not provide the insight or information the user wanted, the user may have to start over and further define or redefine the report parameters.
In addition to the inefficiencies of typical report building interfaces, the conventional process of generating a report based on defined report parameters further adds to the inefficiency of conventional systems.
For example, applying a set of report parameters to a large dataset may consume large amounts of processing and communication bandwidth to generate the report.
Indeed, even with the most state of art computer hardware, with large datasets the process of mining data to generate the report can take several minutes or longer.
For example, if a user wanted to know how perceived product quality related to increased sales, the system may only be able to provide that data in various pieces after the user clicks through many sales reports for many months and through many survey reports for many months.
This requires excessive interaction with the report viewer interface, and as such conventional systems often fail to provide a user-friendly presentation of large datasets.
Additionally, because conventional systems require many interactions in order to define report parameters and view report results, conventional systems are unable to use a user's (e.g., a survey administrator) interactions to understand reporting patterns or potential user interests in the data.
However, because many of the user's interactions with a conventional system are based on the user sorting through uninteresting data, conventional systems are unable to make accurate conclusions from the user's interactions with the report interface because many of the user's interactions, if not most, were not actually relevant to the user's interest.
Accordingly, conventional systems are unable to accurately recognize data in which the user is interested.
These along with additional problems and issues exist with regard to conventional systems.

Method used


Image

  • Providing efficient graphical user interfaces for visualizing large datasets
  • Providing efficient graphical user interfaces for visualizing large datasets
  • Providing efficient graphical user interfaces for visualizing large datasets

Examples


Embodiment Construction

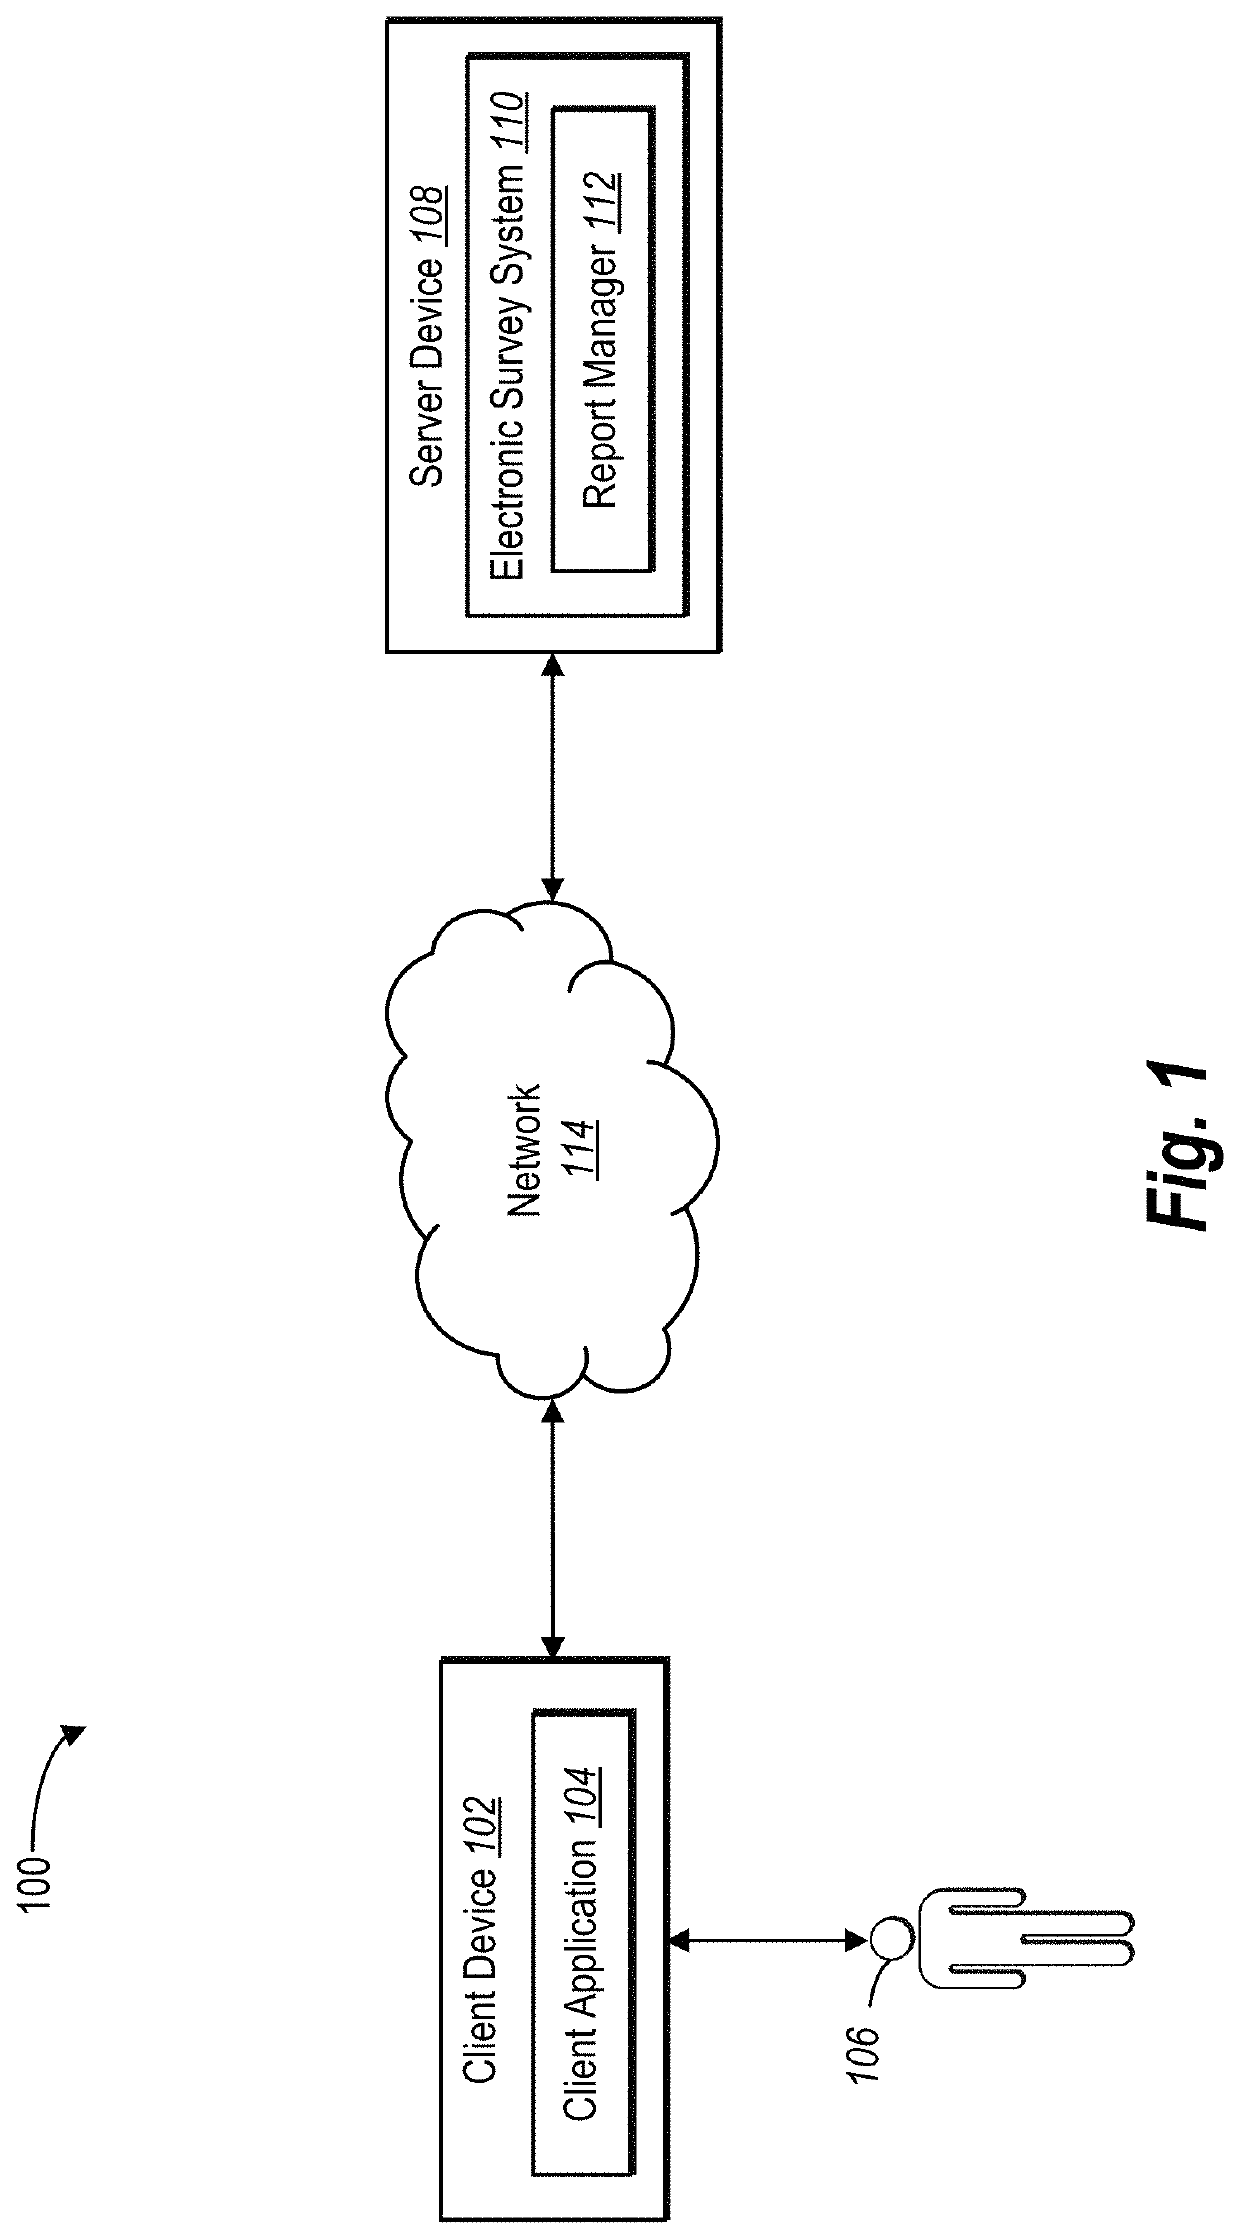
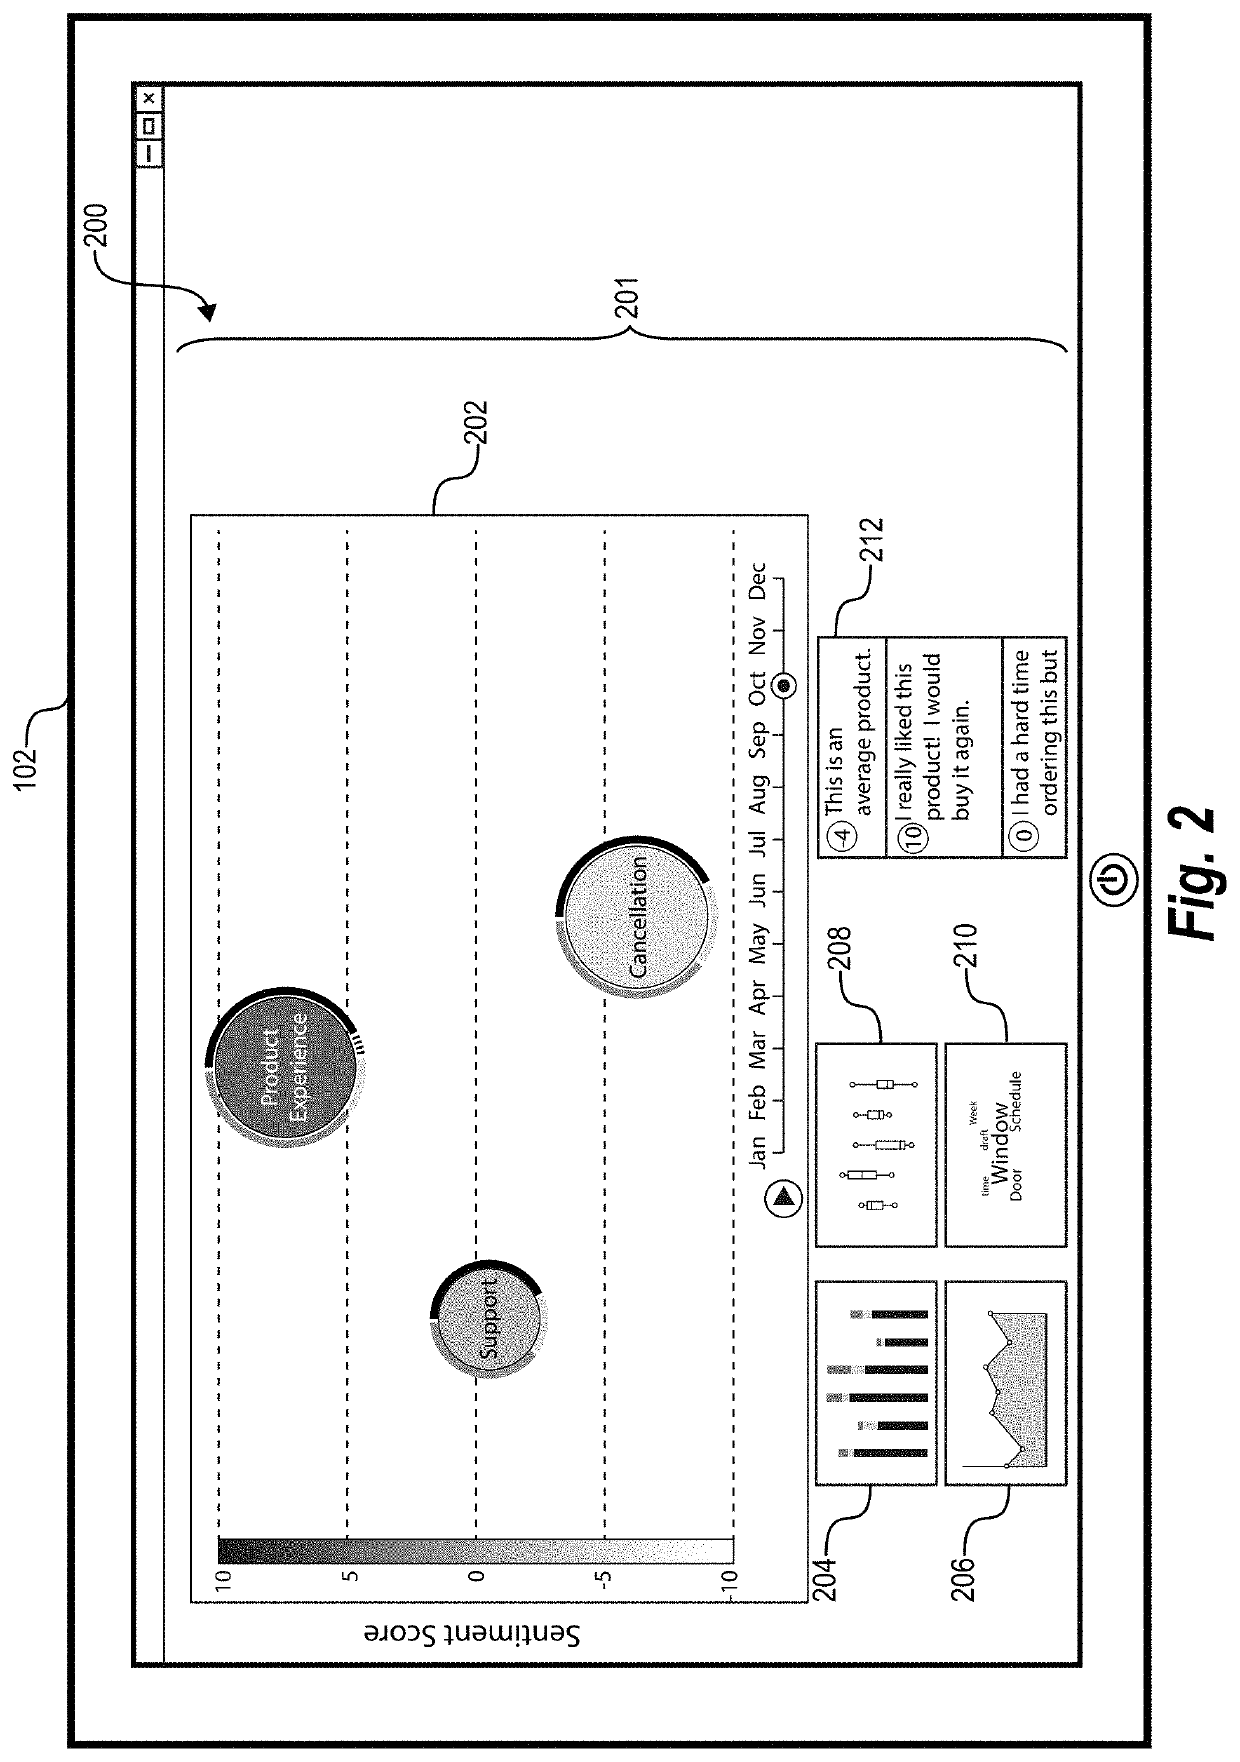
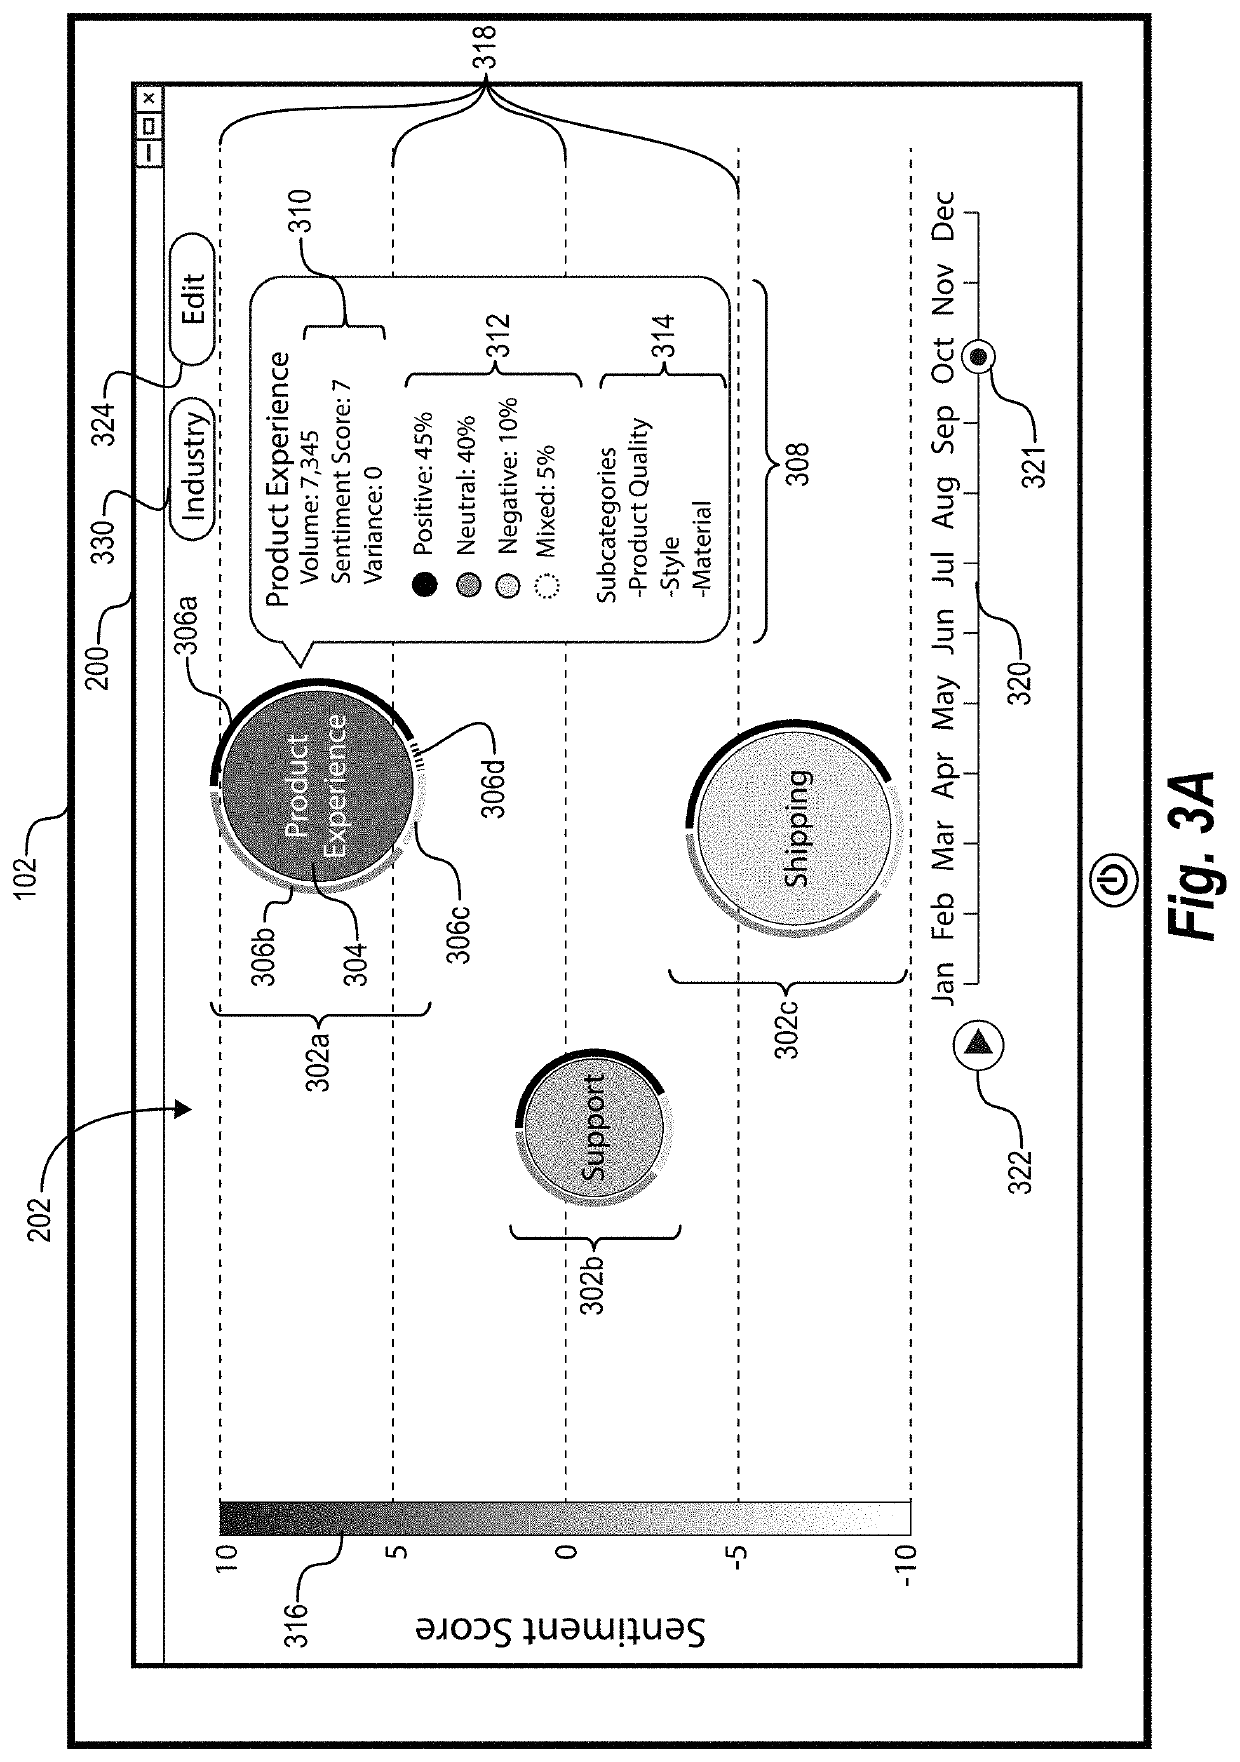
[0020]One or more embodiments disclosed herein provide a report management system for generating visualizations for large amounts of data within a graphical user interface. Various embodiments of the report management system generate and provide a multidata display element to visualize large datasets so the system can provide a display of many types of data simultaneously, on a single interface, and within a single display element. Additionally, embodiments of the report management system dynamically visualize large datasets by animating data changes within a multidata display element over time so that a user can easily recognize trends, dependencies, and / or other aspects of the various types of data within the large dataset. Further, in one or more embodiments the report management system generates hierarchies of visualizations to efficiently present views of various sub-categories of data that contribute to a larger set of data. For example, upon detecting a user interaction with ...


PUM


Abstract

The present disclosure relates to systems, non-transitory computer-readable media, and methods for efficiently providing a graphical user interface for visualizing large amounts of data on a single interface. In particular, in one or more embodiments, the disclosed systems utilize topic hierarchies and multidata display elements to intuitively present many types of data for many topics on a single interface. The system also uses an activatable timeline to visualize changes to large amounts of data over time.

Description

BACKGROUND[0001]Recent years have seen significant improvements in the collection and storage of large amounts of data to gain insight and knowledge about various topics. For example, various businesses use digital survey systems to collect information from their customers to attempt to understand how to improve products and services. Due to the prevalence of digital communications, digital survey systems can now collect large amounts of data from thousands or even millions of users. While there have been improvements in the collection and storage techniques of large amounts of data, conventional systems often fail to fully realize the insights that can be gained from large datasets due to the inability to provide users an efficient and effective way to interact with and understand the large datasets. Indeed, the limited data reporting capabilities of most conventional systems often result in a time-intensive report building process that ultimately can result in inaccurate conclusio...

Claims


Application Information

Patent Timeline
Patent Type & Authority Patents(United States)
IPC IPC(8): G06F16/9038G06Q30/02G06F3/0484
CPCG06F16/9038G06F3/04842G06Q30/0201G06F16/26
Inventor MORNINGSTAR, JAMIELINDHOUT, DAANGAO, SHANDEBENHAM, RYAN
Owner QUALTRICS
Why Eureka
Try Eureka