Performance reporting

a performance reporting and performance technology, applied in the field of performance reporting, can solve the problems of excessive time requirements to review all parameters of a business, excessive amount of data and/or number of parameter measurements, and excessive data

Inactive Publication Date: 2003-04-10
IBM CORP
View PDF23 Cites 57 Cited by
  • Summary
  • Abstract
  • Description
  • Claims
  • Application Information

AI Technical Summary

Problems solved by technology

Measuring performance is an exceedingly difficult task for a business or entity operating in today's information rich society.
Time requirements to review all parameters of a business are oftentimes cited as being excessive.
In addition, the amount of data and/or number of parameter measurements may be overwhelming and, hence, difficult to evaluate.
Furthermore, data may not be communicated in a timely fashion.
Another obstacle is that raw data is oftentimes presented as raw data.
When raw data is not placed in context by, for example, comparison to a parameter target or a previous parameter measurement value where no target is set, it makes a determination on how a particular parameter is performing very difficult.
In addition, the raw data may lack context relative to overall business performance or a part of the overall business.
Consequently, a user cannot effectively make decisions in an appropriate manner.
Another challenge is that differe...

Method used


Image

  • Performance reporting
  • Performance reporting
  • Performance reporting

Examples


Embodiment Construction

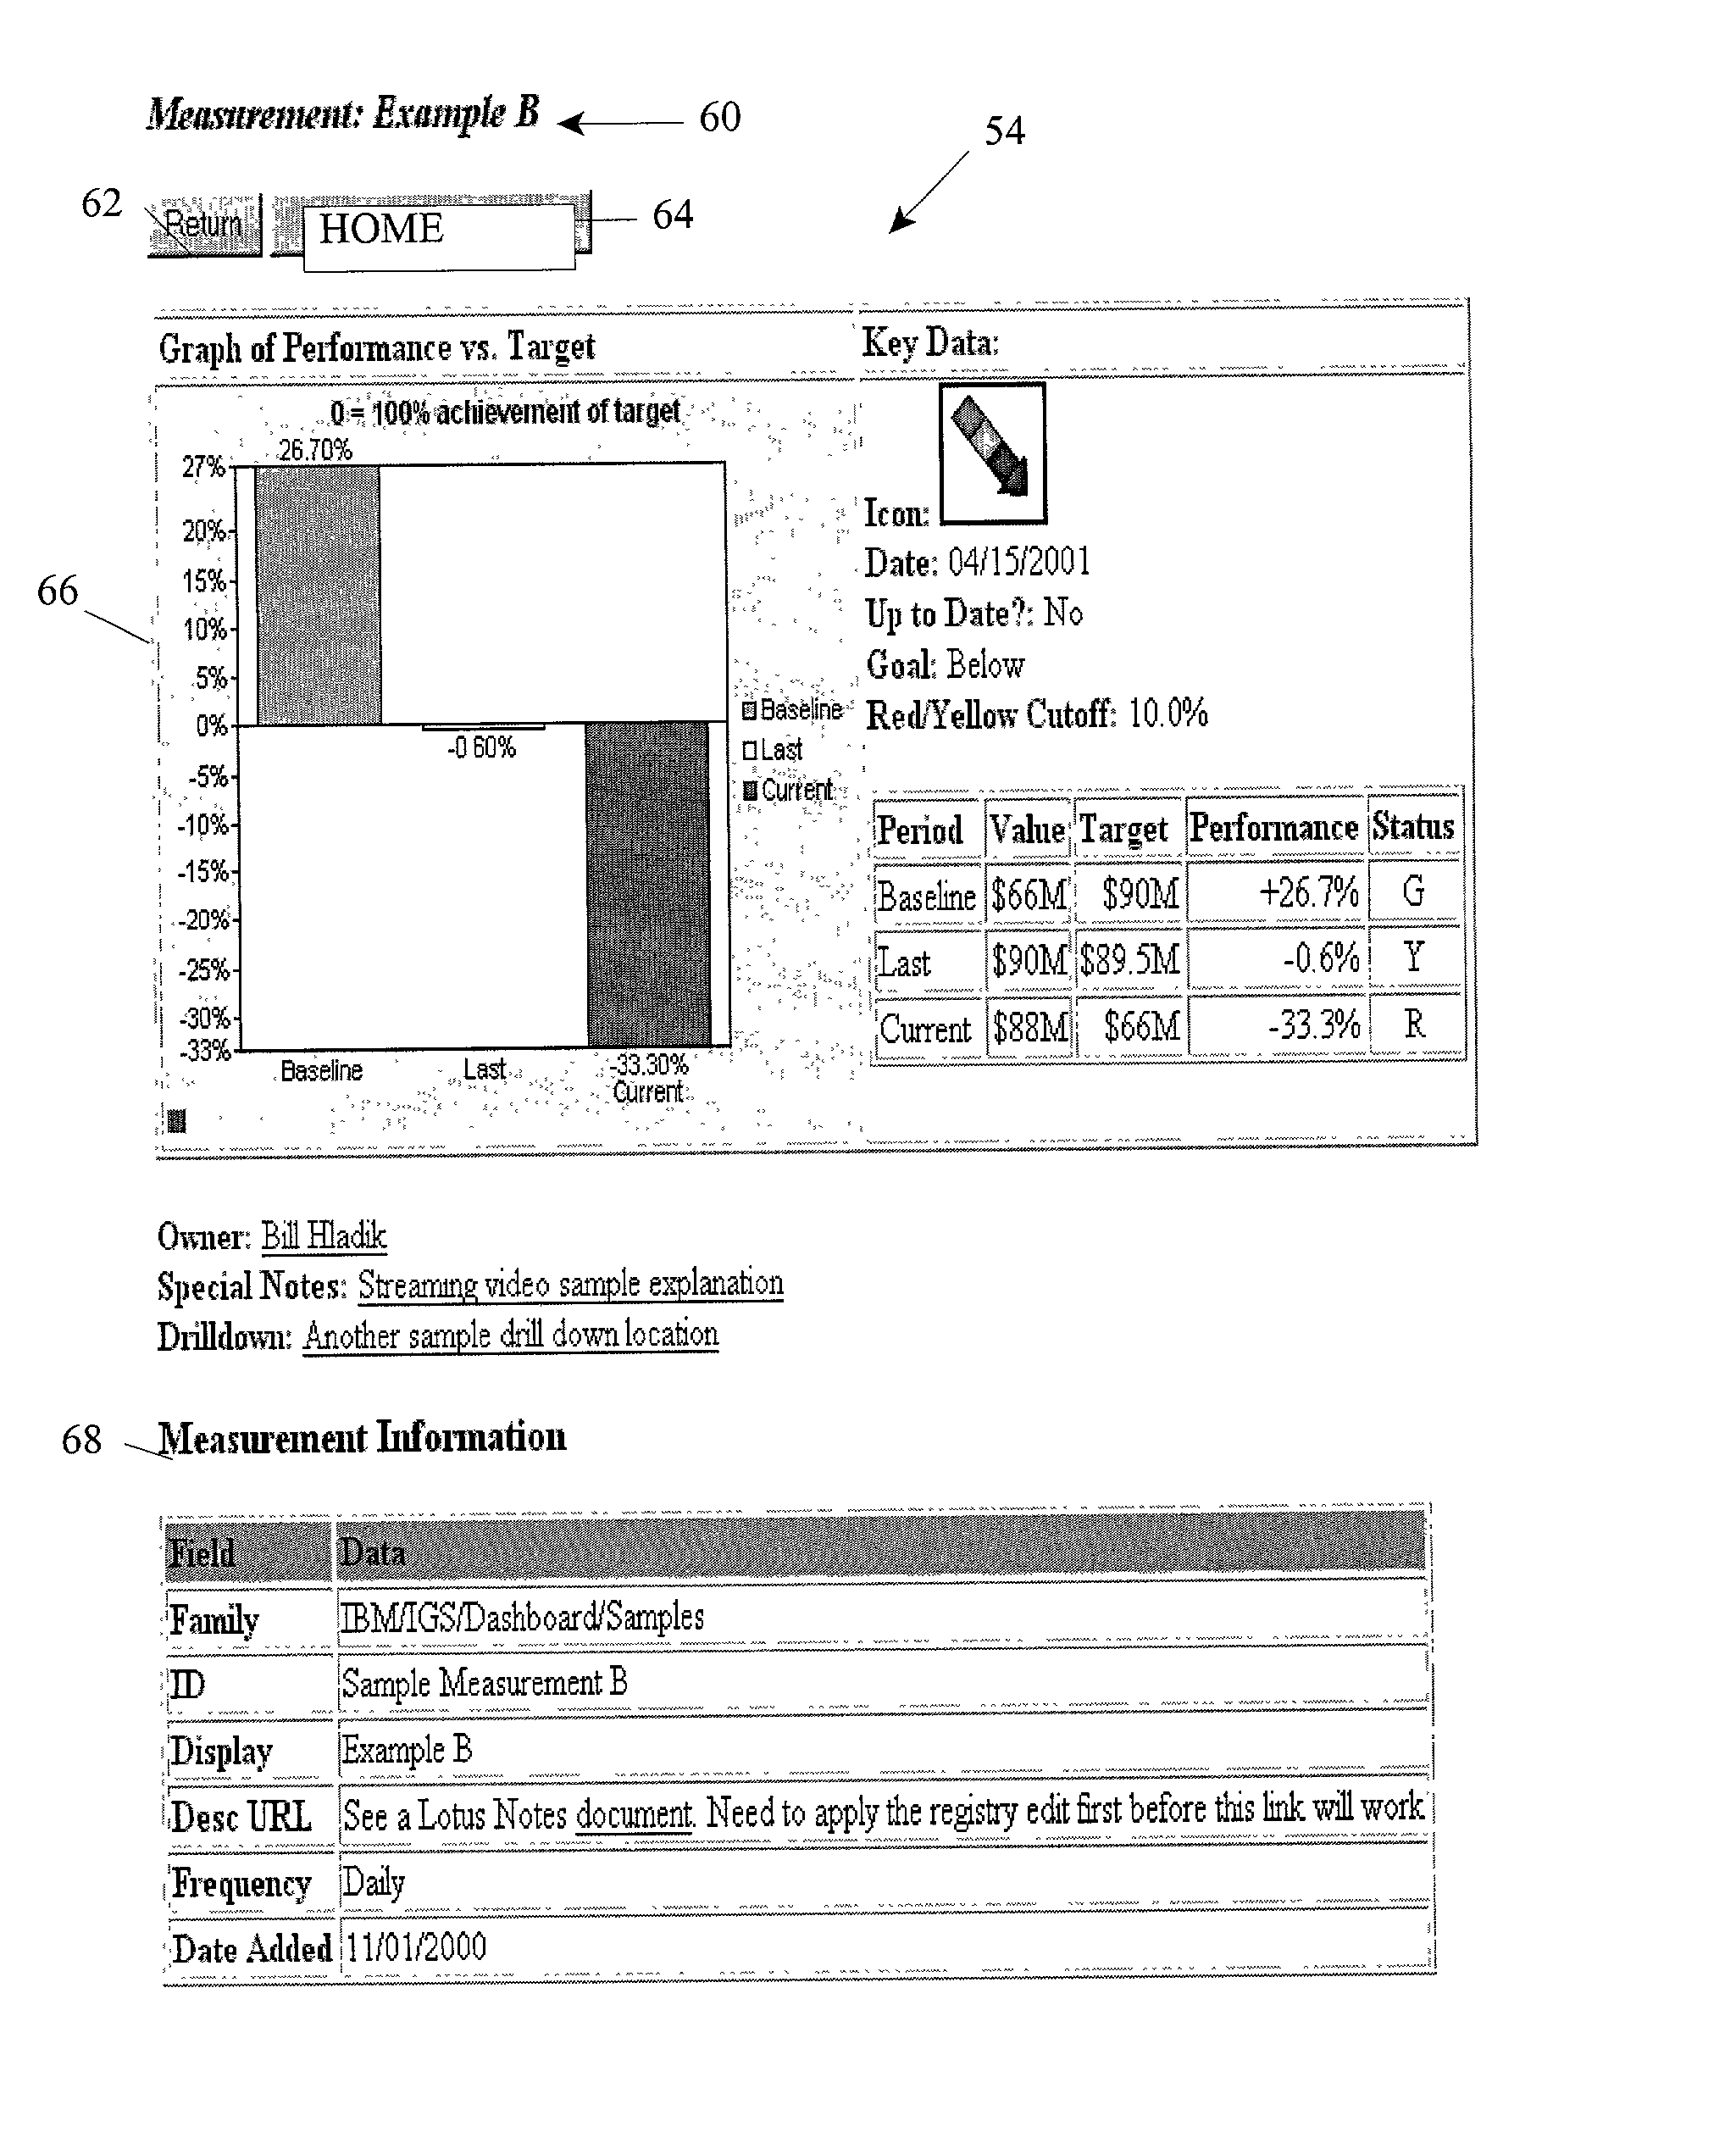
; navigation buttons including a "Return" button 62 to take the user back to the previous page from which they came; a "Home" button 64 to take the user to the page defined as the home page for the reporter set; a table 66 including measurement and performance data; and measurement information 68.

[0082] Table 66 may include a bar graph of the performance ratings for the measurement's baseline period, last measurement period and current measurement period. The line at 0% means 100% achievement of target. Anything above that line means it beat the target and below that line means it missed the target. Each bar is colored according to its status: Red, Yellow or Green. The height of the bars refers to the performance. The right hand side of the table may contain the measurement data including, for example: Indicator Icon Type (if this measurement has a second level of data, this indicator may be linked to that location, e.g., a uniform resource locator URL); Date: the last instance of t...


PUM


Abstract

The present invention provides a method, system and program product that provides a user with a high level view of the health of their business by reporting parameter performance in a simple, "at a glance" display. Each parameter's performance is represented using a common indicator icon which can show the parameter's current performance, immediately previous performance, baseline performance and trend as compared to previous values for the measurement. The system allows users to view parameter performances using the same reporting system. The invention also allows a user to organize several parameters into logical groupings and obtain a weighted average of their performance; retrieve detailed information about a given parameter; and/or check his/her parameter's performance via a small, wireless, pervasive device.

Description

[0001] 1. Technical Field[0002] The present invention relates generally to performance reporting and, more particularly, to a method, system and program product for reporting performance of a plurality of measurements having different measurement dimensions.[0003] 2. Related Art[0004] Measuring performance is an exceedingly difficult task for a business or entity operating in today's information rich society. There are a number of reasons for this problem:[0005] Time requirements to review all parameters of a business are oftentimes cited as being excessive. In addition, the amount of data and / or number of parameter measurements may be overwhelming and, hence, difficult to evaluate. Furthermore, data may not be communicated in a timely fashion.[0006] Another obstacle is that raw data is oftentimes presented as raw data. When raw data is not placed in context by, for example, comparison to a parameter target or a previous parameter measurement value where no target is set, it makes a...

Claims


Application Information

Patent Timeline
IPC IPC(8): G06Q10/06G06Q10/10
CPCG06Q10/06G06Q10/10G06Q10/0639
Inventor HLADIK, WILLIAM J. JR.SMITH, MICHELLE L.
Owner IBM CORP
Why Eureka
Try Eureka