Automated generator of optimal models for the statistical analysis of data

a statistical analysis and automatic generator technology, applied in the field of statistical modeling and analysis, can solve problems such as limited sample data availability

Active Publication Date: 2004-11-04
DANIEL H WAGNER ASSOCS
View PDF5 Cites 33 Cited by
  • Summary
  • Abstract
  • Description
  • Claims
  • Application Information

AI Technical Summary

Benefits of technology

[0015] Provided is an automated process for producing accurate statistical models to fit sample data tables. The process constructs and analyzes all reasonable statistical models that fit the sample data table provided, solves for the optimal parameters of the statistical models, and computes test statistics to check the fit of each model with the sample data table. The process uses these test statistics, combined with information about the degrees of freedom in the model, to compute a model score that allows the process to generate a complete ordering of the statistical models analyzed and to present a model that is deemed to be most suitable to the sample data table. In cases where the number of possible statistical models is prohibitively high, the process begins by constructing and solving more general models and then constructs and solves those more detailed models that are similar to those general models which are highest in the generated ordering. The process then presents the model with the highest ordering, as well as a set of average table values corresponding to the statistical model, including average values for table entries that were lacking initial information.

Problems solved by technology

In general, they have available only limited sample data to estimate the desired probabilities or average number of events.

Method used


Image

  • Automated generator of optimal models for the statistical analysis of data
  • Automated generator of optimal models for the statistical analysis of data
  • Automated generator of optimal models for the statistical analysis of data

Examples


Embodiment Construction

should be read together with the accompanying drawings, wherein:

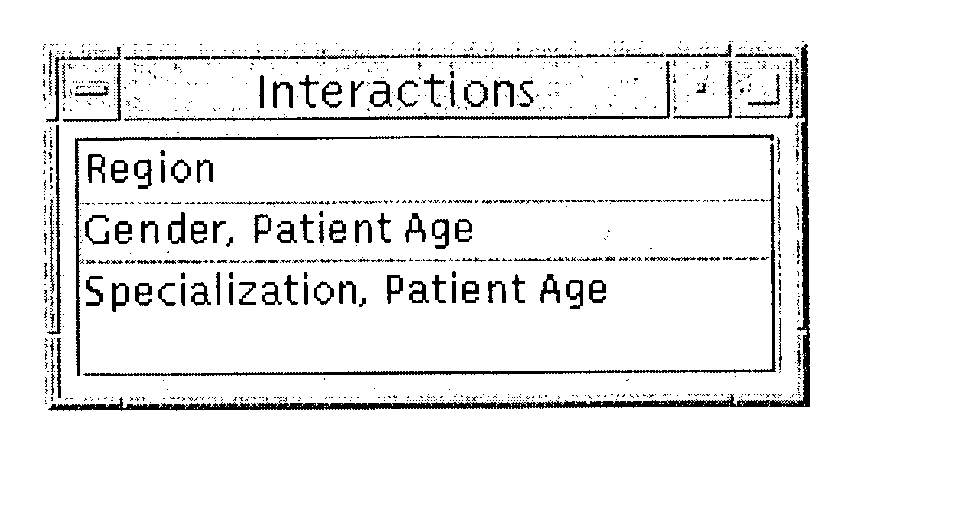
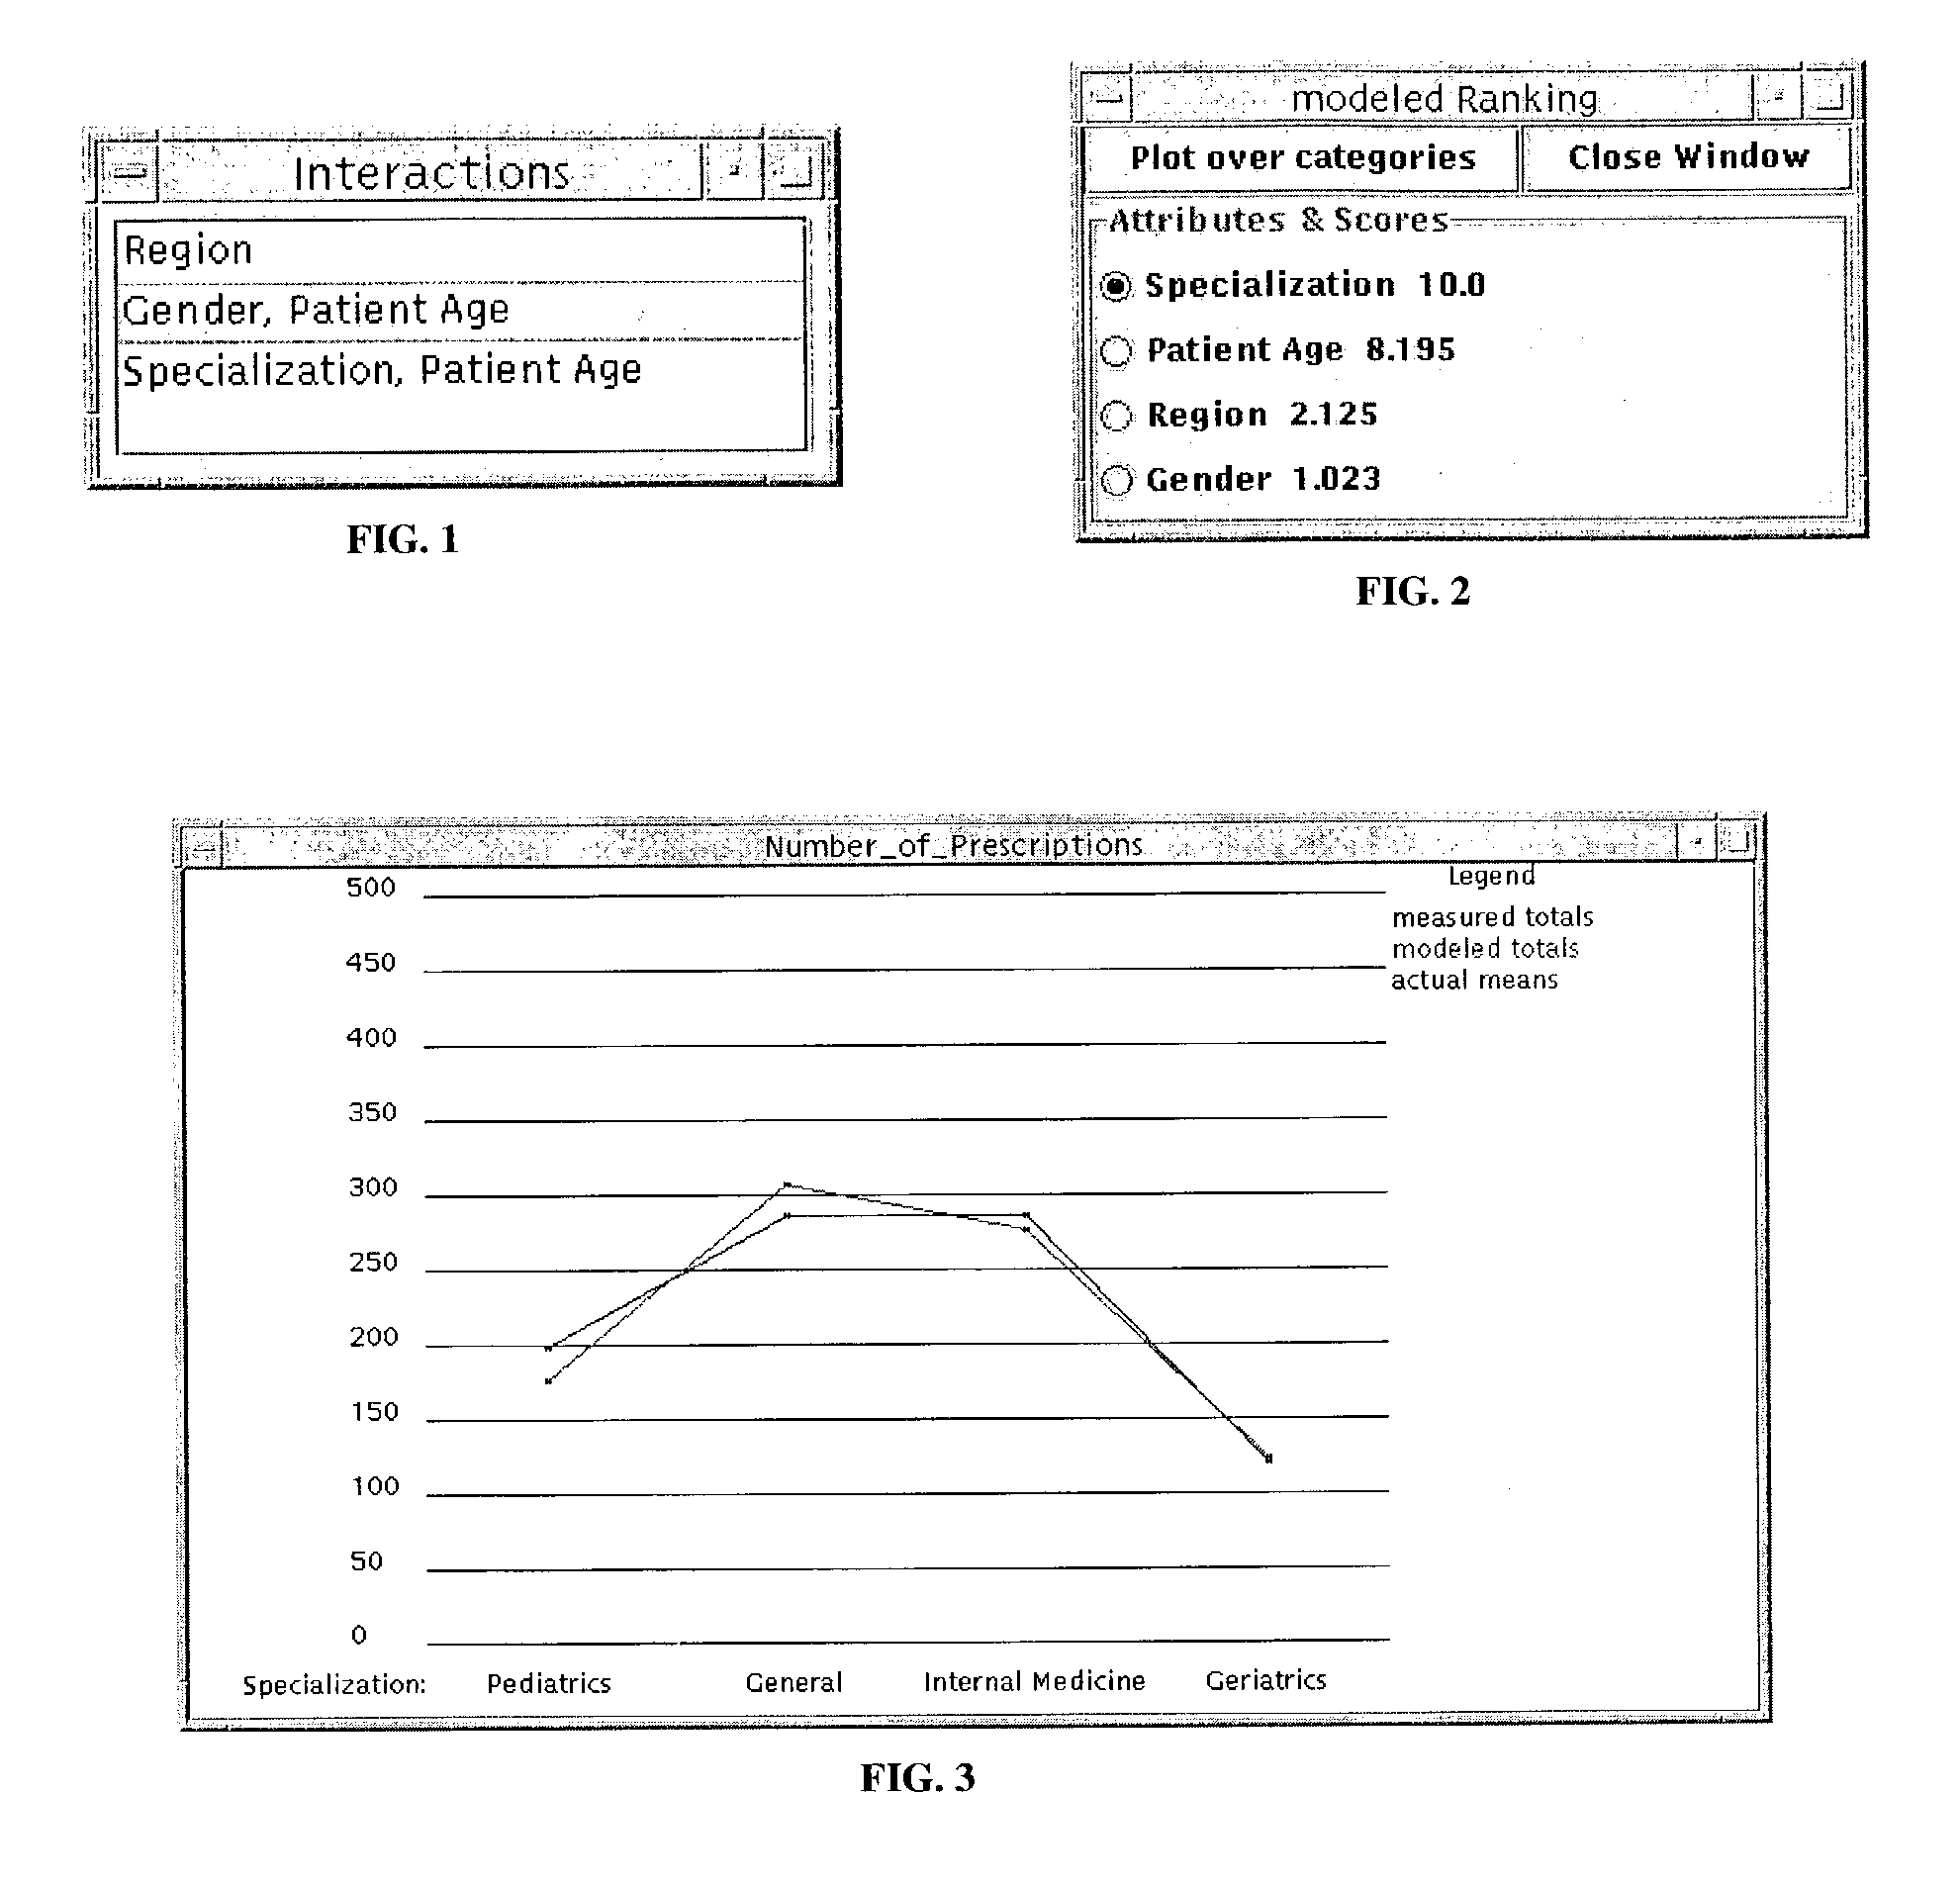
[0023] FIG. 1 is a display showing groups of factors which interact in a model according to the present invention;

[0024] FIG. 2 is a menu displaying influential factors in the model output;

[0025] FIG. 3 is a plot showing the number of all prescriptions written as a function of physician specialization in an example presented according to the present invention; and

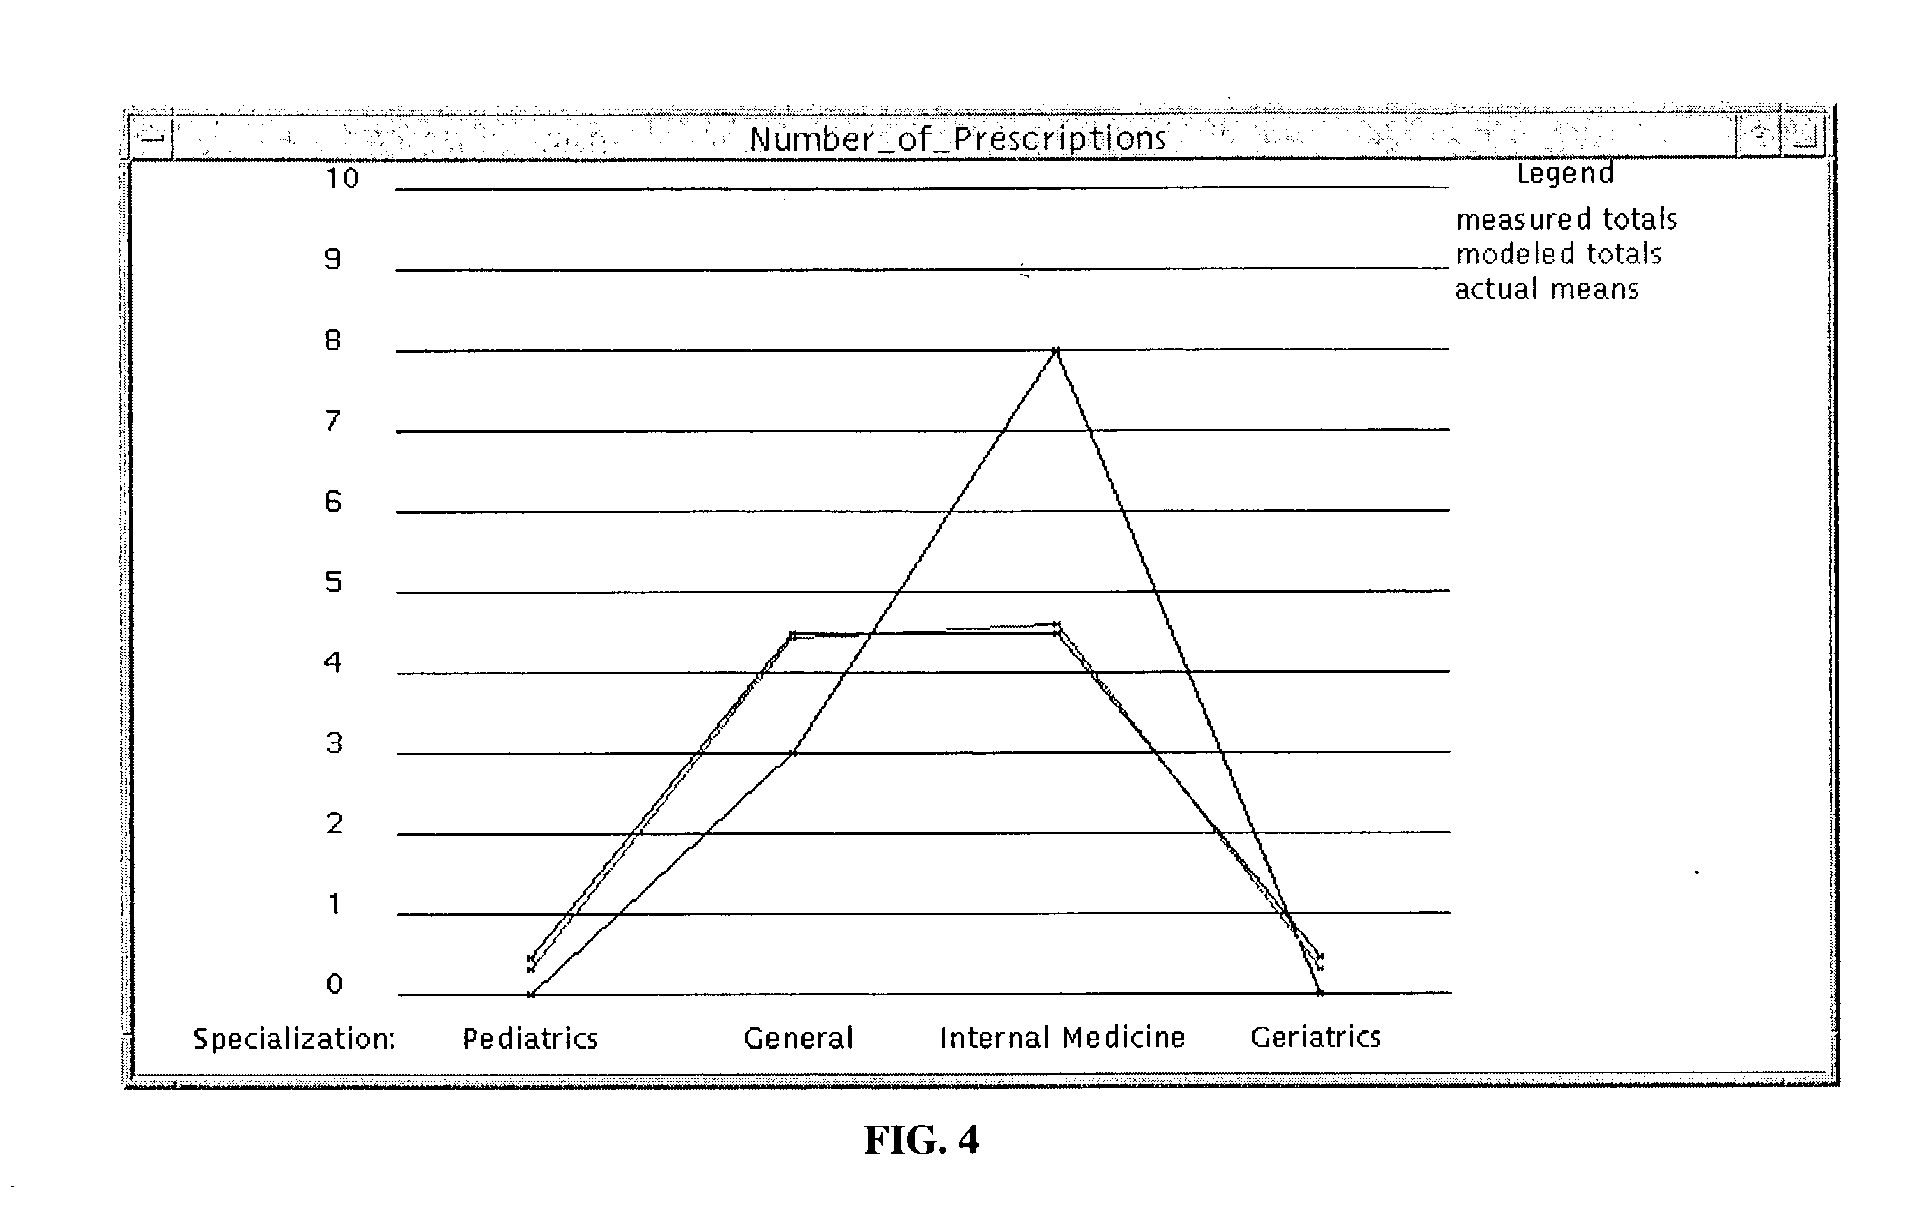
[0026] FIG. 4 is a plot showing the number of prescriptions written for males aged 19-35 in the Southwest as a function of physician specialization in the example of FIG. 3.

[0027] The present invention employs discrete category regression methods similar to linear regression methods. Both categorical and linear regression methods fall into a general category known as General Linear Models. The models dealing with categorical data are more advanced than those dealing with linear data, using more sophisticated modeling and requiring more computationally intensive...


PUM


Abstract

Provided is an automated process for producing accurate statistical models from sample data tables. The process solves for the optimal parameters of each statistical model considered, computes test statistics and degrees of freedom in the model, and uses these test statistics and degrees of freedom to establish a complete ordering of the statistical models. In cases where the sample data table is sufficiently small, the process constructs and analyzes all reasonable statistical models that might fit the data table provided. In cases where the number of possible models is prohibitively high, the process begins by constructing and solving more general models and then constructs and solves those more detailed models that are similar to those general models that achieved the highest ordering. In either of these two cases, the process arrives at a statistical model that is highest in the ordering and is thus deemed most suitable to model the sample data table. The result of this process is a statistical model deemed to be most suitable to model the sample data table and a set of average table values produced by this resulting model. This resulting table may include modeled values for table entries for which no initial data was supplied. This invention finds application in the area of credit scoring, where covariates such as age, profession, gender, and credit history are used to determine the likelihood that an individual will default on a loan. It also finds application in analyzing the effectiveness of many types of tools as they are used in various environments (e.g., the effectiveness of radar when used in different weather conditions). It also finds application in the area of insurance, where one wishes to estimate the future number of claims against a specific insurance policy based on a database of past insurance claims.

Description

[0002] 1. Technical Field of the Invention[0003] This invention relates generally to statistical modeling and analysis. This invention relates specifically to the automated process of building, analyzing and creating a hierarchy of statistical models fit to a test data set.[0004] 2. Description of the Related Art[0005] There has been a longstanding need for a method which would provide automated statistical analysis employable in a wide variety of applications, including detailed analysis of initial data mining results. The method would produce answers to several key questions, such as[0006] a. How different factors affect the probability of a given event;[0007] b. Which factors are most influential in determining the probability of a given event or the number of occurrences of a given event; and[0008] c. How different factors affect the average number of occurrences of a specific event.[0009] Examples of these questions are:[0010] How do race, age, and gender affect the probability...

Claims


Application Information

Patent Timeline
Patent Type & Authority Applications(United States)
IPC IPC(8): G06F17/18
CPCG06F17/18
Inventor STEPHENSON, DAVID MARKMONACH, WILLIAM REYNOLDS
Owner DANIEL H WAGNER ASSOCS
Why Eureka
Try Eureka