Event occurrence graph

a graph and event technology, applied in the field of graphic displays, can solve the problems of inability to adequately represent the relationship and nature of events in an easy-to-understand forma

Inactive Publication Date: 2005-11-03
KOODALI ANURAG T
View PDF8 Cites 154 Cited by
  • Summary
  • Abstract
  • Description
  • Claims
  • Application Information

AI Technical Summary

Problems solved by technology

However while plotting complex event occurrence information, these graphs do not adequately represent the relationship and nature of these occurrences in an easy to understand format.

Method used


Image

  • Event occurrence graph
  • Event occurrence graph
  • Event occurrence graph

Examples


Embodiment Construction

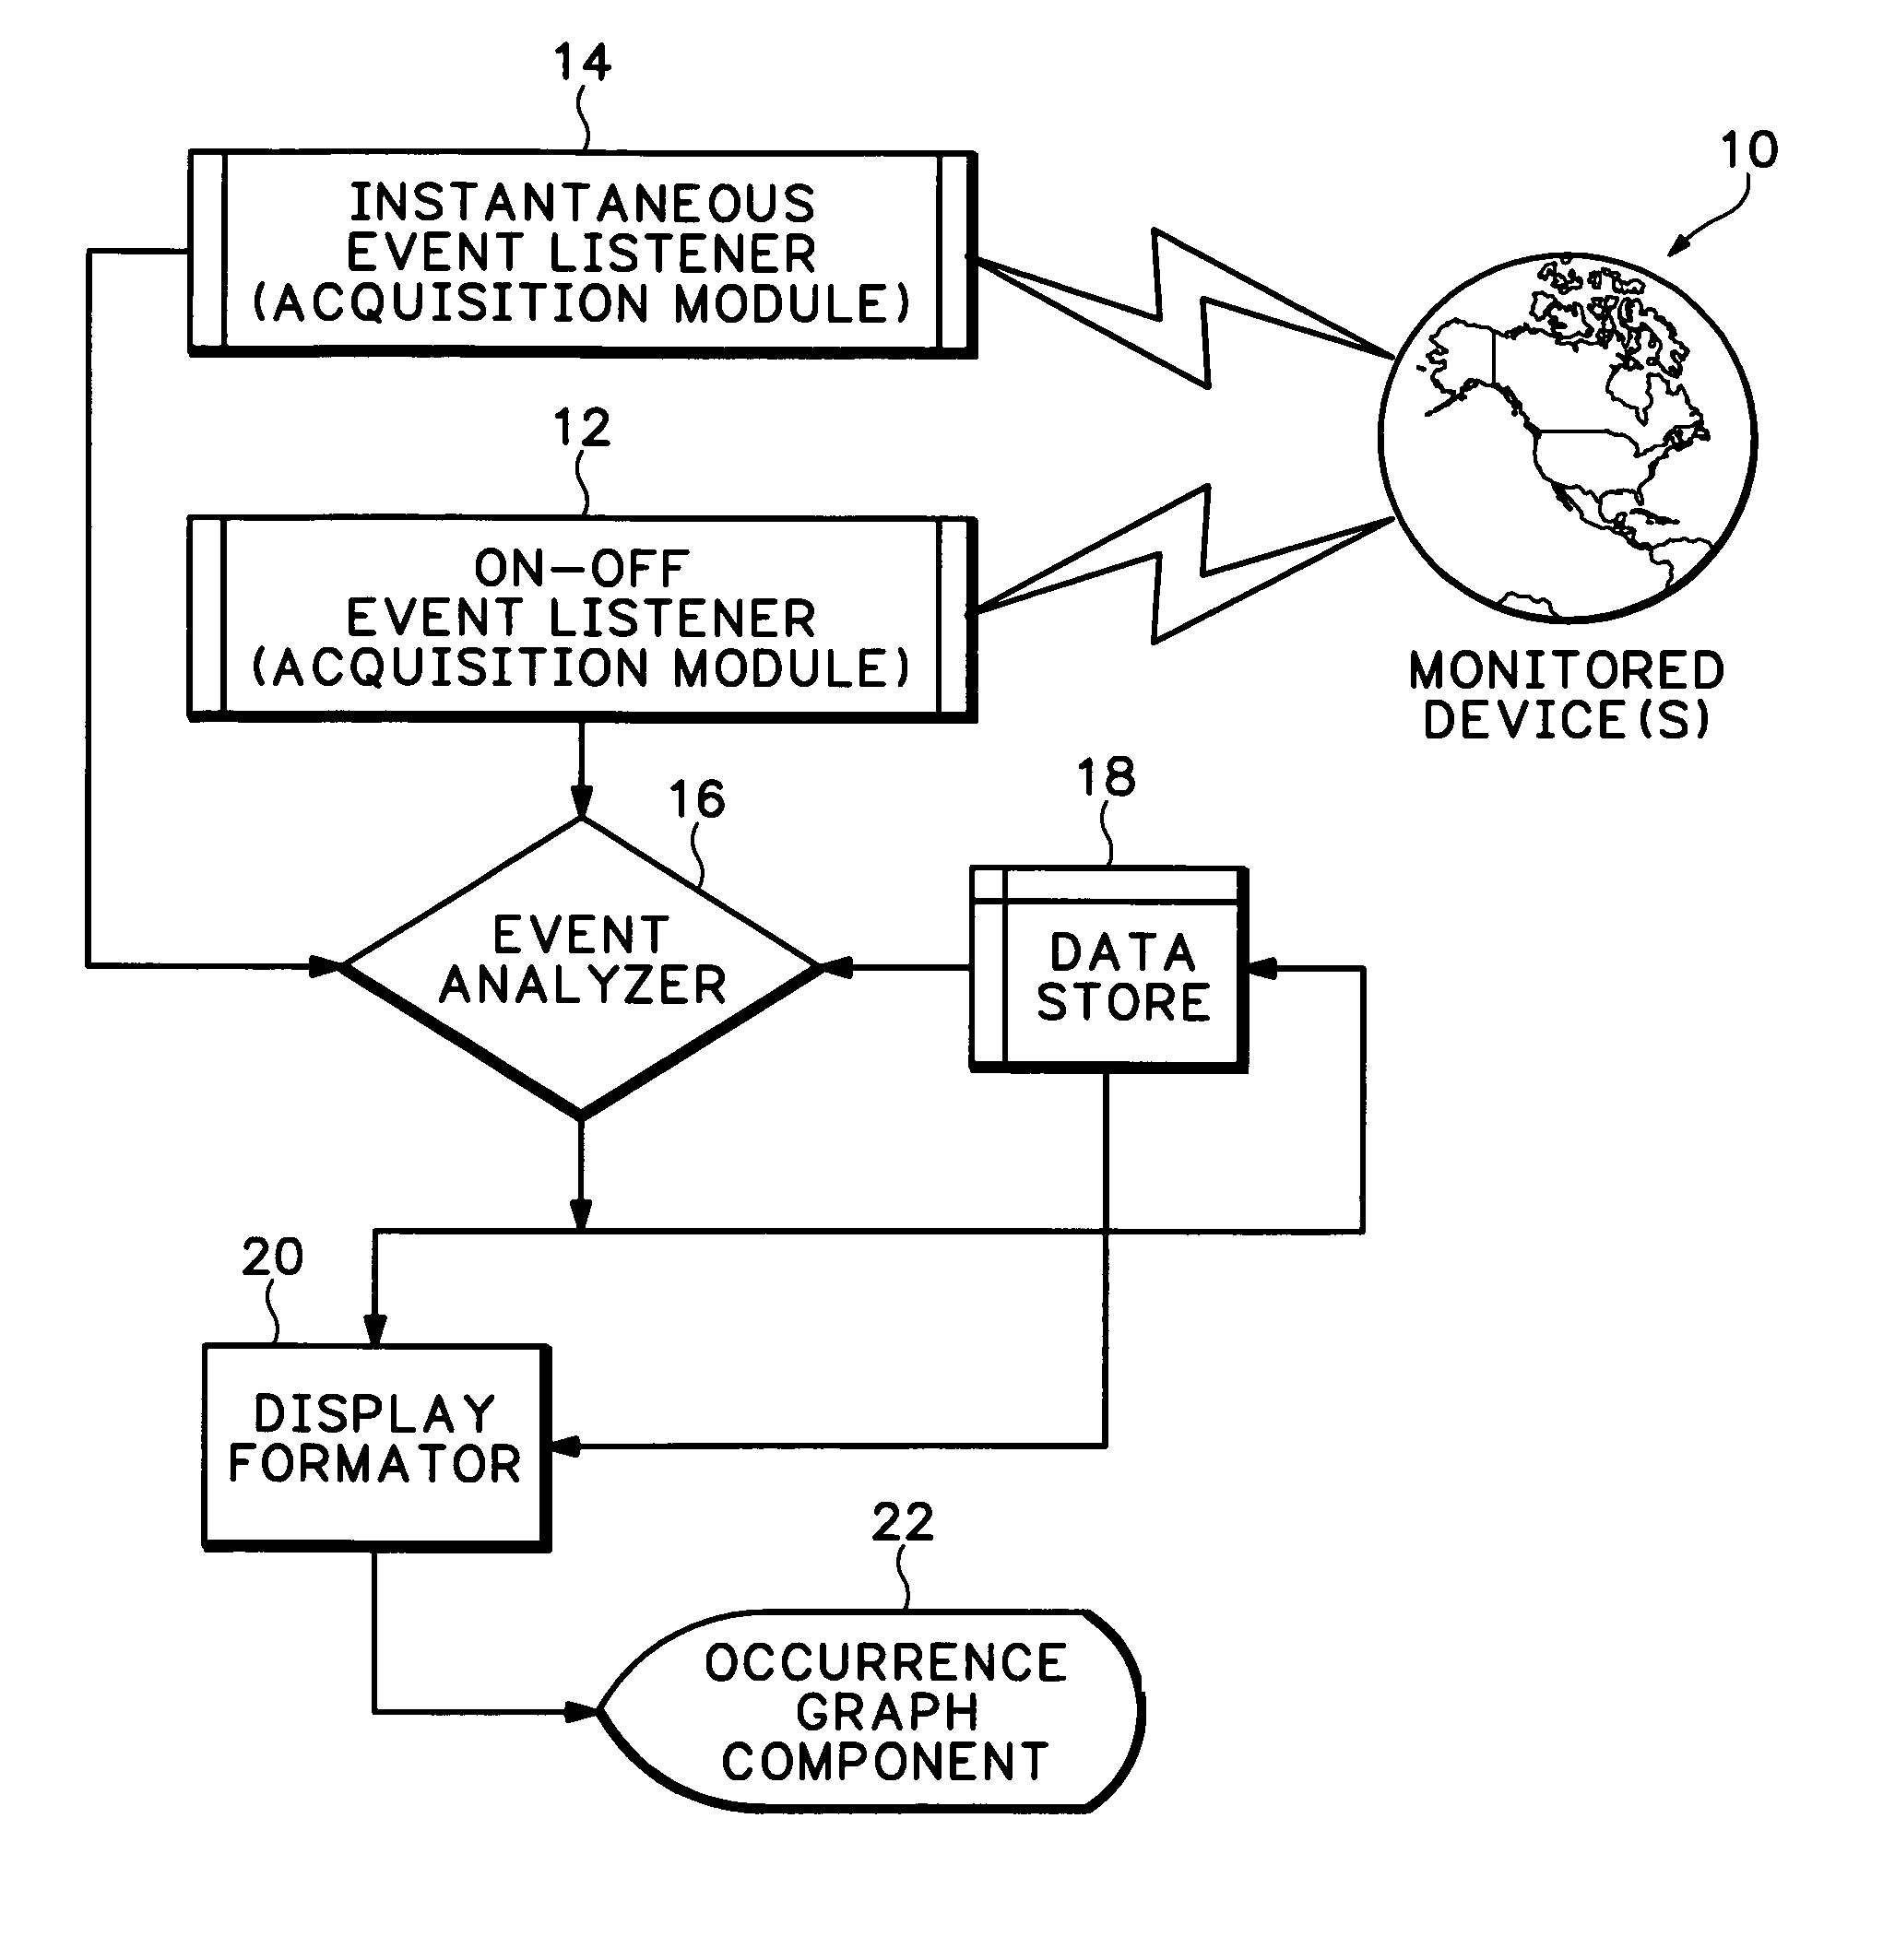
[0017] Referring now to FIG. 1, a monitored device 10 or set of devices, such as different types of video test and measurement devices coupled to a video network for monitoring the video network adherence to applicable standards, are monitored by two acquisition modules 12, 14 at a central location. The first acquisition module 12 records “on-off” events and records the presence or absence of an event. The second acquisition module 14 monitors for intermittent errors that are instantaneous in nature. The data collected from the acquisition modules 12, 14 are transferred to an event analyzer module 16 which records and stores the events in a data store 18. The event analyzer 16 also correlates the “on” to “off” states and determines data that needs to be displayed.

[0018] When the event analyzer 16 encounters events that need to be notified to a user, the data from the data store 18 is transferred to a display formatter 20. The display formatter 20 organizes the data in a format that...


PUM


Abstract

An event occurrence graph for display of events from a monitoring device or set of devices has a time-series of recorded events as a timeline, each event having a separate marker. Different event groups in the time-series occur at different levels, and the markers for the events in each event group may be distinctive from markers for the events in other event groups. Also lines may be drawn connecting start and stop events within an event group. The timeline may be zoomed, and the time scale adjusted automatically accordingly.

Description

BACKGROUND OF THE INVENTION [0001] The present invention relates to graphic displays, and more particularly to an event occurrence graph display for test and measurement products. [0002] In most products which report the occurrence of an event at a particular time, there is a requirement to visually represent such occurrences. Further there is a requirement to represent such events in relation to each other for analyzing sequences of events. When monitoring several events remotely over a network to which different event generators are coupled, such as MPEG stream testers, waveform monitors and the like in a video situation, it may be desired to see how different alarms created by the different event generators relate to each other. There have been many ways of displaying such event occurrence information, all of which aim at plotting events on a time-series graph. However while plotting complex event occurrence information, these graphs do not adequately represent the relationship a...

Claims


Application Information

Patent Timeline
Patent Type & Authority Applications(United States)
IPC IPC(8): G06F19/00H04N17/04
CPCH04N17/04
Inventor KOODALI, ANURAG T.
Owner KOODALI ANURAG T
Why Eureka
Try Eureka