Intelligent data summarization and visualization

a data summarization and intelligent technology, applied in the field of data summarization, can solve the problem of eliminating the need for manual exploration by users, and achieve the effect of effectively characterizing the entire database and quick generating a relatively small number

Inactive Publication Date: 2005-11-24
MITSUBISHI ELECTRIC INFORMATION TECH CENT AMERICA ITA
View PDF5 Cites 35 Cited by
  • Summary
  • Abstract
  • Description
  • Claims
  • Application Information

AI Technical Summary

Benefits of technology

[0006] A goal of the intelligent data summarization (IDS) is to quickly generate a relatively small number of these graphs that effectively characterize the entire database.

Problems solved by technology

However, unless the database is very small, presenting multiple views does not eliminate the need for manual exploration by the user.

Method used


Image

  • Intelligent data summarization and visualization
  • Intelligent data summarization and visualization
  • Intelligent data summarization and visualization

Examples


Embodiment Construction

[0037]FIG. 3 shows a method 300 according to the invention for summarizing a database and visualizing a summary of the database. A query 301 for the database is represented as a vector including multiple elements. Each element is a control, and each control has a current setting.

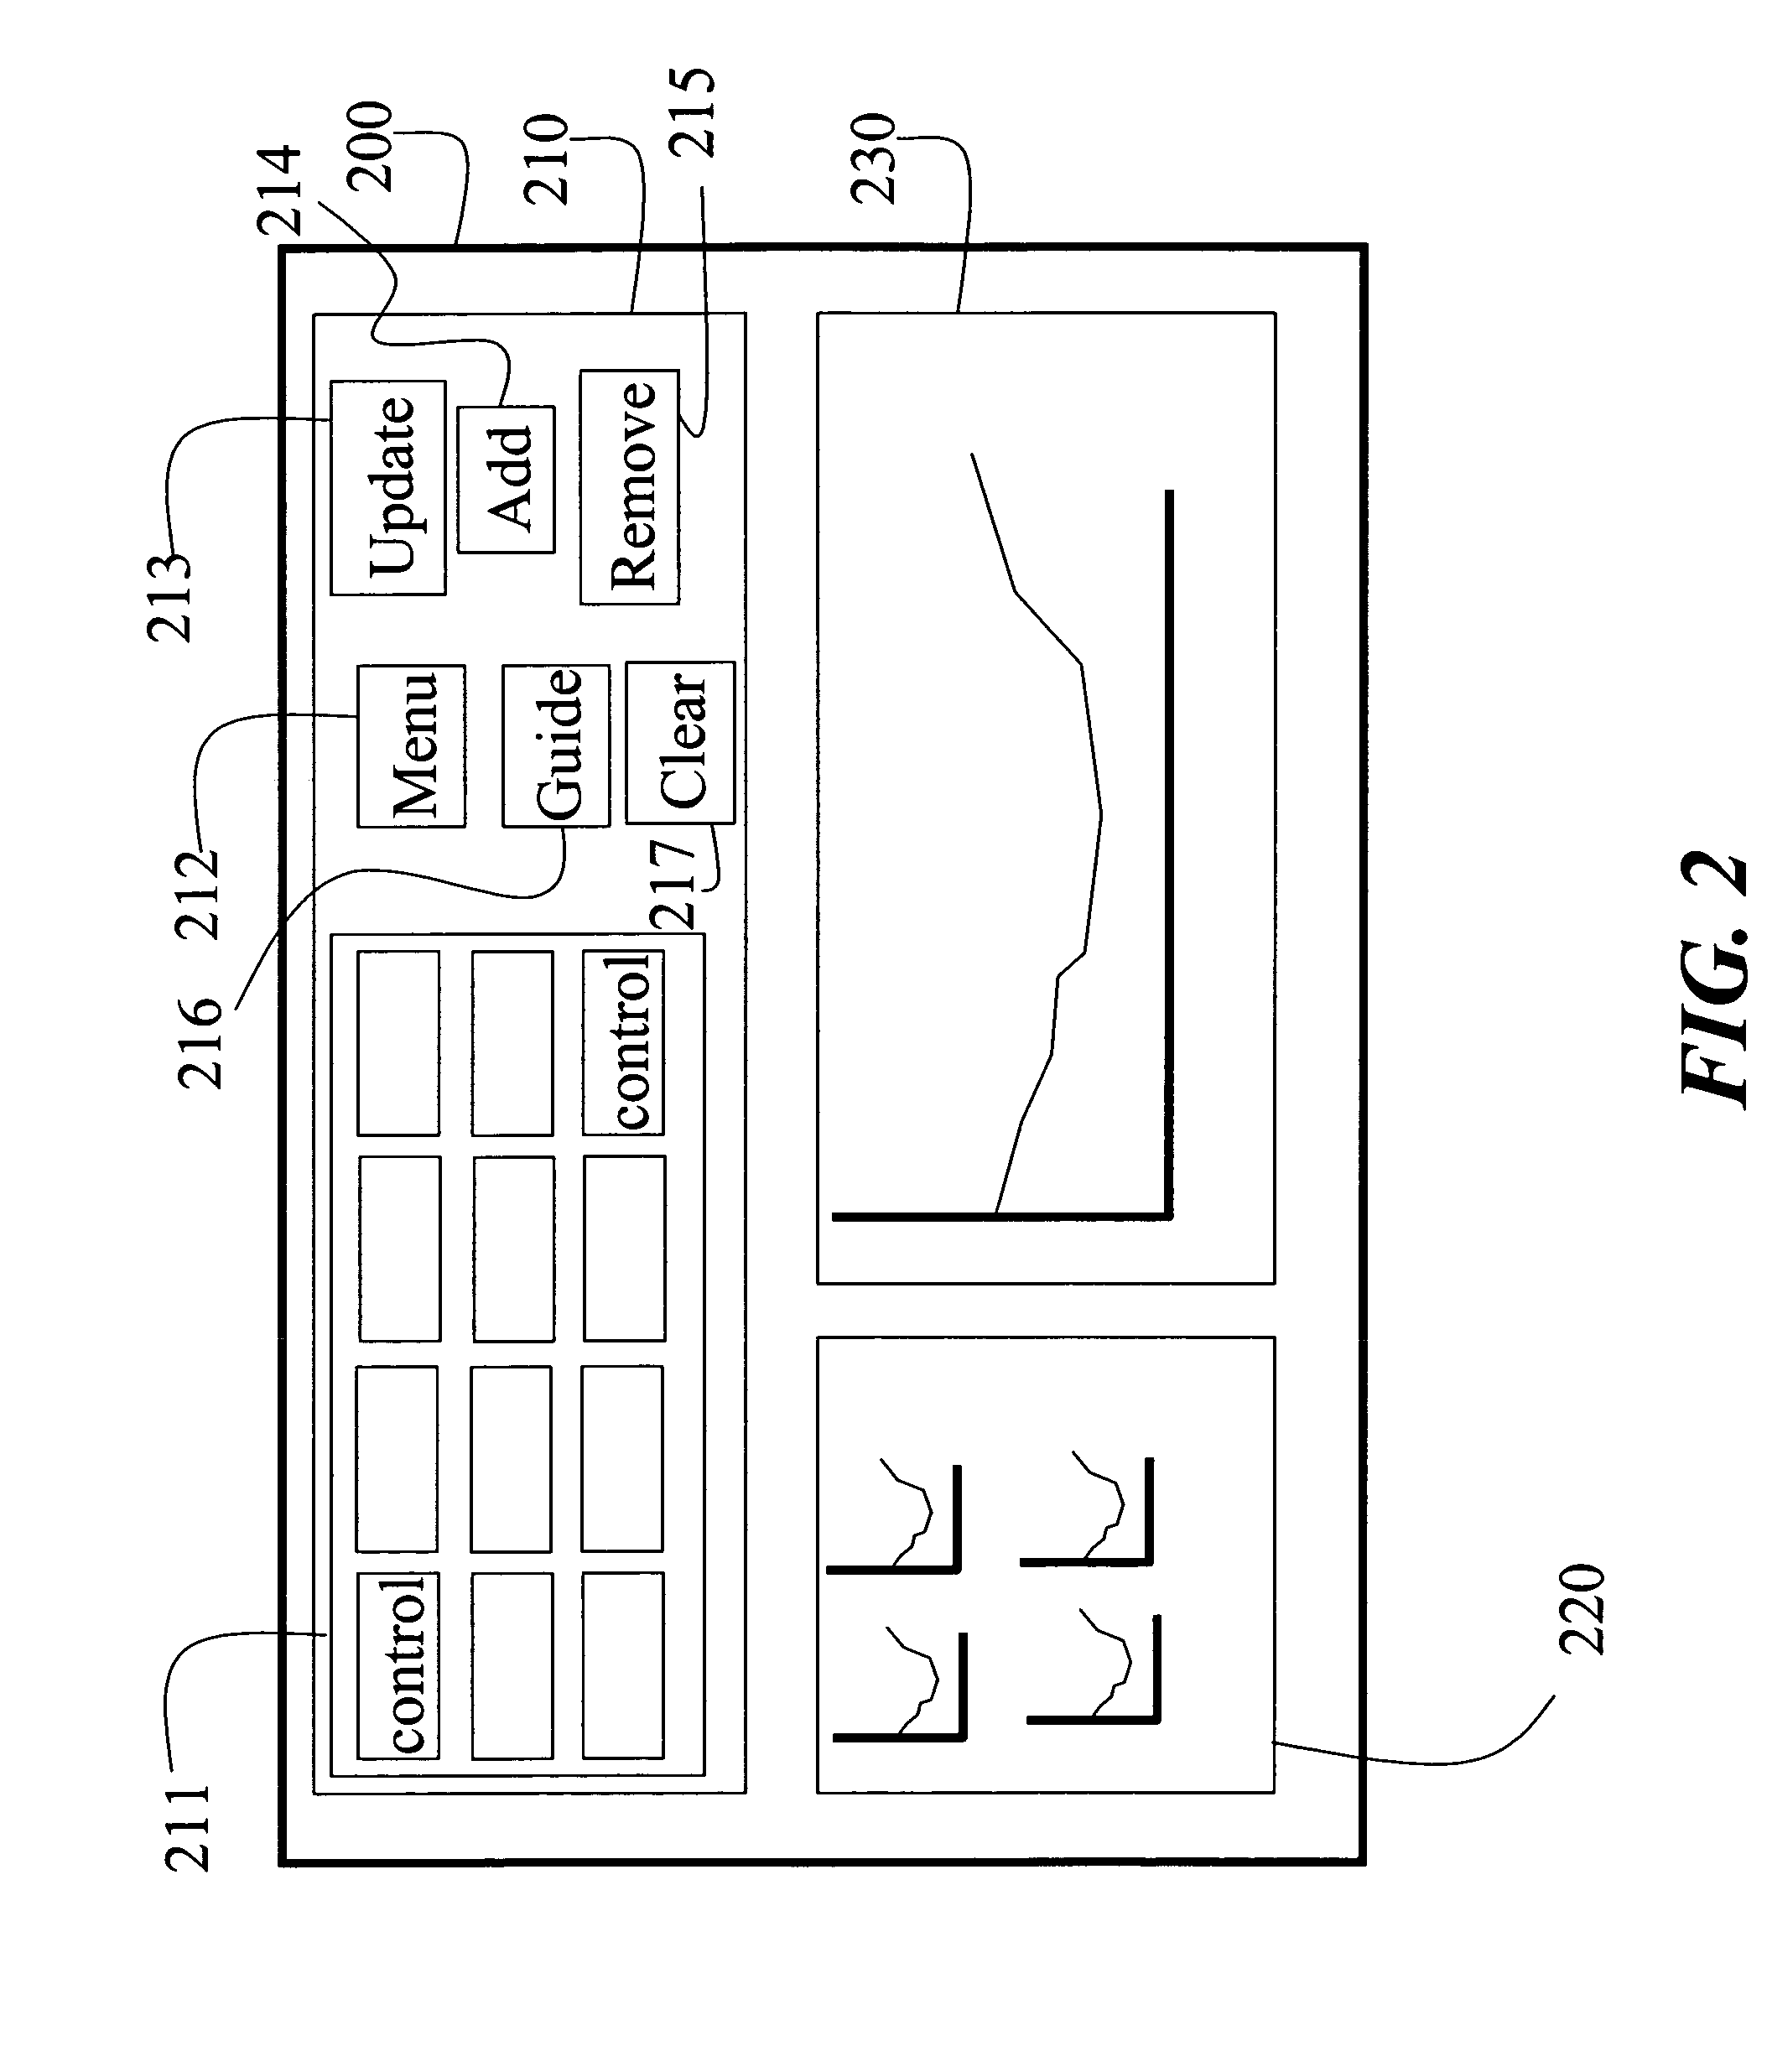
[0038] The database 302 is queried 310 with the query 301 to produce a current synopsis 303. The current synopsis is added 320 to a current summary 304. The current synopsis and the current controls and a current summary including the current synopsis are visualized 330 on a graphical user interface 200.

[0039] A new setting for the controls is indicated 340 to produce a new synopsis that when added to the current summary makes a next summary most different than the current summary.

[0040] The querying, visualizing, and indicating repeat until a termination condition 305 is reached to generate a most interesting summary of the database.

[0041] Terminology

[0042] First, we describe a terminology and a unifor...


PUM


Abstract

A query for a database is represented as a vector including multiple elements. Each element is a control, and each control has a current setting. The database is queried with the query to produce a current synopsis. The current synopsis is added to a current summary. The current synopsis and the current controls and a current summary including the current synopsis are visualized on a graphical user interface. A new setting for the controls is indicated to produce a new synopsis that when added to the current summary makes a next summary most different than the current summary. The querying, visualizing, and indicating until a termination condition is reached to generate a most interesting summary of the database.

Description

FIELD OF THE INVENTION [0001] This invention relates generally to data summarization, and more particularly to visualizing summaries of multi-dimensional databases. BACKGROUND OF THE INVENTION [0002] To illustrate the task of summarization, suppose a user is given access to a database storing membership records of an organization, and is asked to generate a presentation that answers the question “how old are our members?” A visualization might include a histogram showing the number of members in various age brackets. [0003] Then, the user might want to generate some interesting variations, based on previously generated graphs. For example, a graph can show that the women in the organization are, on the average, younger than the men, and that members who live in Northwest are, on the average, older than members who live elsewhere. [0004] In general, summarizing the age of the members of the organization would involve selecting a relatively small number of visualizations that effectiv...

Claims


Application Information

Patent Timeline
Patent Type & Authority Applications(United States)
IPC IPC(8): G06F17/30G06F7/00
CPCG06F17/30719G06F17/30011G06F16/345G06F16/93
Inventor LESH, NEAL B.MITZENMACHER, MICHAEL D.
Owner MITSUBISHI ELECTRIC INFORMATION TECH CENT AMERICA ITA
Why Eureka
Try Eureka