System and method for monitoring disease progression or response to therapy using multi-modal visualization

a multi-modal visualization and disease technology, applied in image enhancement, instruments, applications, etc., can solve the problems of limiting their usefulness, radiologists often have difficulty in locating and accurately identifying cancer tissue, and typically do not support more than a few combinations of datasets from different modalities

Active Publication Date: 2006-02-09
SIEMENS HEALTHCARE GMBH
View PDF13 Cites 100 Cited by
  • Summary
  • Abstract
  • Description
  • Claims
  • Application Information

AI Technical Summary

Benefits of technology

The patent describes an improved user interface that allows medical professionals to view two sets of images taken at different times. One set of images can be compared with the other to help identify any differences or abnormalities between them. This interface also includes a control area which has various tools and options for managing patients and conducting diagnostic tests. Overall, this technology helps healthcare providers analyze and interpret multiple types of imaging data more efficiently and effectively.

Problems solved by technology

The technical problem addressed in this patent is how to effectively use combined data from different medical imaging methods, including both functional and structural images, to improve the diagnosis and treatment of medical disorders. Current limitations include difficulties in registering and comparing these images, which can result in less reliable and accurate diagnoses. There is a need for a solution that allows healthcare professionals to easily and efficiently compare patient scans taken at different times using the same or different modalities.

Method used


Image

  • System and method for monitoring disease progression or response to therapy using multi-modal visualization
  • System and method for monitoring disease progression or response to therapy using multi-modal visualization
  • System and method for monitoring disease progression or response to therapy using multi-modal visualization

Examples


Embodiment Construction

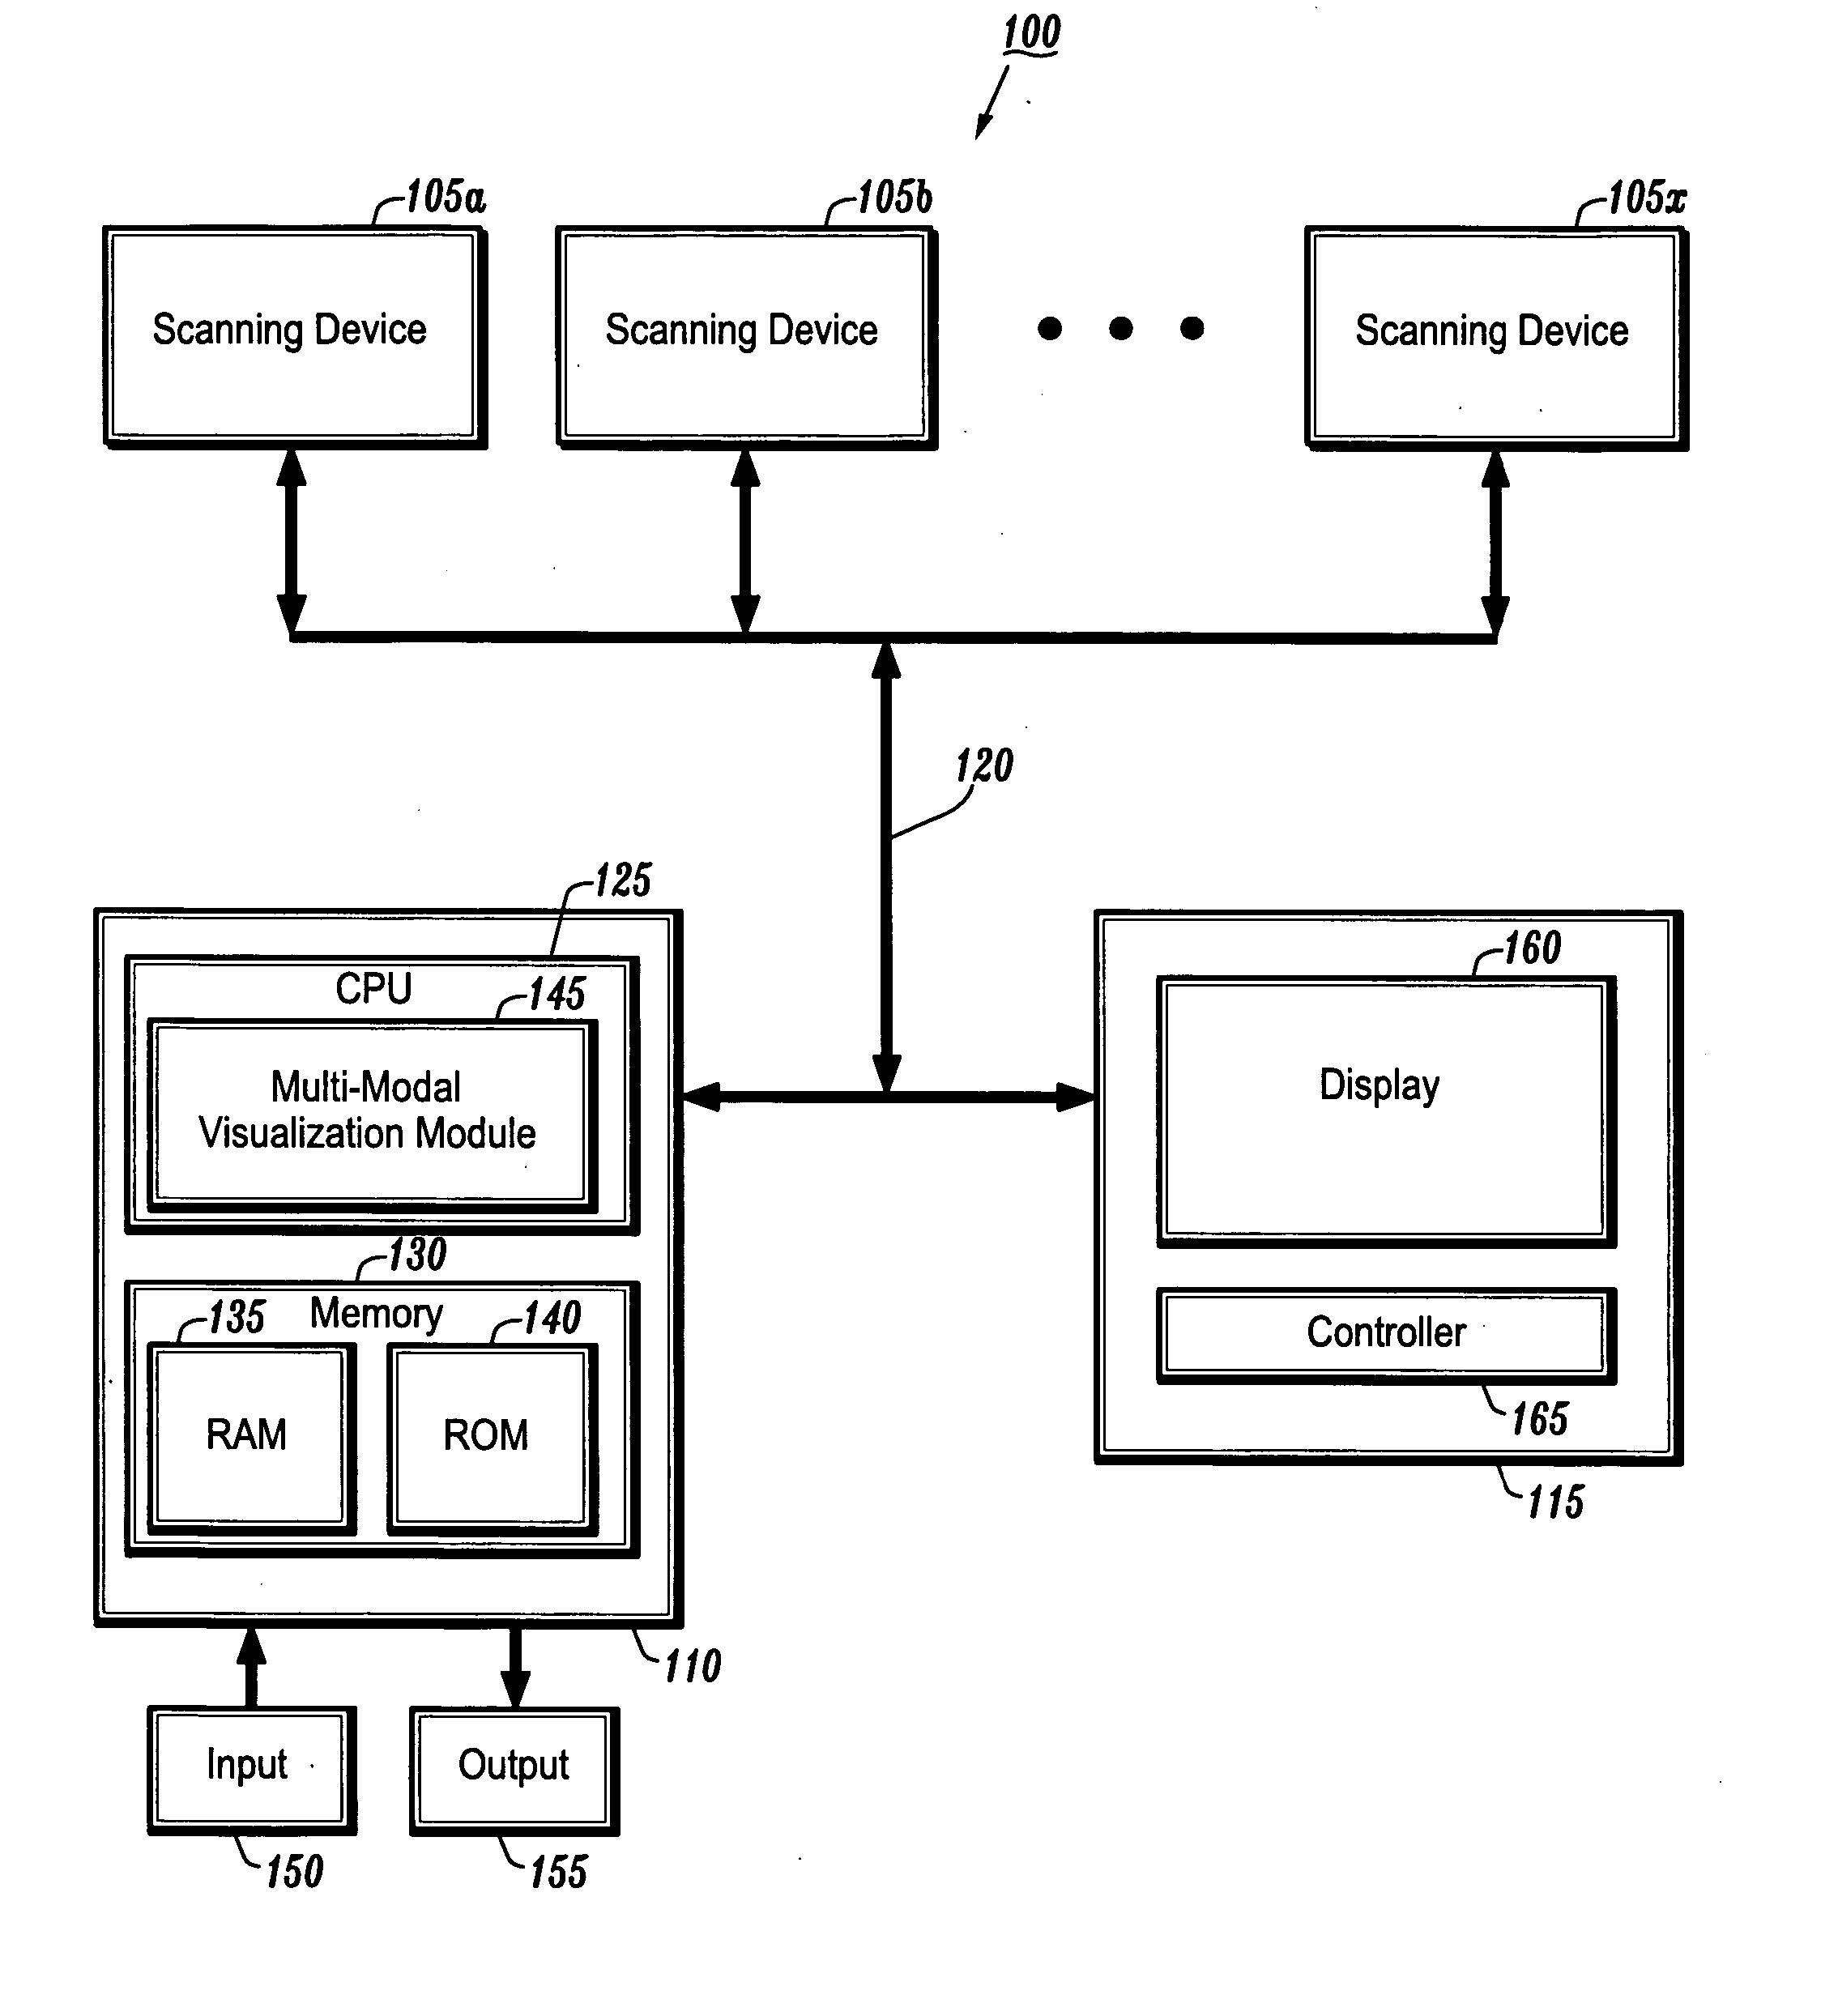
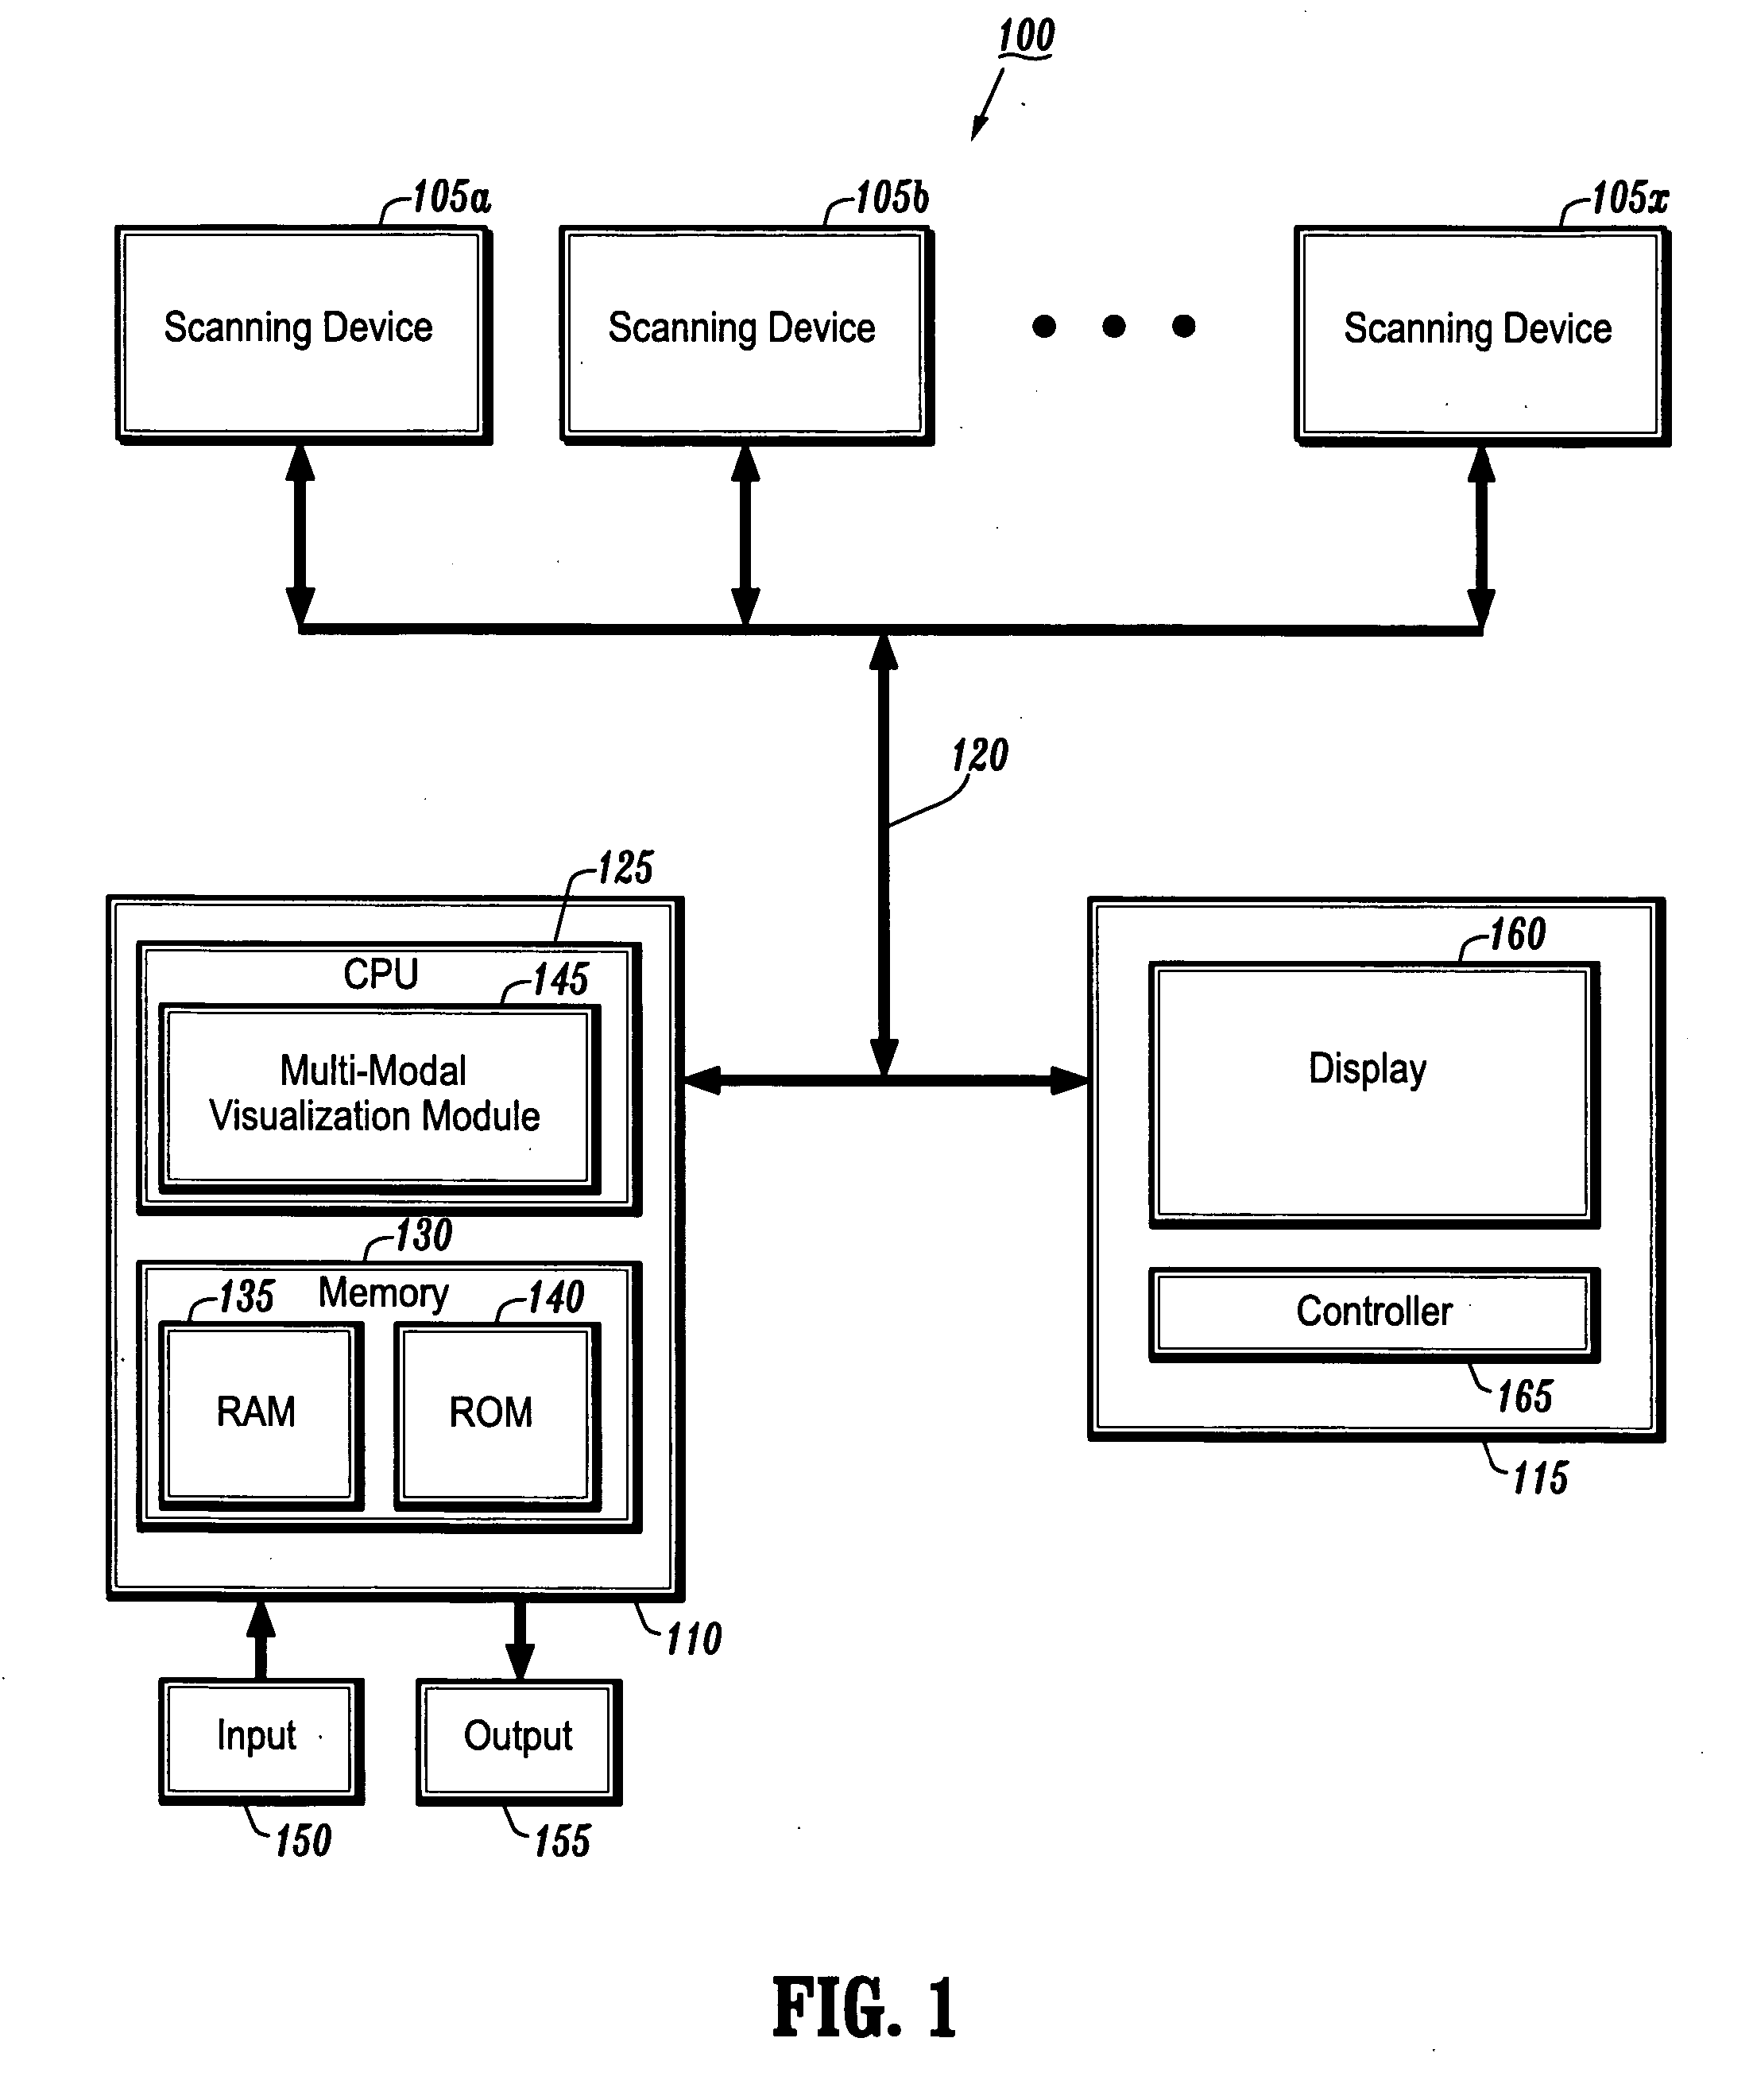
[0048] Exemplary embodiments of the present invention are directed to a multi-modality application that allows the comparison of two or more studies to each other. This is typically done by comparing an initial diagnosis with a follow-up scan after treatment. For example, the present invention may be used in oncology cases where one or several follow-up studies are performed to evaluate disease progression and response to therapy. The present invention may also be applied in medical modalities where change detection can be used to detect lesions, tumors, cancers, etc.

[0049] For example, the present invention may be used in the following areas of medical imaging: therapy response monitoring by performing change detection using computed tomography (CT) or Magnetic Resonance (MR) images—positron emission tomography (PET) or CT—single photon emission computed tomography (SPECT) over time; bone cancer detection by performing bone segmentation and lesion detection; liver cancer detection...


PUM


Abstract

A system and method for monitoring disease progression or response to therapy using multi-modal visualization are provided. The method comprises: selecting a first image dataset of a first timepoint; loading the first image dataset of the first timepoint; selecting a second image dataset of a second timepoint; loading the second image dataset of the second timepoint; registering the first image dataset of the first timepoint and the second image dataset of the second timepoint; and displaying the first image dataset of the first timepoint and the second image dataset of the second timepoint.

Description


Claims


Application Information

Patent Timeline
Owner SIEMENS HEALTHCARE GMBH
Why Eureka
Try Eureka