Spectral kernels for learning machines

a learning machine and kernel technology, applied in the field of learning machines, can solve the problems of low computational cost of products and implicit complexity of features being used, and achieve the effect of minimizing the cost of a clustering cut and being easy to spo

Inactive Publication Date: 2006-04-06
HEALTH DISCOVERY CORP +1
View PDF15 Cites 71 Cited by
  • Summary
  • Abstract
  • Description
  • Claims
  • Application Information

AI Technical Summary

Benefits of technology

[0020] In applying SGT methods to kernel methods, the dataset is regarded as nodes of a fully connected graph. A weight equal to the kernel between the two nodes is assigned to each edge of the graph. The adjacency matrix of the graph is equivalent to the Gram matrix. The eigenvectors and their corresponding eigenvalues provide information about the properties of the graph. The second eigenvector can be thresholded to approximate the class assignment of graph nodes, minimizing the cost of a cut of a clustering. The first eigenvector of the adjacency matrix provides distribution of an ergodic random walk, using such matrix as the transition matrix. The relations between first and second eigenvalues also give information about the connectivity of the graph. Looking at the random walk on the graph associated with the Gram matrix, the stationary distribution will provide information about the “popularity” of a point based on how many other points are similar to it. This allows anomalous points to be easily spotted.

Problems solved by technology

The inner product can often be computed at low computational cost, however, the features being used are implicitly very complex.

Method used


Image

  • Spectral kernels for learning machines
  • Spectral kernels for learning machines
  • Spectral kernels for learning machines

Examples


example 1

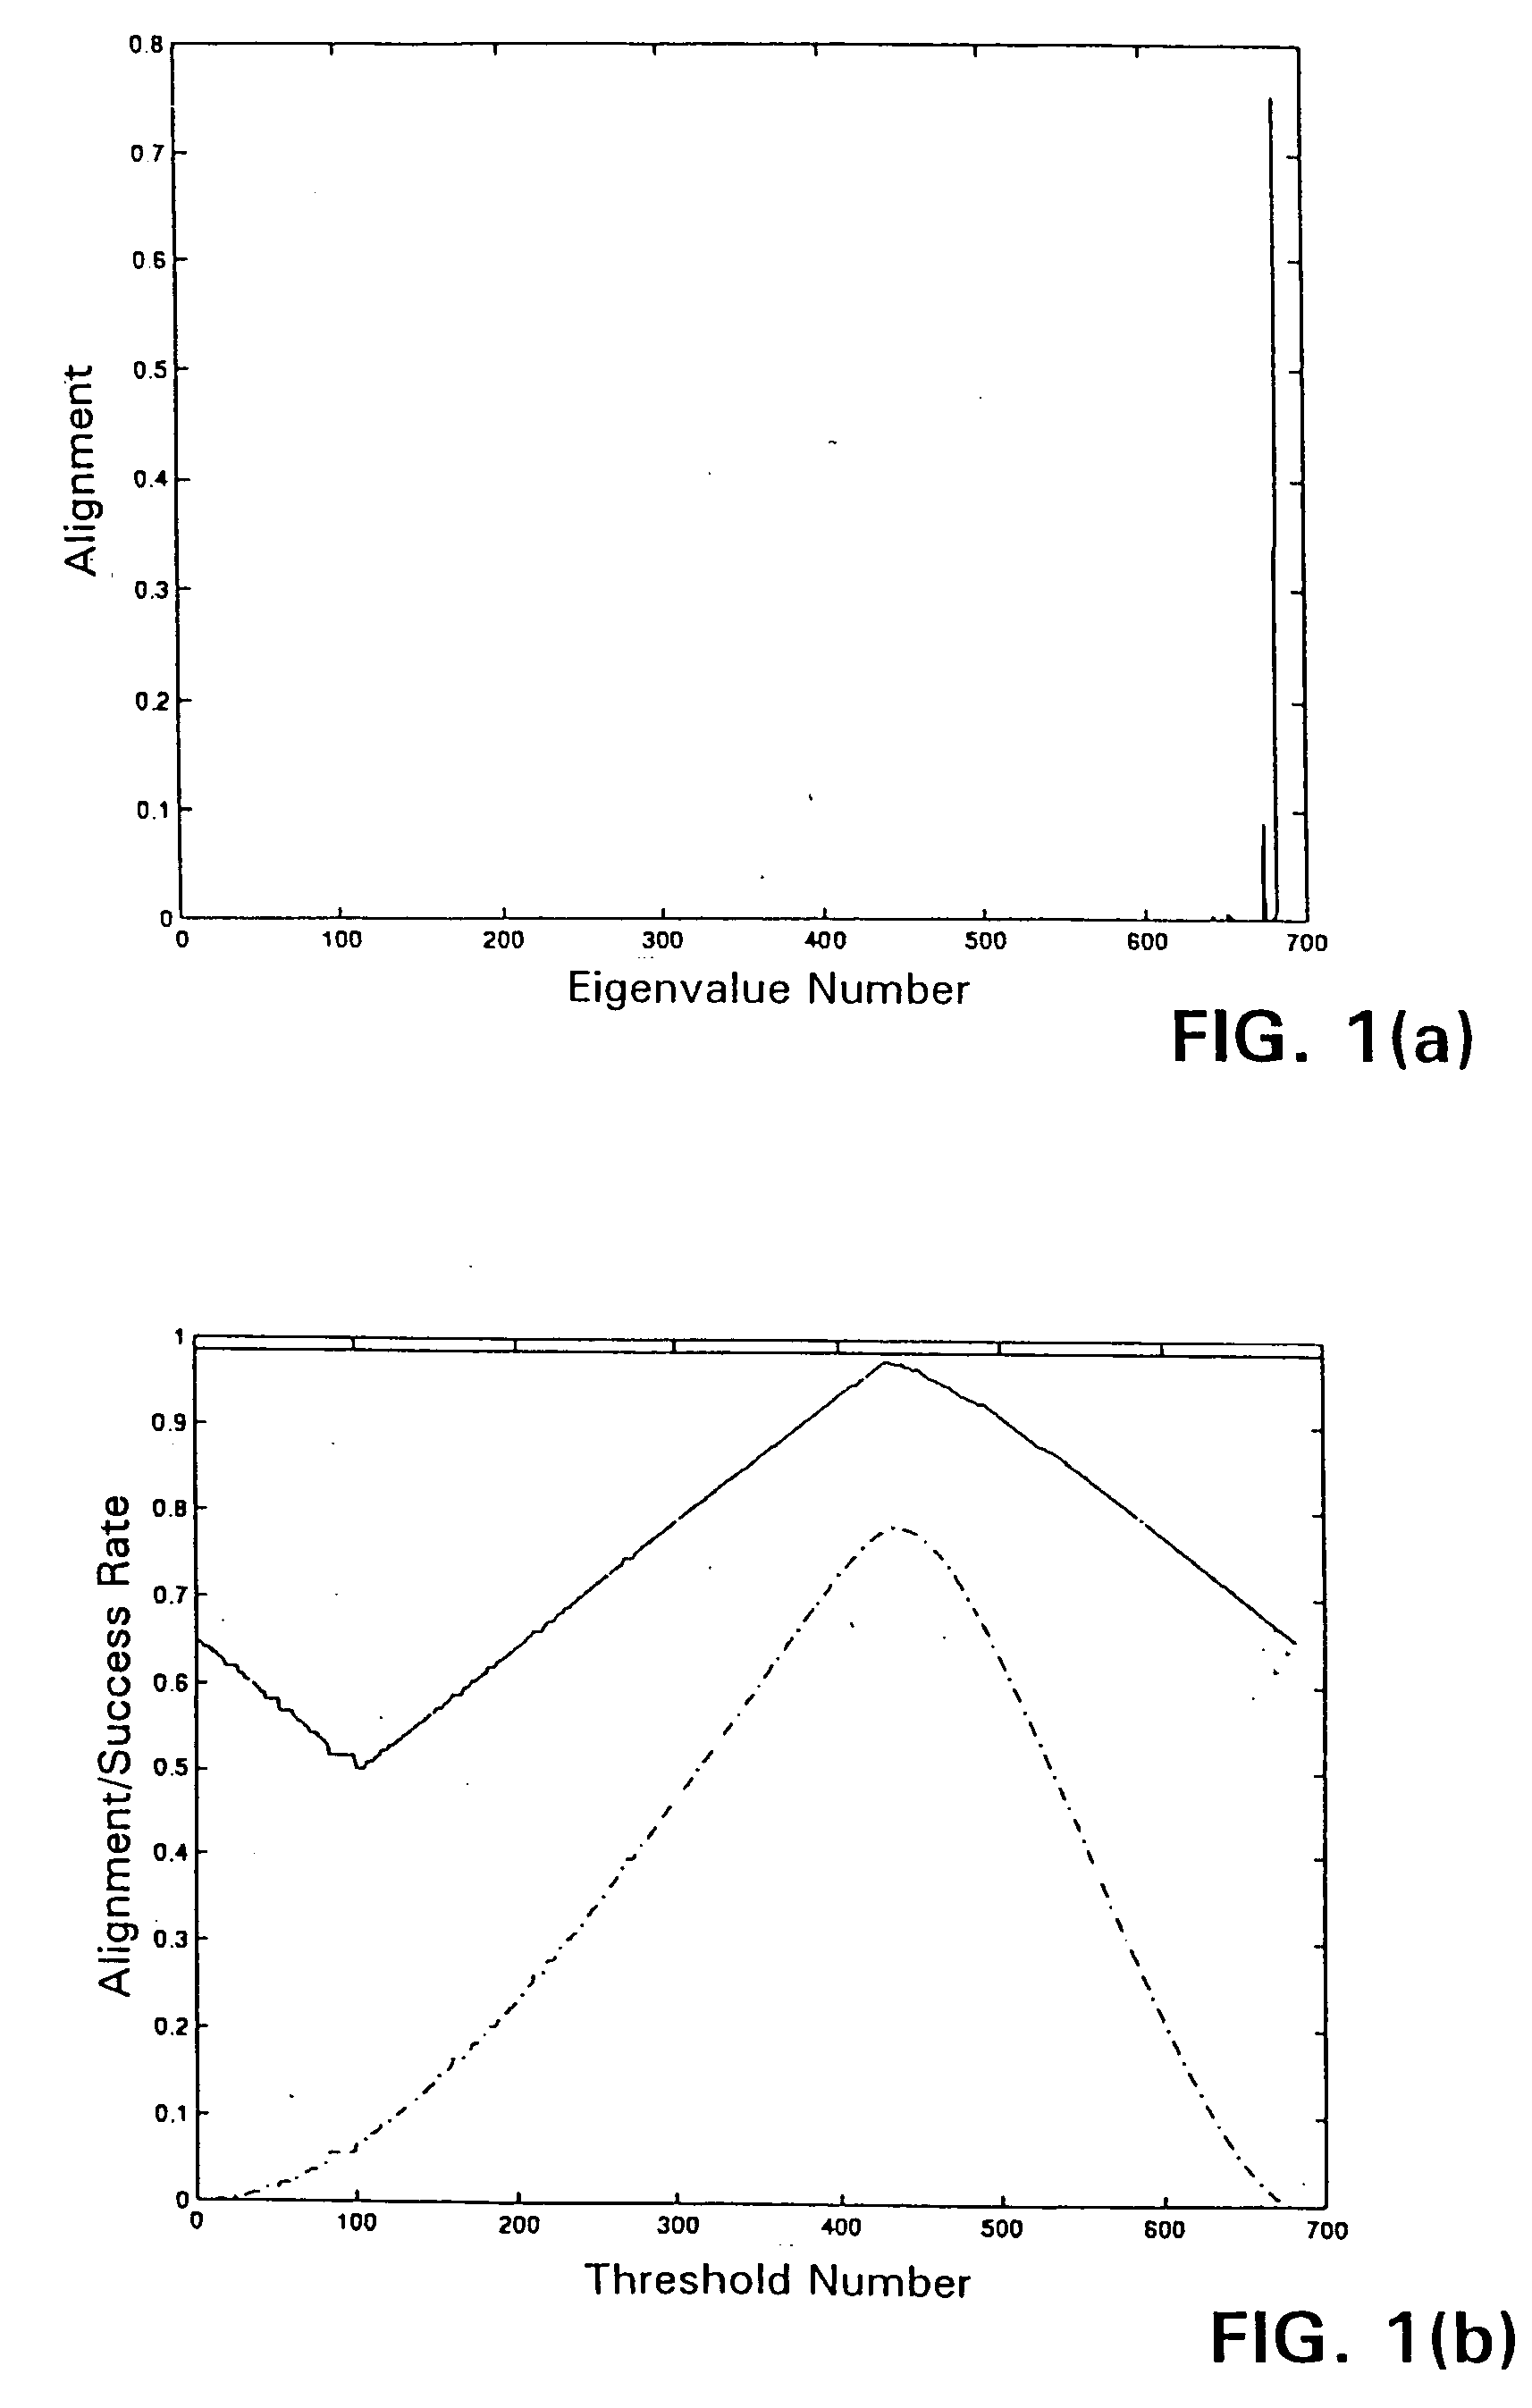
[0089] Using the breast cancer dataset, the unsupervised technique was applied with a linear kernel, with alignment being optimized. FIG. 1(a) is a plot of the alignment of the different eigenvectors with the labels in order of increasing eigenvalue. The highest alignment is shown by the last eigenvector corresponding to the largest eigenvalue. For each value θi of the threshold, FIG. 1(b) shows the upper bound of λmax / ∥K∥F (the straight line at the top), the alignment Â(S,k,y) for y=sign(vmax−θi) (the bottom curve), and the accuracy of y (the middle curve). Where actual alignment and upper bound on alignment are the closest, there is confidence that the data has been partitioned well, and that accuracy is maximized. The choice of the threshold corresponds to maintaining the correct proportion between positives and negatives. Another possible threshold strategy is based on the availability of enough labeled points to provide a good estimate of the proportion of positive points in th...

example 2

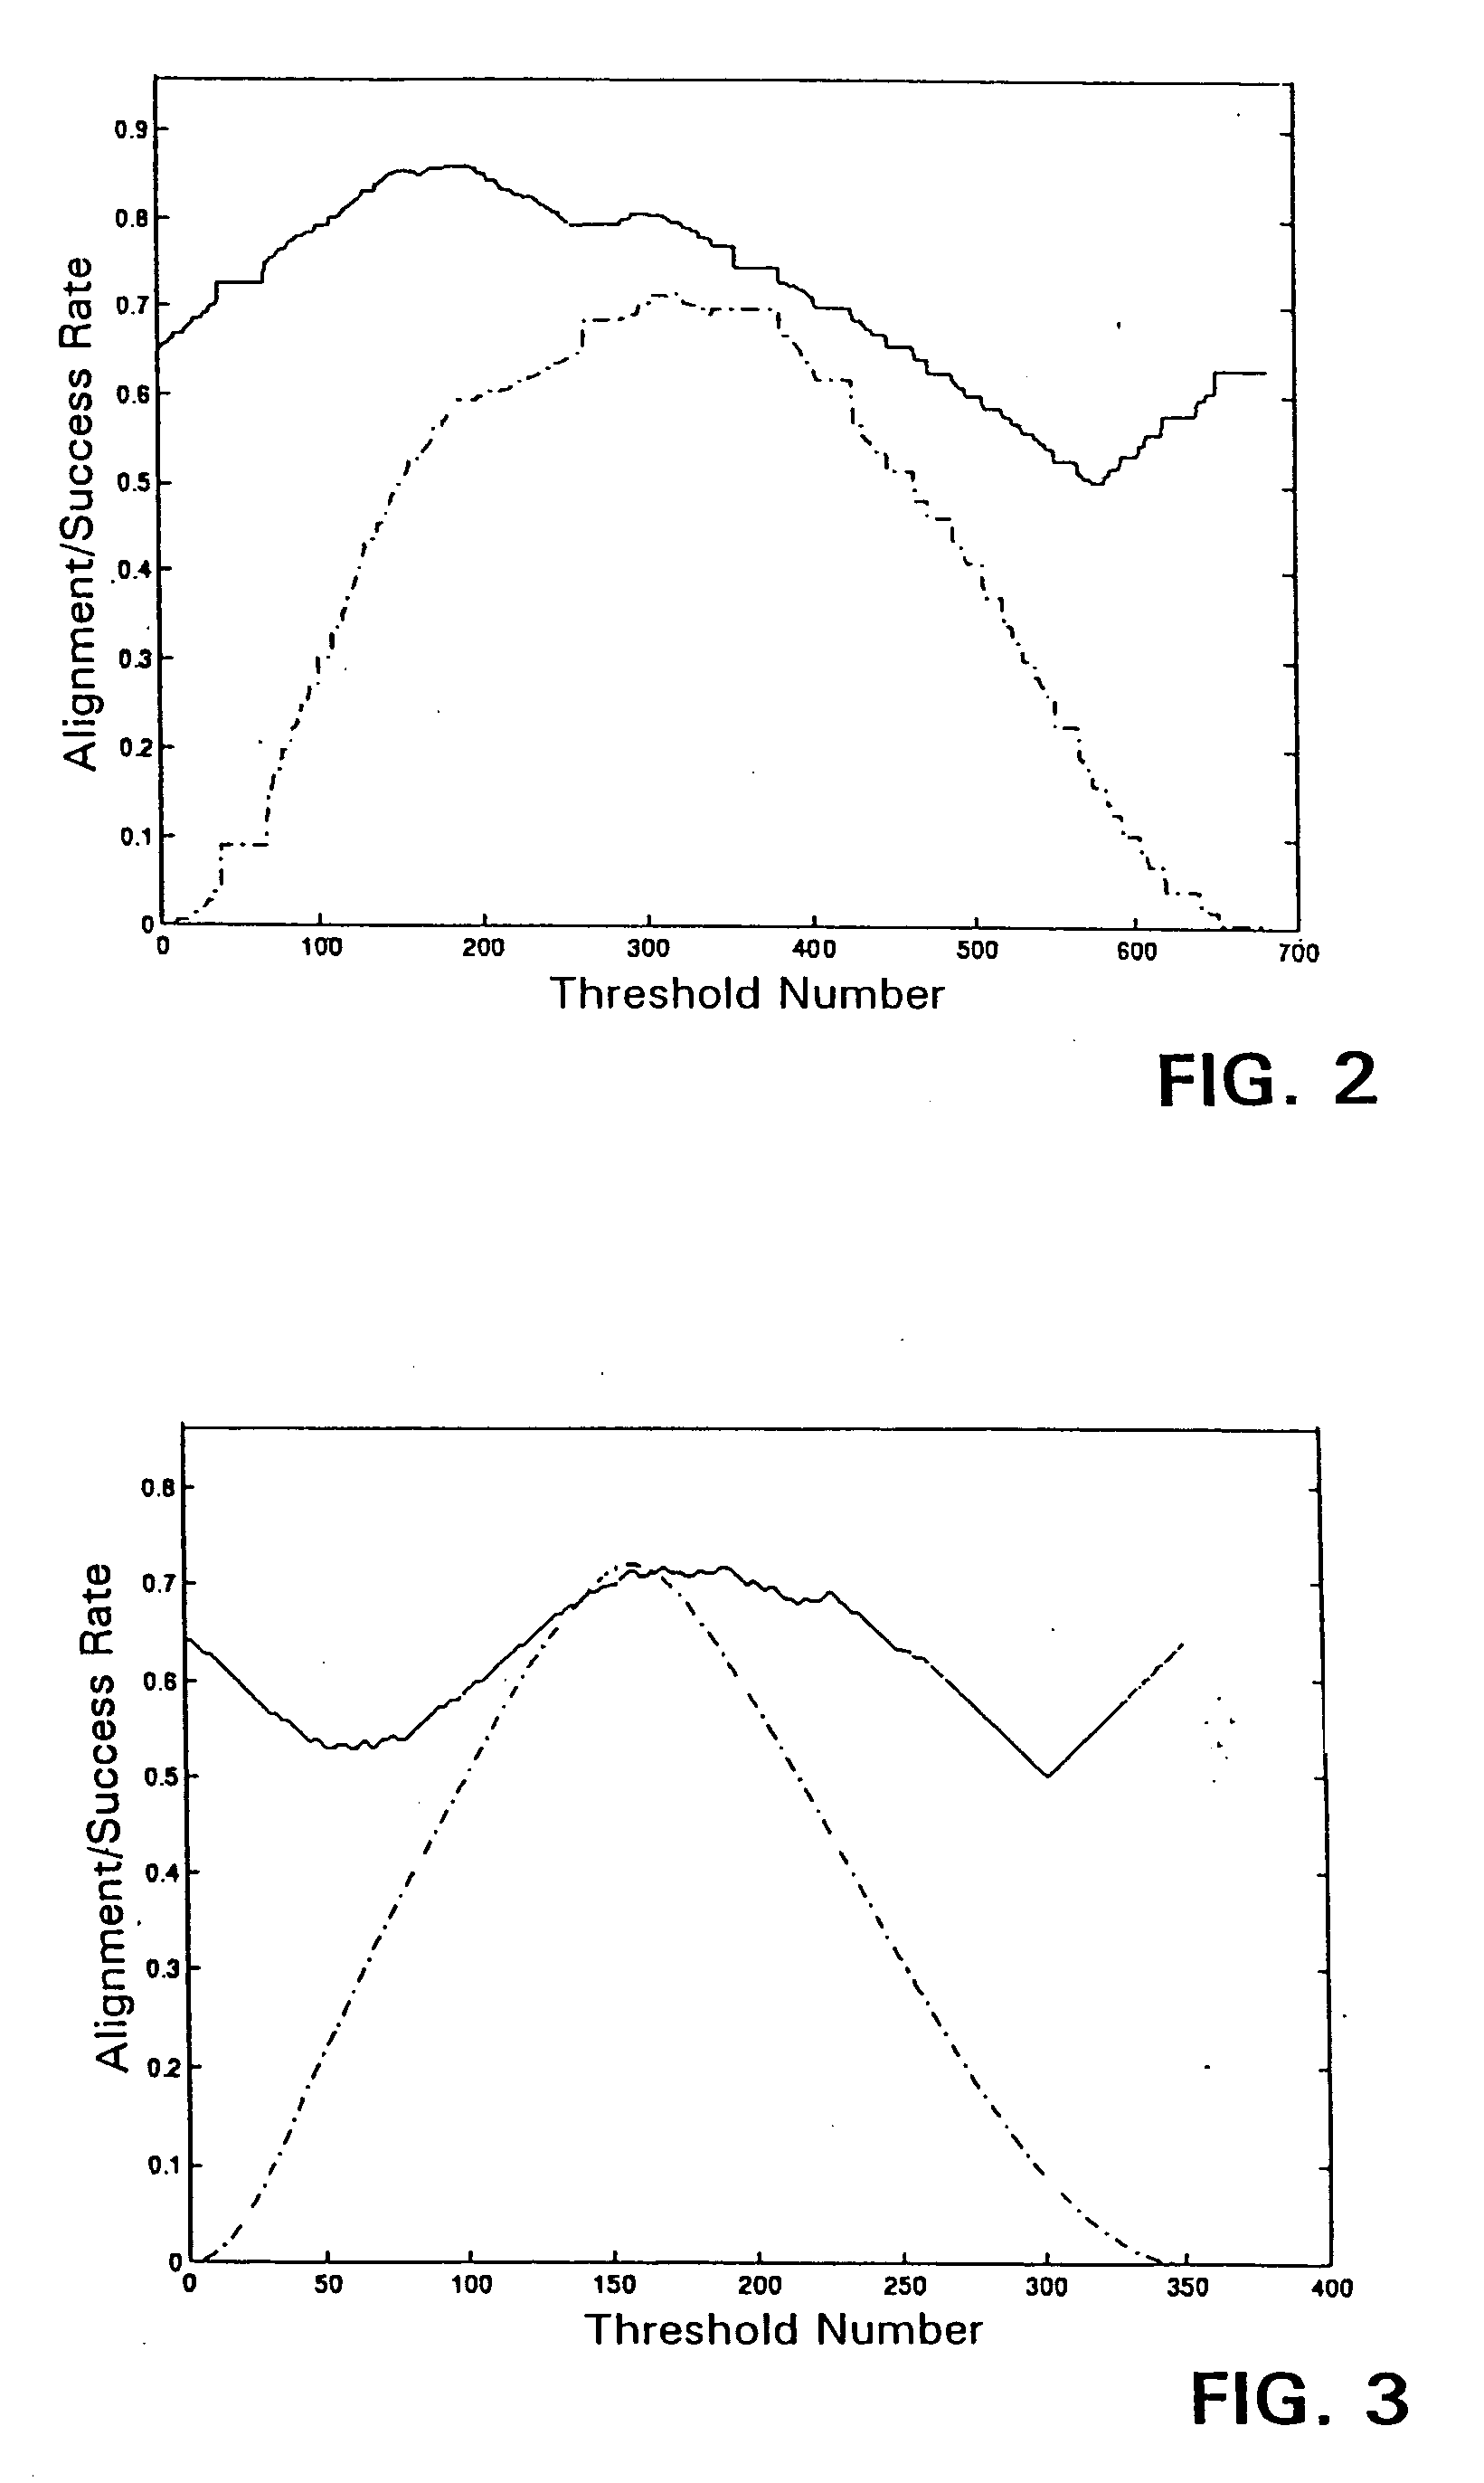
[0090] Using the same breast cancer dataset as in Example 1, a Gaussian kernel (σ=6) was used. As above, alignment was optimized. In this case, the accuracy obtained by optimizing the alignment was less impressive. For the breast cancer dataset (threshold number 316), the accuracy was about 79.65%, as shown in FIG. 2, where the straight line at the top shows the upper bound of πmax / ∥K∥F, alignment Â(S,k,y) for y=sign(vmax−θi) is shown in the bottom (dashed) curve, and the accuracy of y is plotted in the middle curve.

example 3

[0091] For the ionosphere dataset using a linear kernel and optimized alignment, the accuracy split that optimizes the alignment (threshold number 158) is approximately 71.37%. For each value θi of the threshold, FIG. 3 shows the upper bound of λmax / ∥K∥F (the straight line at the top), the alignment Â(S,k,y) for y=sign(vmax−θi) (the bottom (dashed) curve), and the accuracy of y (the middle curve).

[0092] An overall approach can be used to adapt the kernel to the data. For example, the kernel parameters can be chosen so as to optimize λmax / ∥K∥F. Then, find the first eigenvector, choose a threshold to maximize the alignment, and output the corresponding y. The cost to the alignment of changing a label yi is 2⁢ ⁢∑j⁢yj⁢k⁡(xi,xj)KF,

so that if a point is isolated from the others, or if it is equally close to the two different classes, then changing its label will have only a small effect. On the other hand, labels in strongly clustered points clearly contribute to the overall cost such ...


PUM


Abstract

The spectral kernel machine combines kernel functions and spectral graph theory for solving problems of machine learning. The data points in the dataset are placed in the form of a matrix known as a kernel matrix, or Gram matrix, containing all pairwise kernels between the data points. The dataset is regarded as nodes of a fully connected graph. A weight equal to the kernel between the two nodes is assigned to each edge of the graph. The adjacency matrix of the graph is equivalent to the kernel matrix, also known as the Gram matrix. The eigenvectors and their corresponding eigenvalues provide information about the properties of the graph, and thus, the dataset. The second eigenvector can be thresholded to approximate the class assignment of graph nodes. Eigenvectors of the kernel matrix may be used to assign unlabeled data to clusters, merge information from labeled and unlabeled data by transduction, provide model selection information for other kernels, detect novelties or anomalies and / or clean data, and perform supervised learning tasks such as classification.

Description

RELATED APPLICATIONS [0001] This application is a continuation of application Ser. No. 10 / 087,145, filed Mar. 1, 2002, issued Sep. 13, 2005 as U.S. Pat. No. 6,944,602, which claims the benefit of priority of U.S. provisional application Ser. No. 60 / 272,391, filed Mar. 1, 2001, which is incorporated herein by reference.FIELD OF THE INVENTION [0002] The present invention relates generally to learning machines and more particularly to kernel-based machines for data analysis. BACKGROUND OF THE INVENTION [0003] In recent years, machine-learning approaches for data analysis have been widely explored for recognizing patterns which, in turn, allow extraction of significant features within a large amount of data that often contains irrelevant detail. Learning machines comprise algorithms that may be trained to generalize. Trained learning machine algorithms may then be applied to predict the outcome in cases of unknown outcome. Machine-learning approaches, which include neural networks, hidd...

Claims


Application Information

Patent Timeline
Patent Type & Authority Applications(United States)
IPC IPC(8): G06N5/00G06F17/00G06F15/18G06K9/62G06N20/10
CPCG06K9/6215G06K9/6224G06N99/005G06N20/00G06N20/10G06F18/2323G06F18/22
Inventor CRISTIANINI, NELLO
Owner HEALTH DISCOVERY CORP
Why Eureka
Try Eureka