Mapping-data analyzing method and apparatus

a mapping and data technology, applied in the field of mappingdata analysis methods, programs, and apparatuses, can solve problems such as difficulty in assigning peaks

Active Publication Date: 2006-04-27
JASCO CORP
View PDF5 Cites 12 Cited by
  • Summary
  • Abstract
  • Description
  • Claims
  • Application Information

AI Technical Summary

Benefits of technology

[0008] It is an object of the present invention to provide a mapping-data analyzing method, program, and apparatus that can dis

Problems solved by technology

However, the peak of interest may overlap with another peak, which makes it difficult to

Method used


Image

  • Mapping-data analyzing method and apparatus
  • Mapping-data analyzing method and apparatus
  • Mapping-data analyzing method and apparatus

Examples


first embodiment

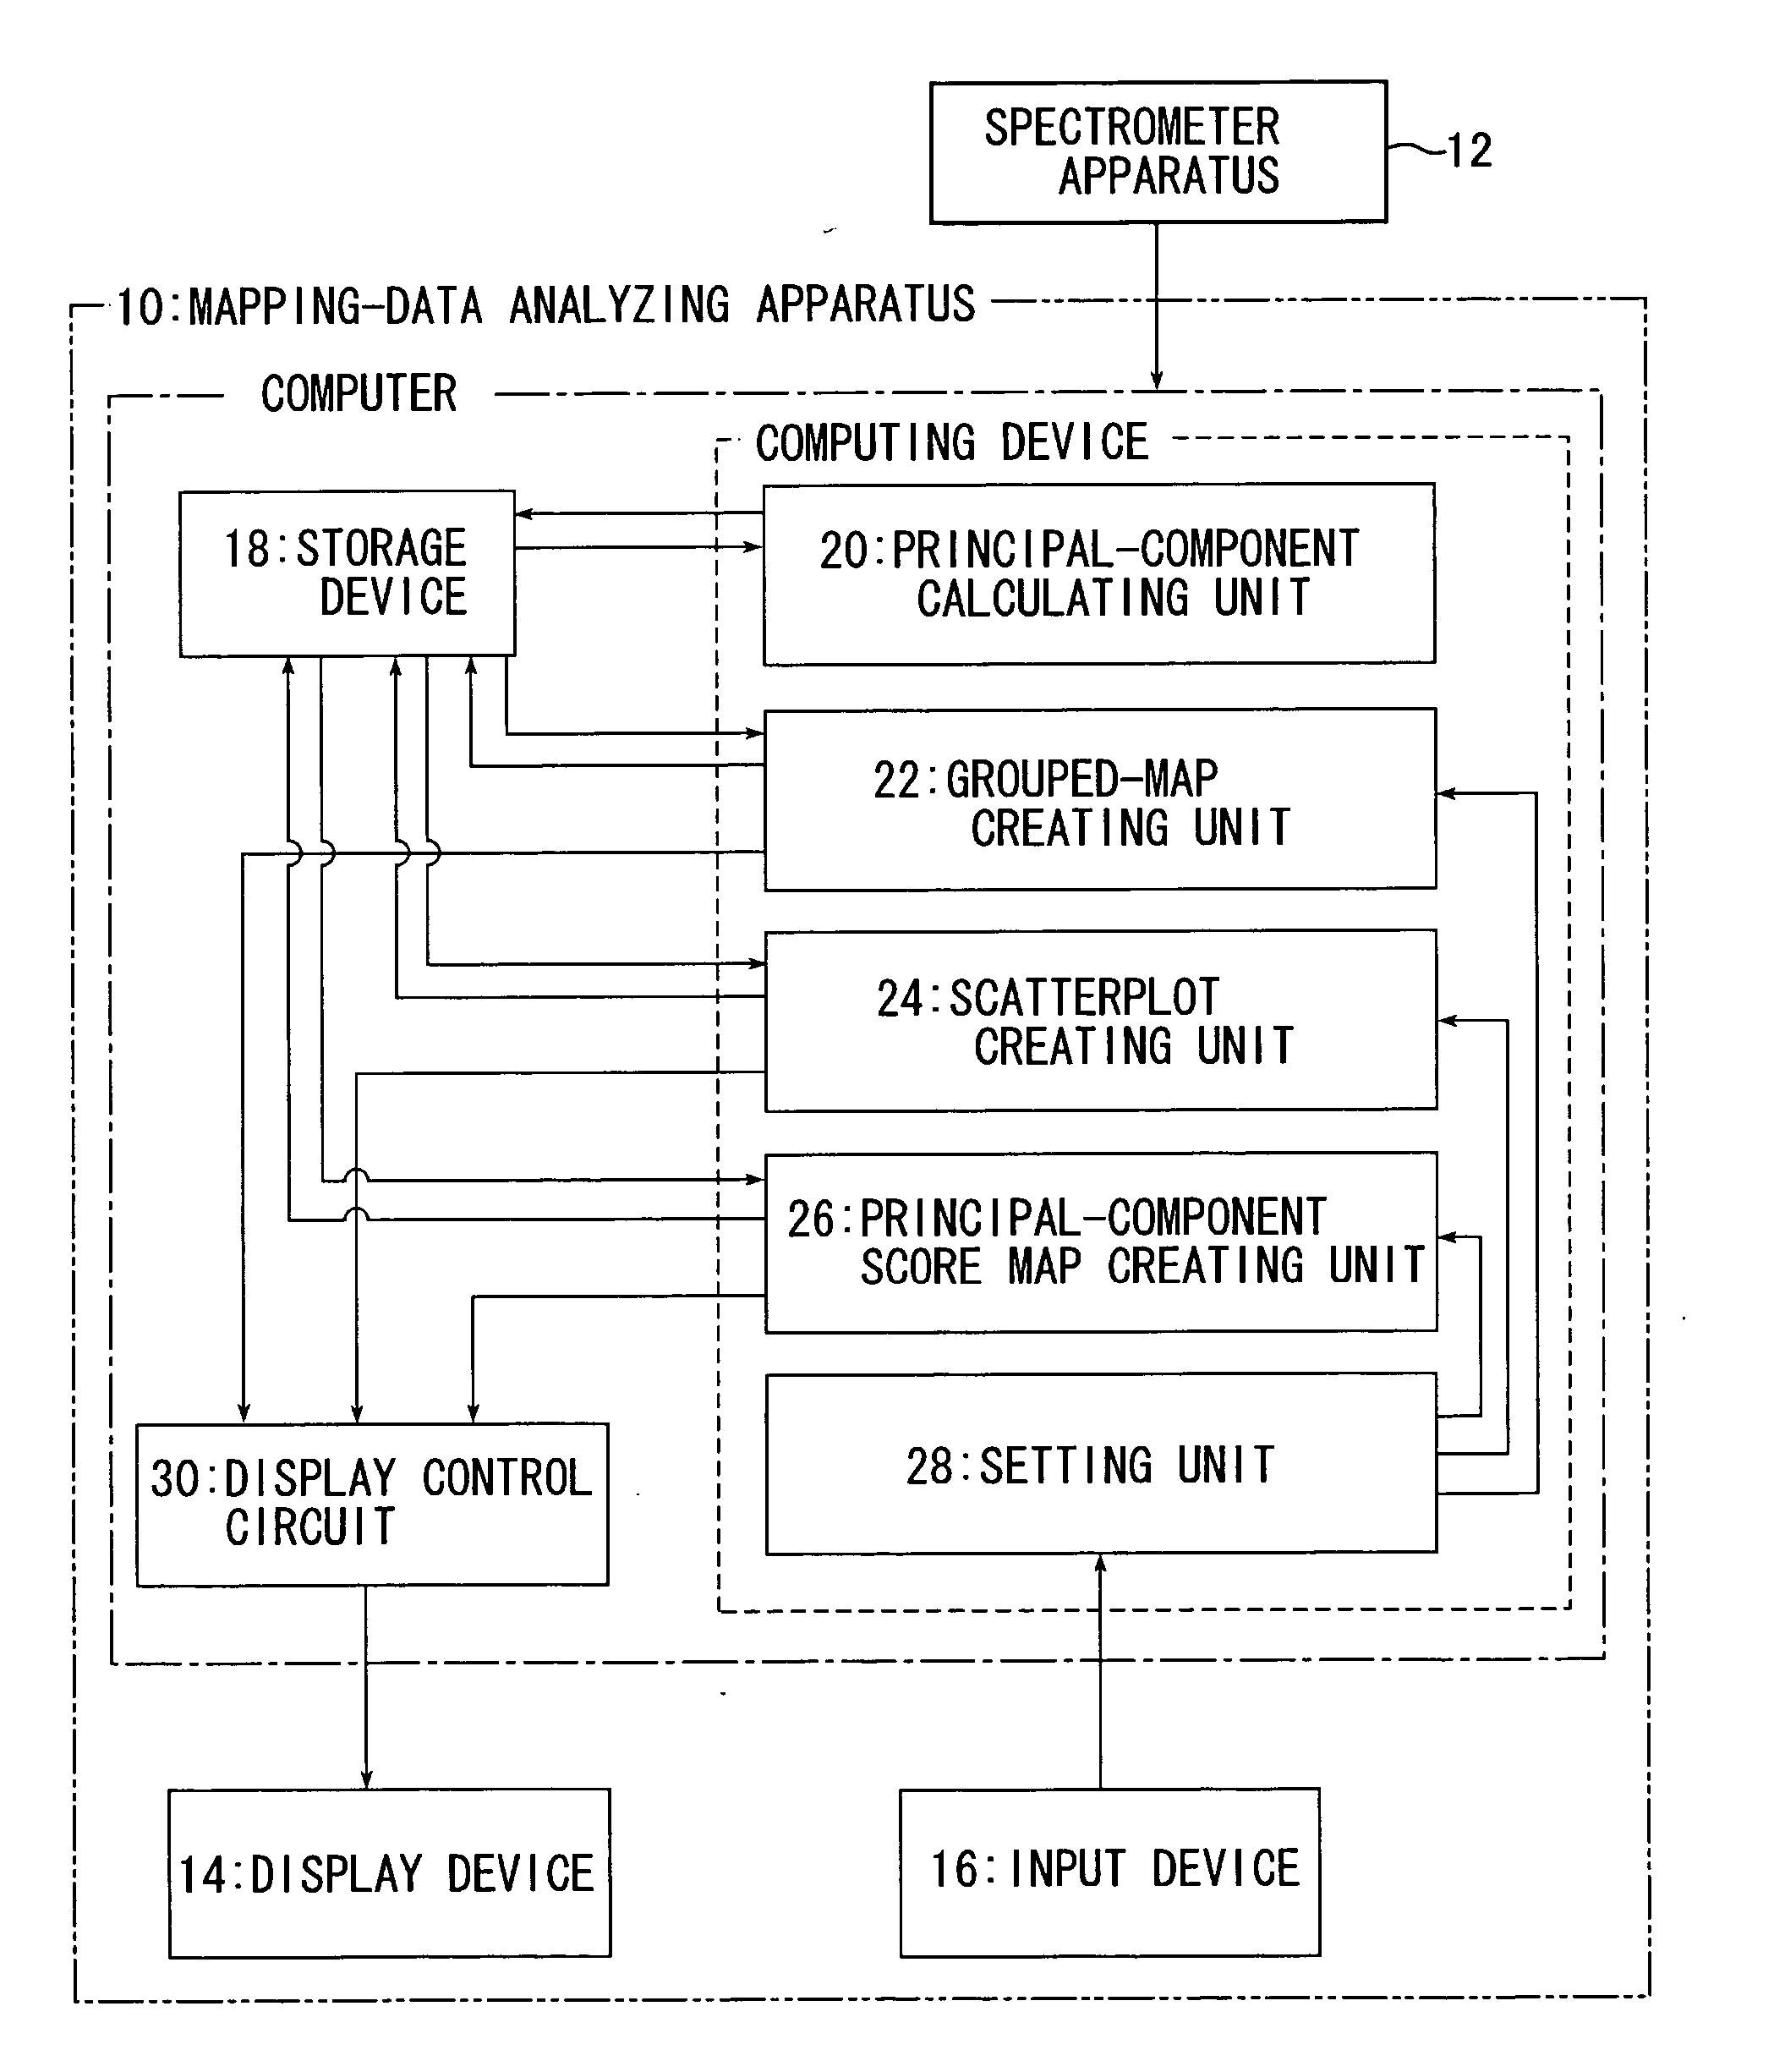
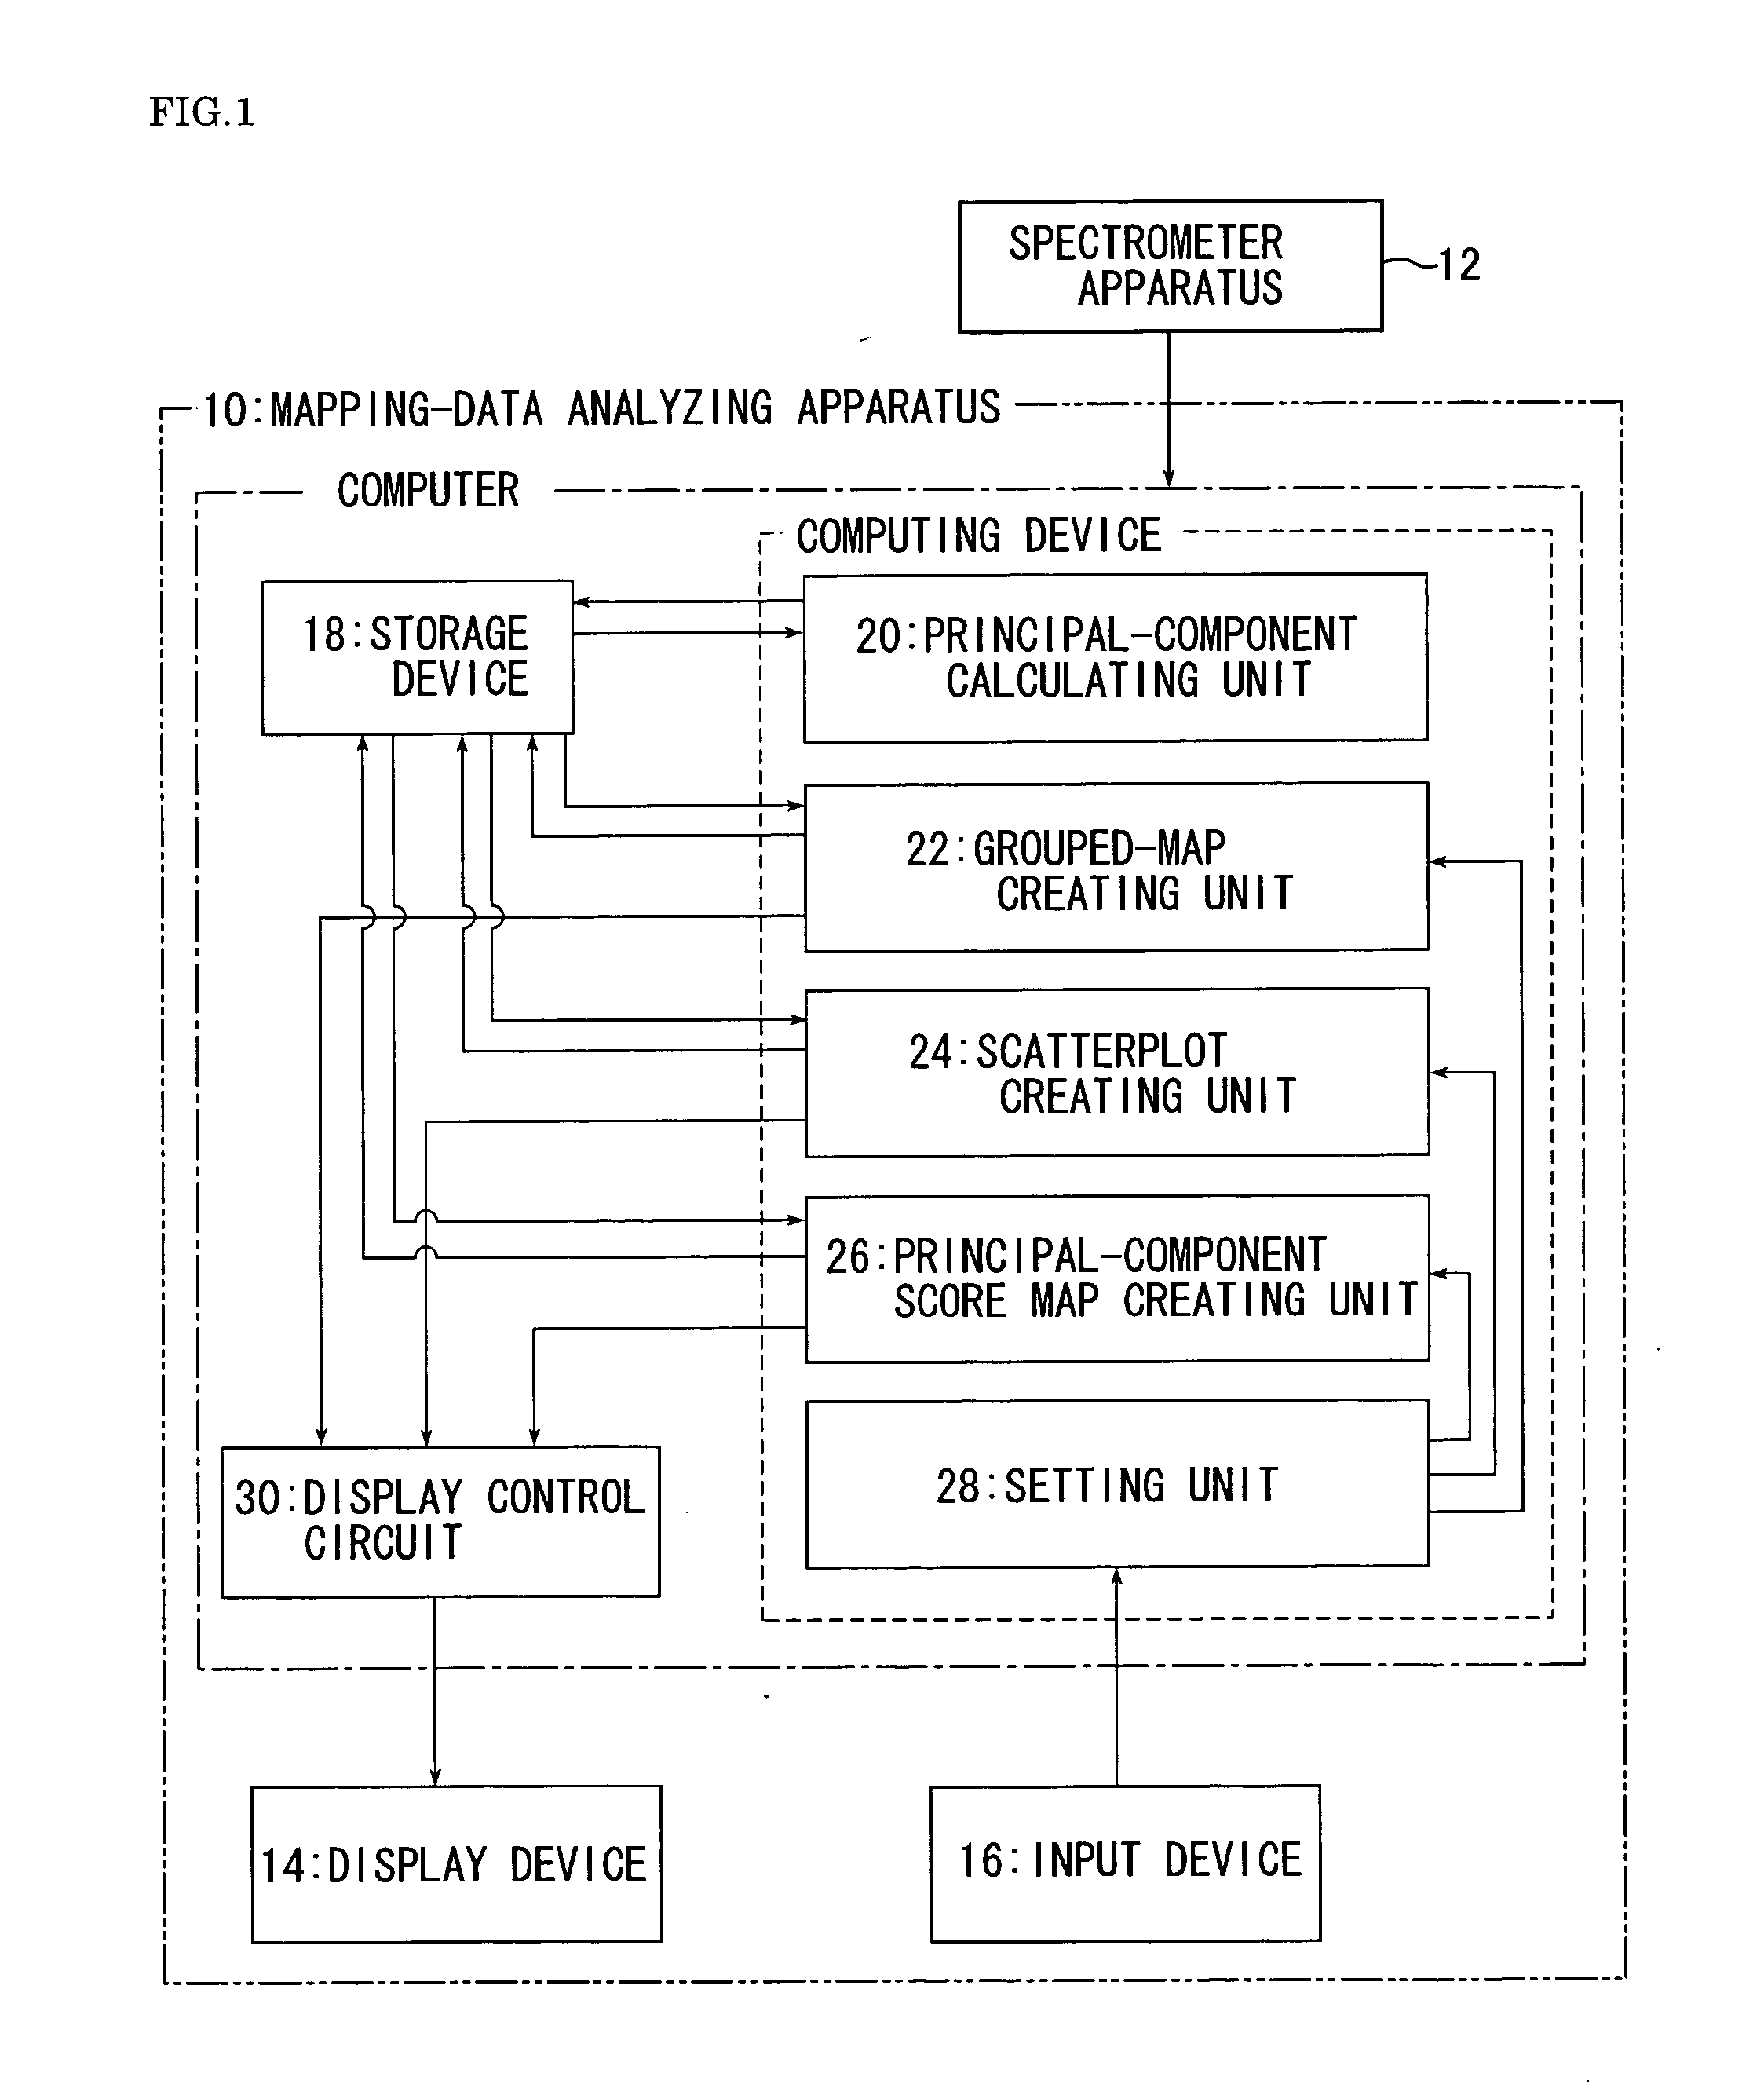
[0043]FIG. 1 is a view showing a rough structure of a mapping-data analyzing apparatus 10 according to a first embodiment of the present invention. The mapping-data analyzing apparatus 10 in FIG. 1 is connected to a spectrometer apparatus 12, which is capable of mapping measurement, and receives measurement data from the spectrometer apparatus 12 and stores it. The spectrometer apparatus 12 is a multi-channel infrared microscope or the like. The mapping-data analyzing apparatus 10 is formed of, for example, a computer and includes a display device 14 and an input device 16, such as a keyboard, a mouse, or the like.

[0044] The spectrometer apparatus 12 measures spectral data from a plurality of points of the specimen surface. The measured spectral data is sent to the mapping-data analyzing apparatus 10 together with position information on the specimen surface, and these are stored in a storage device 18, such as a hard disk or memory. In this way, spectral data for each point on the...

second embodiment

[0061] Next, a second embodiment of the present invention will be described. FIG. 8 is a block diagram of a mapping-data analyzing apparatus 110 according to the second embodiment. Reference numerals for the components and steps corresponding to those shown in FIGS. 1 and 2 have 100 added thereto, and a detailed description thereof is omitted.

[0062] Compared with the mapping-data analyzing apparatus 10 described in the first embodiment, the mapping-data analyzing apparatus 110 shown in FIG. 8 further includes a similarity calculating unit 132, a similarity-map creating unit 134, a concentration calculating unit 136, a concentration-map creating unit 138, a physical-property calculating unit 140, a physical-property-map creating unit 142, a thickness calculating unit 144, and a thickness-map creating unit 146. These units are realized as programs that a computing device in the mapping-data analyzing apparatus 110 executes.

[0063] The similarity calculating unit 132 calculates the si...


PUM


Abstract

It is an object of the present invention to provide a mapping-data analyzing method that can display a map in which sufficient information is extracted from the spectra of obtained mapping data to enable objective analysis. The mapping-data analyzing method of the present invention is used for analyzing mapping data obtained by measuring, with a spectrometer apparatus, spectra at a plurality of points on a specimen surface. The method comprises a principal-component calculating step and a grouped-map display step. In the principal-component calculating step, spectral data obtained at each point on the specimen surface is defined as an individual sample and principal component analysis, in which values at a plurality of wave numbers of each spectral data set serve as variables, is performed to calculate the scores of a plurality of principal components for each individual sample. In the grouped-map display step, the points on the specimen surface are divided into a plurality of groups based on the scores of a plurality of principal components calculated in the principal-component calculating step and a two-dimensional or three-dimensional map indicating to which group each point on the specimen surface belongs is displayed on a display device.

Description

RELATED APPLICATIONS [0001] This application claims priority to the Japanese Patent Application 2004-309447 dated on Oct. 25, 2004 and is hereby incorporated with reference for all purposes. BACKGOUND OF THE INVENTION [0002] 1. Field of the Invention [0003] The present invention relates to improvements of mapping-data analyzing methods, programs, and apparatuses. [0004] 2. Description of Related Art [0005] In order to examine the distribution of substances, defects, and so forth on the surface of a specimen, mapping measurement using a spectrometer is commonly performed. For example, in infrared microscopy, by irradiating a minute region on a specimen surface with infrared light and detecting the transmitted light or the light reflected therefrom, an infrared spectrum of the minute region can be collected. By moving the measuring region on the specimen or by using a two-dimensional detector, infrared spectra can be collected from each point on the specimen surface, and the distribut...

Claims


Application Information

Patent Timeline
IPC IPC(8): G06K9/46G06K9/62G01N21/27G01N21/35
CPCG06K9/0014G06K9/6253G06V20/695G06F18/40
Inventor AKOA, KENICHINAGOSHI, TOSHIYUKI
Owner JASCO CORP
Why Eureka
Try Eureka