
Alternate progress indicator displays

a technology of progress indicators and display screens, applied in computing, instruments, electric digital data processing, etc., can solve the problems of removing meaningfulness, reducing the value of progress bars, and leaving users completely ignorant of what they actually represen

Inactive Publication Date: 2007-08-16
IBM CORP
View PDF6 Cites 73 Cited by
  • Summary
  • Abstract
  • Description
  • Claims
  • Application Information

AI Technical Summary

Problems solved by technology

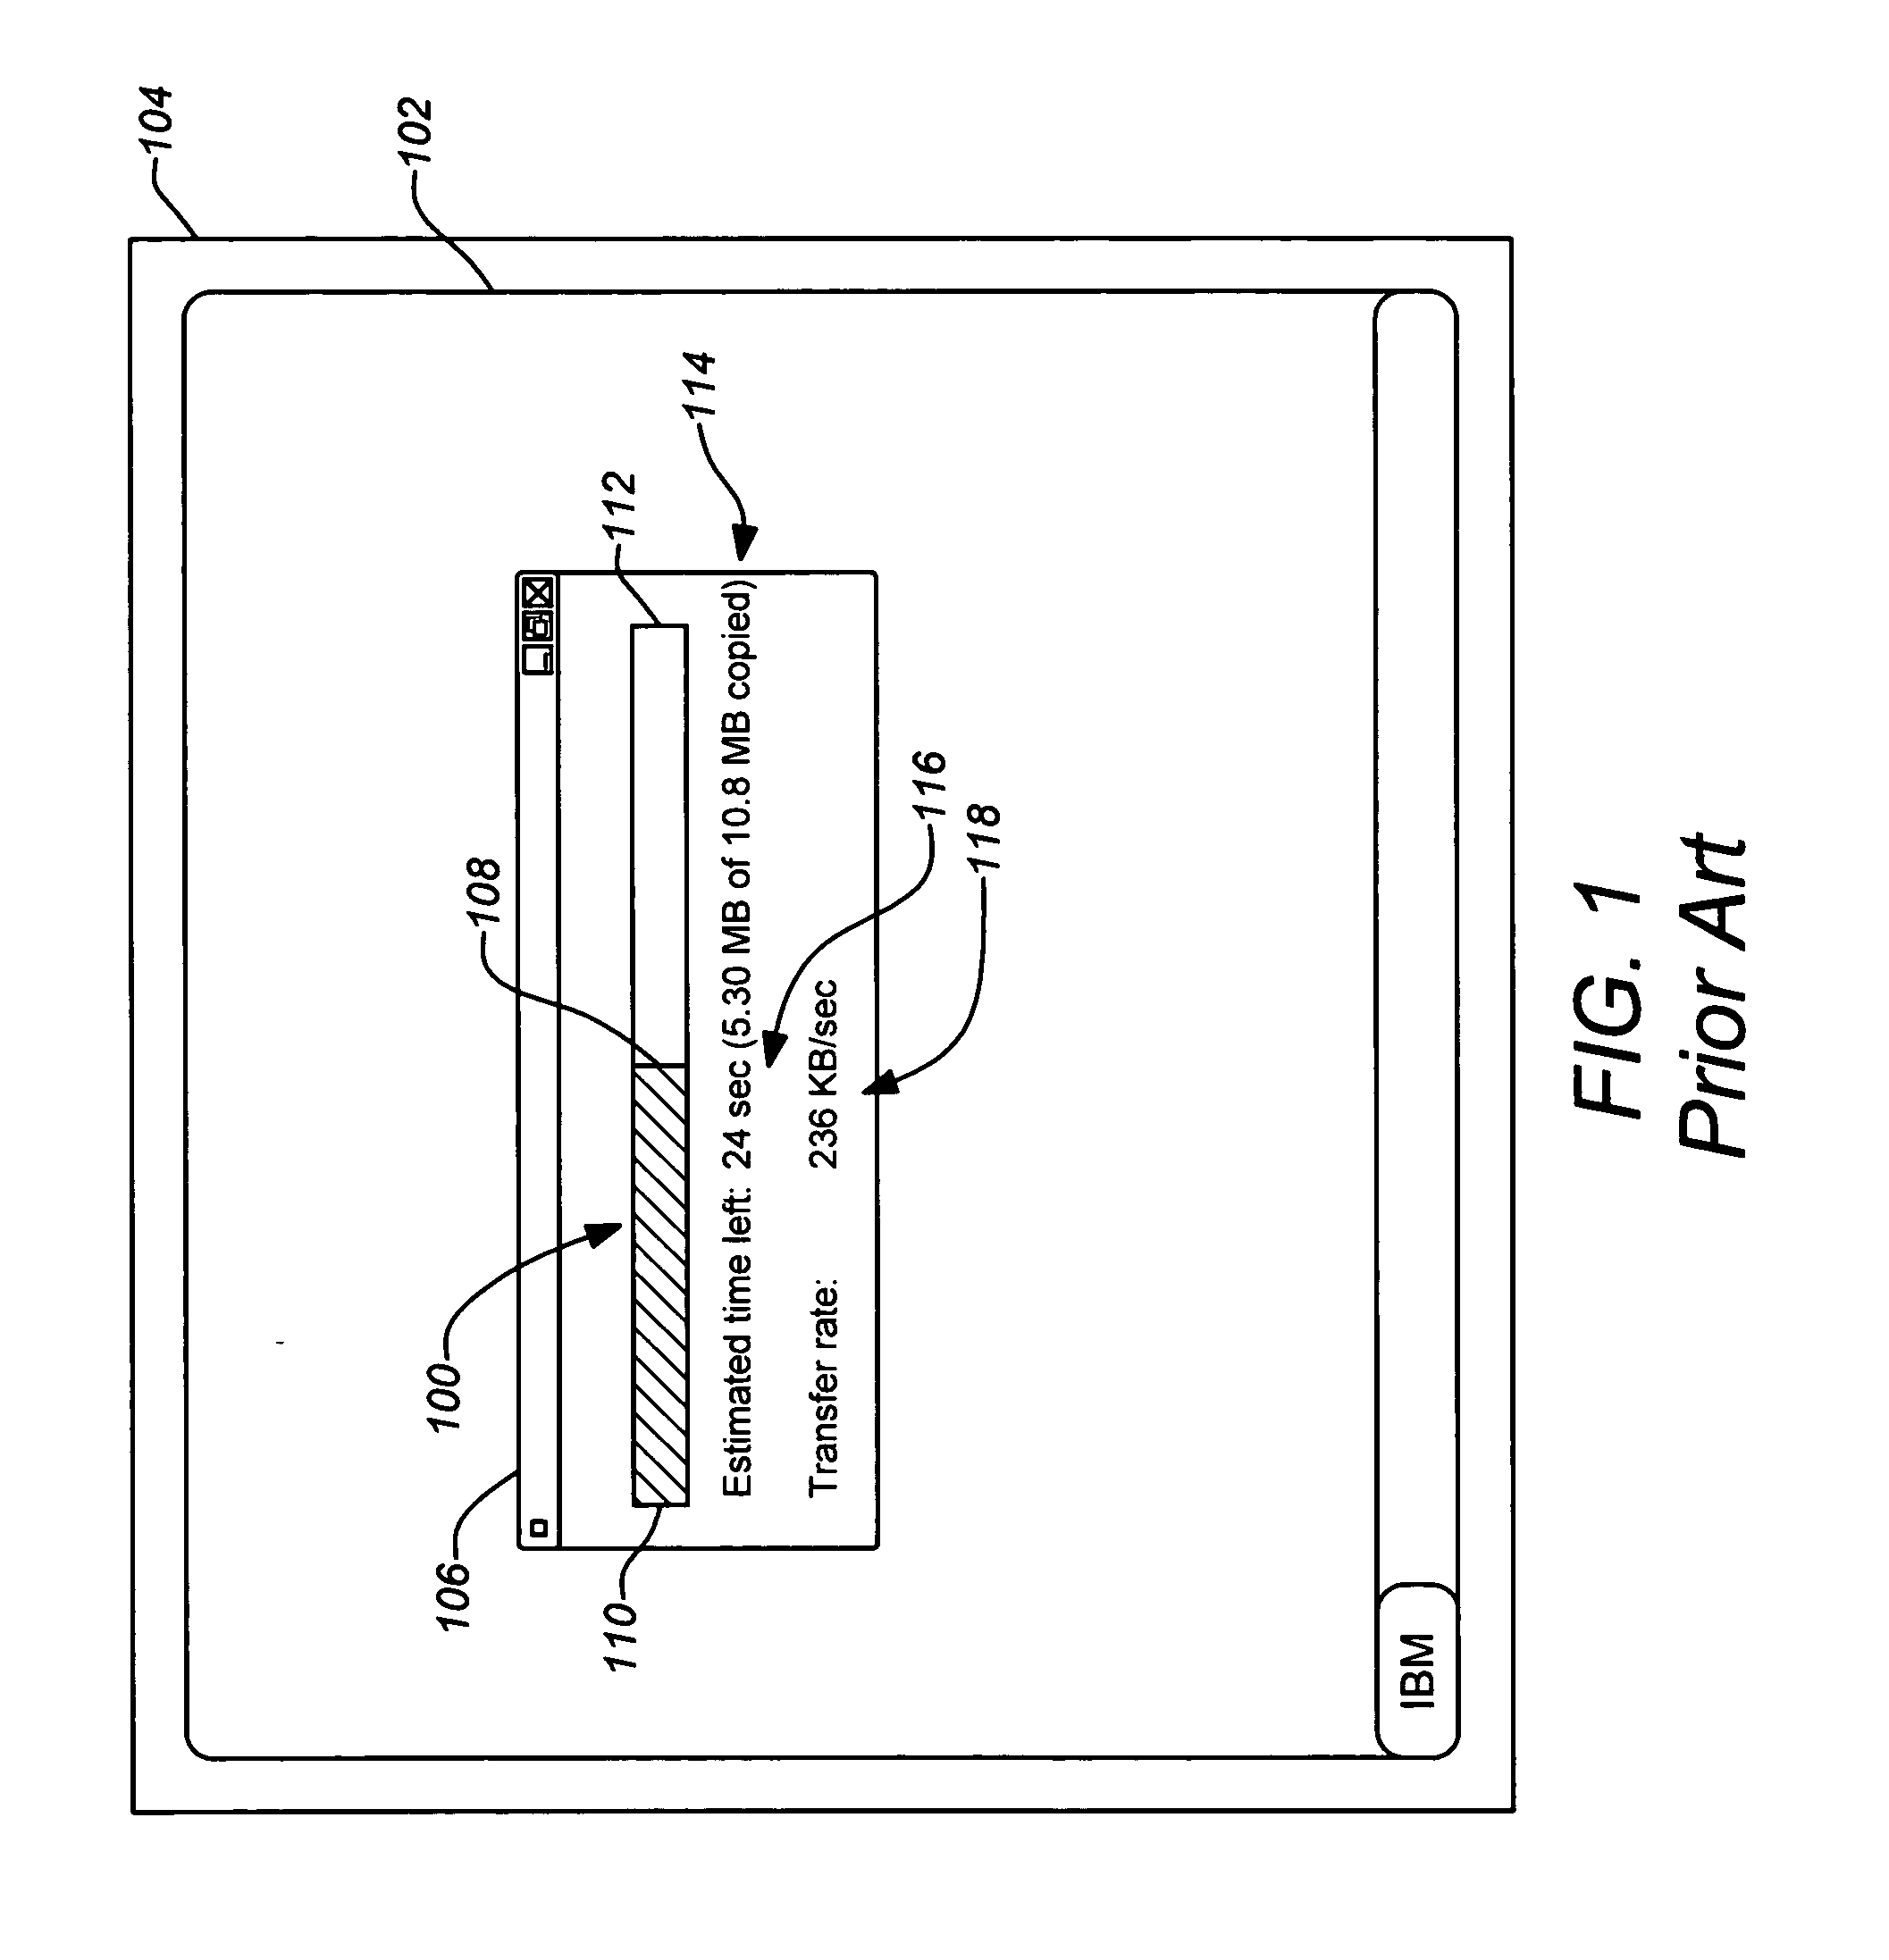
In many cases, the scale of conventional progress bars are often not shown, eliminating meaningful information and leaving the user completely ignorant of what they actually represent.
In this case, the progress bar is even less meaningful to the user who has no idea how many progress bar animations must be viewed from start to finish before the overall process is actually completed.
For example, an automated process may become stalled such that the instantaneous rate is zero.
However, because the rate shown is a running average, this may not be immediately apparent to the user.
Thus, there are no widespread solutions in use today that address these issues.
However, the transfer rate value is not graphical and provides only instantaneous information as it is constantly changing.
In addition, such conventional displays do not provide any instantaneous rate information, including historical rate information.
Similarly, a remaining time estimate is displayed only as a changing number and presents the same limitations.

Method used


Image

  • Alternate progress indicator displays
  • Alternate progress indicator displays
  • Alternate progress indicator displays

Examples


Embodiment Construction

[0027] 1. Overview

[0028] Various embodiments of the present invention allow a user to quickly determine rate of completion and time remaining while performing a long-running task. In addition a user may also employ historical rate of completion data for making decisions regarding when and how to commit the automated computed processes in the future. Embodiments of the invention, also operate while conserving GUI real estate, which can be particularly limited in a dialog box. Also, a user can easily see an estimated rate of completion as it is constantly changing.

[0029] To meet these goals, various embodiments of the present invention are directed to graphical status displays which show graphical time-based information, such as rate and estimated time to completion, as well as a completion portion of an automated computer process. A remaining time indicator can be shown as a time scale for the graphical completion indicator. Instantaneous and historical rate information may be grap...


PUM


Abstract

Embodiments of the present invention are directed to novel techniques for showing the progress of an automated computer process, particularly through a graphical user interface (GUI). Graphical status displays are employed which show graphical time-based information, such as rate and estimated time to completion, as well as a completion portion of an automated computer process. A remaining time indicator can be shown as a time scale for the graphical completion indicator. Instantaneous and historical rate information may be graphically displayed in various novel displays.

Description

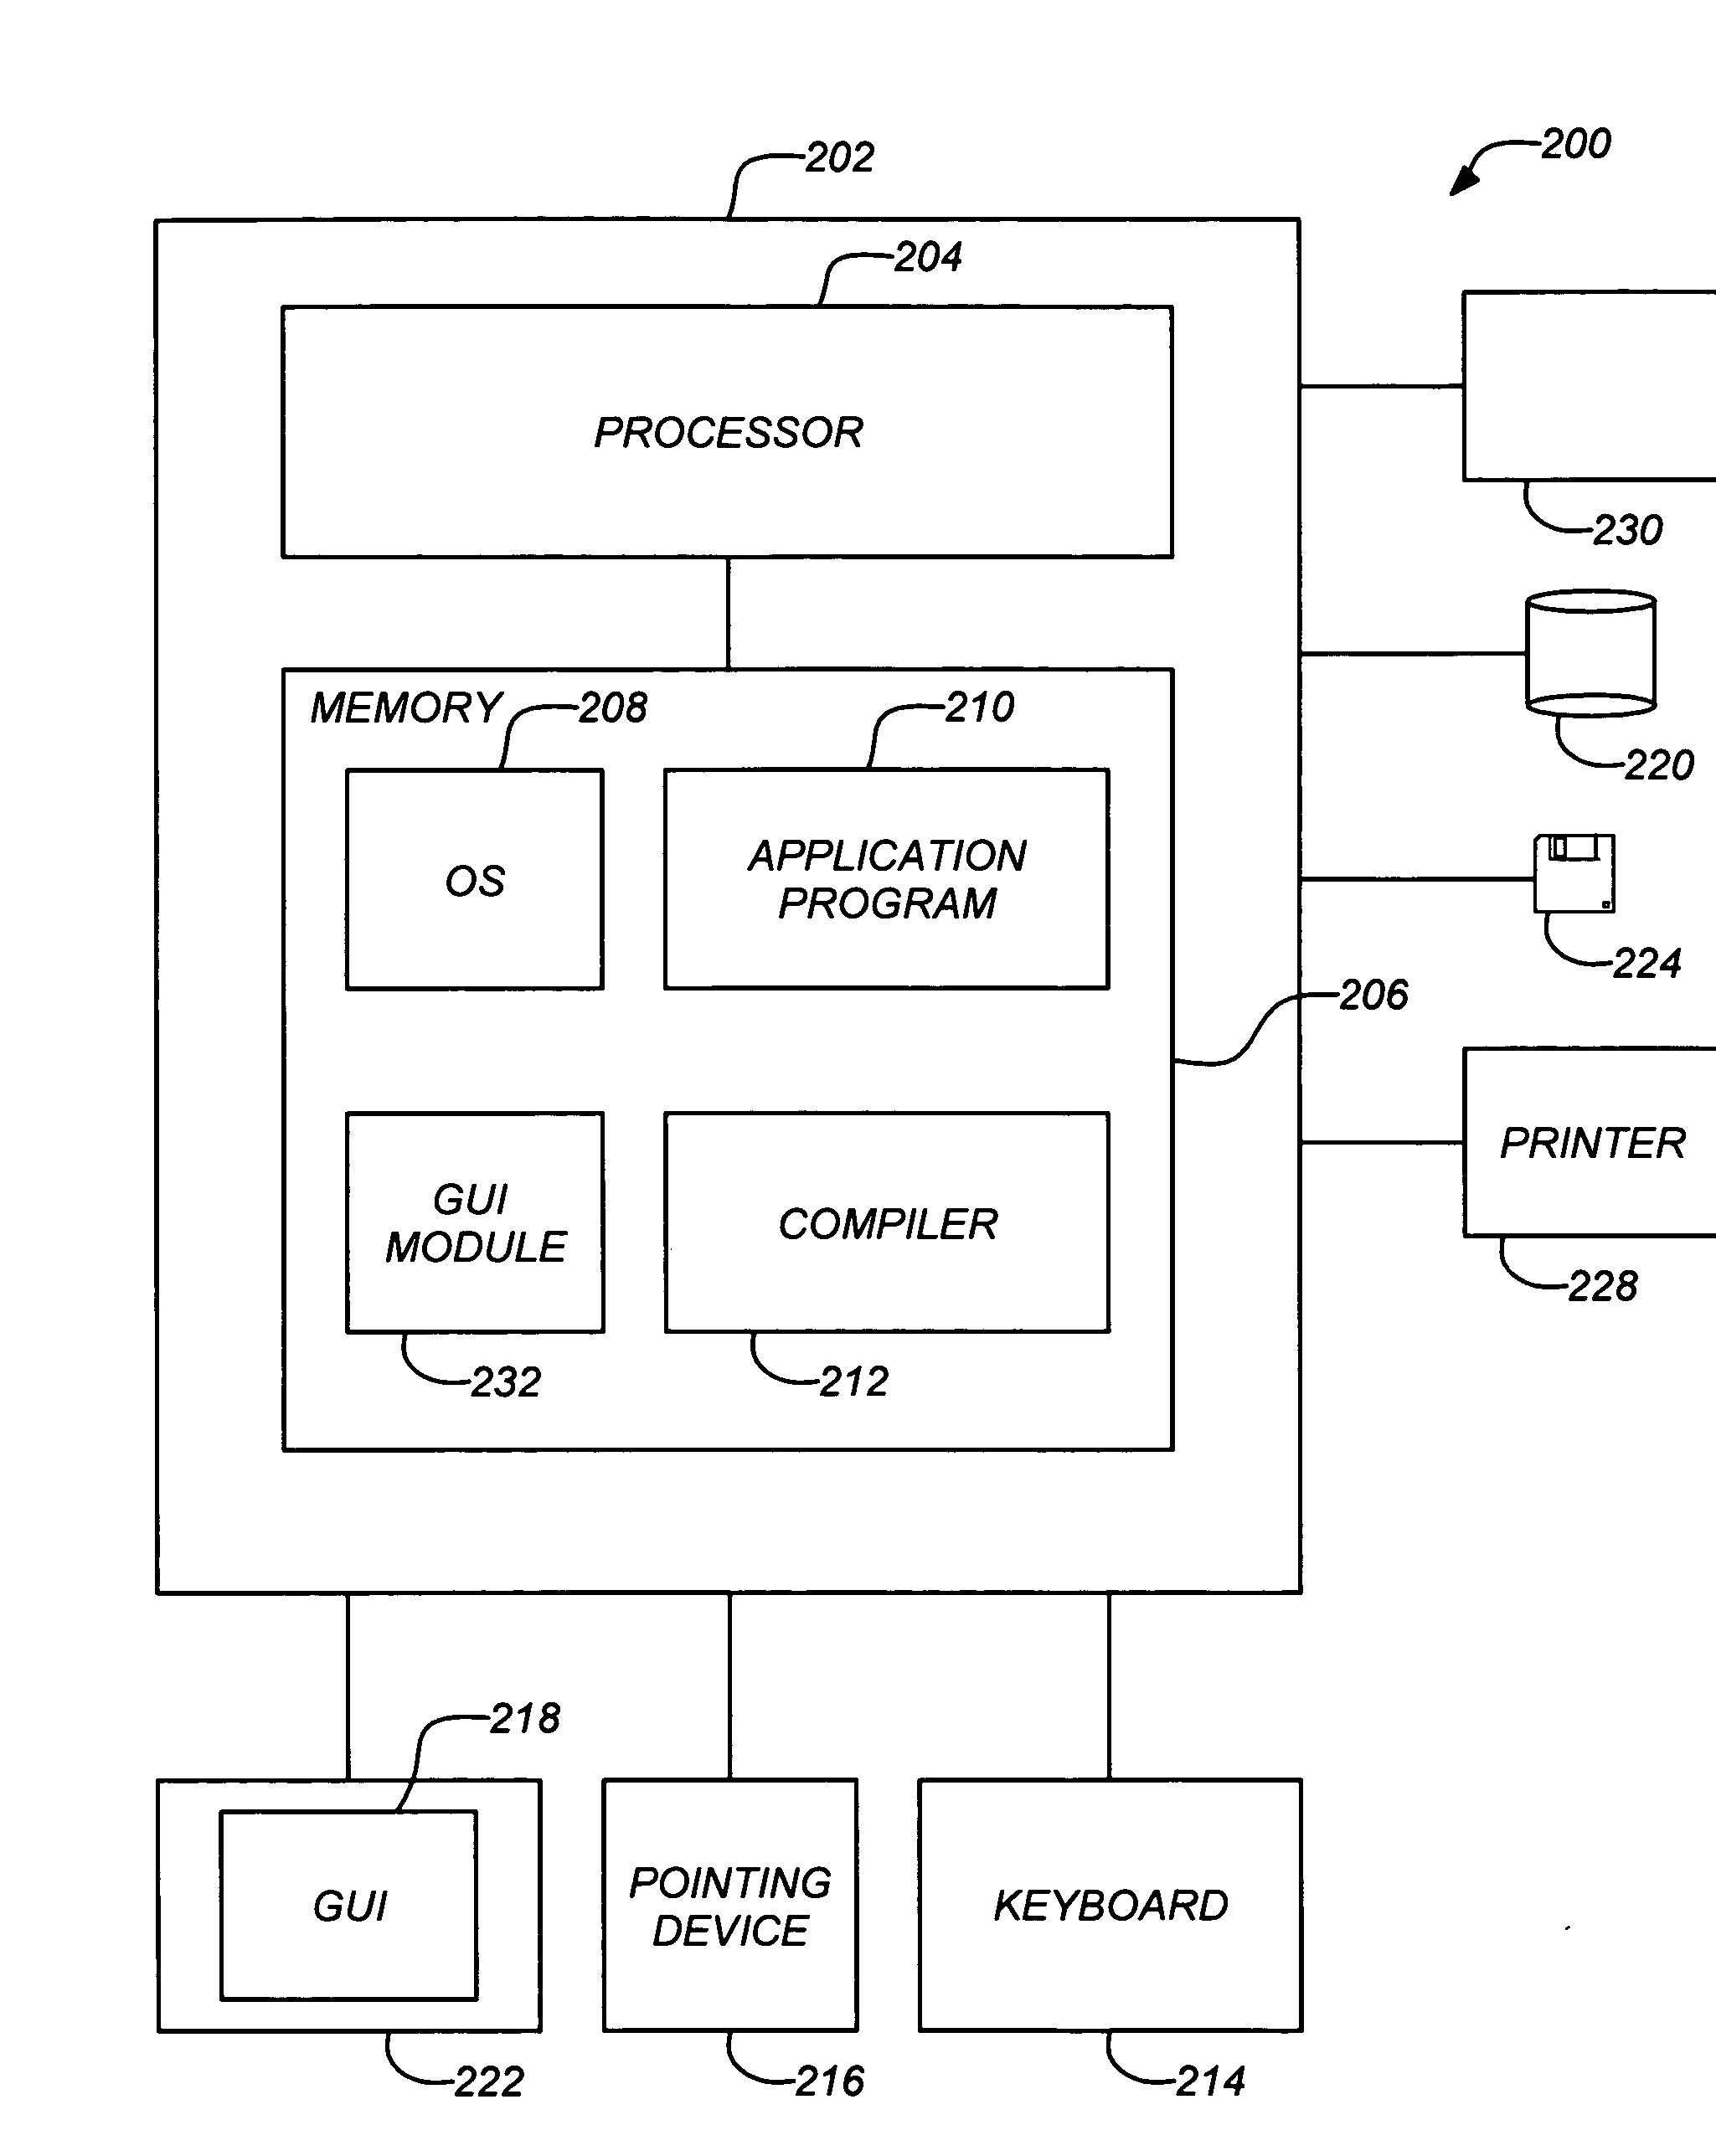
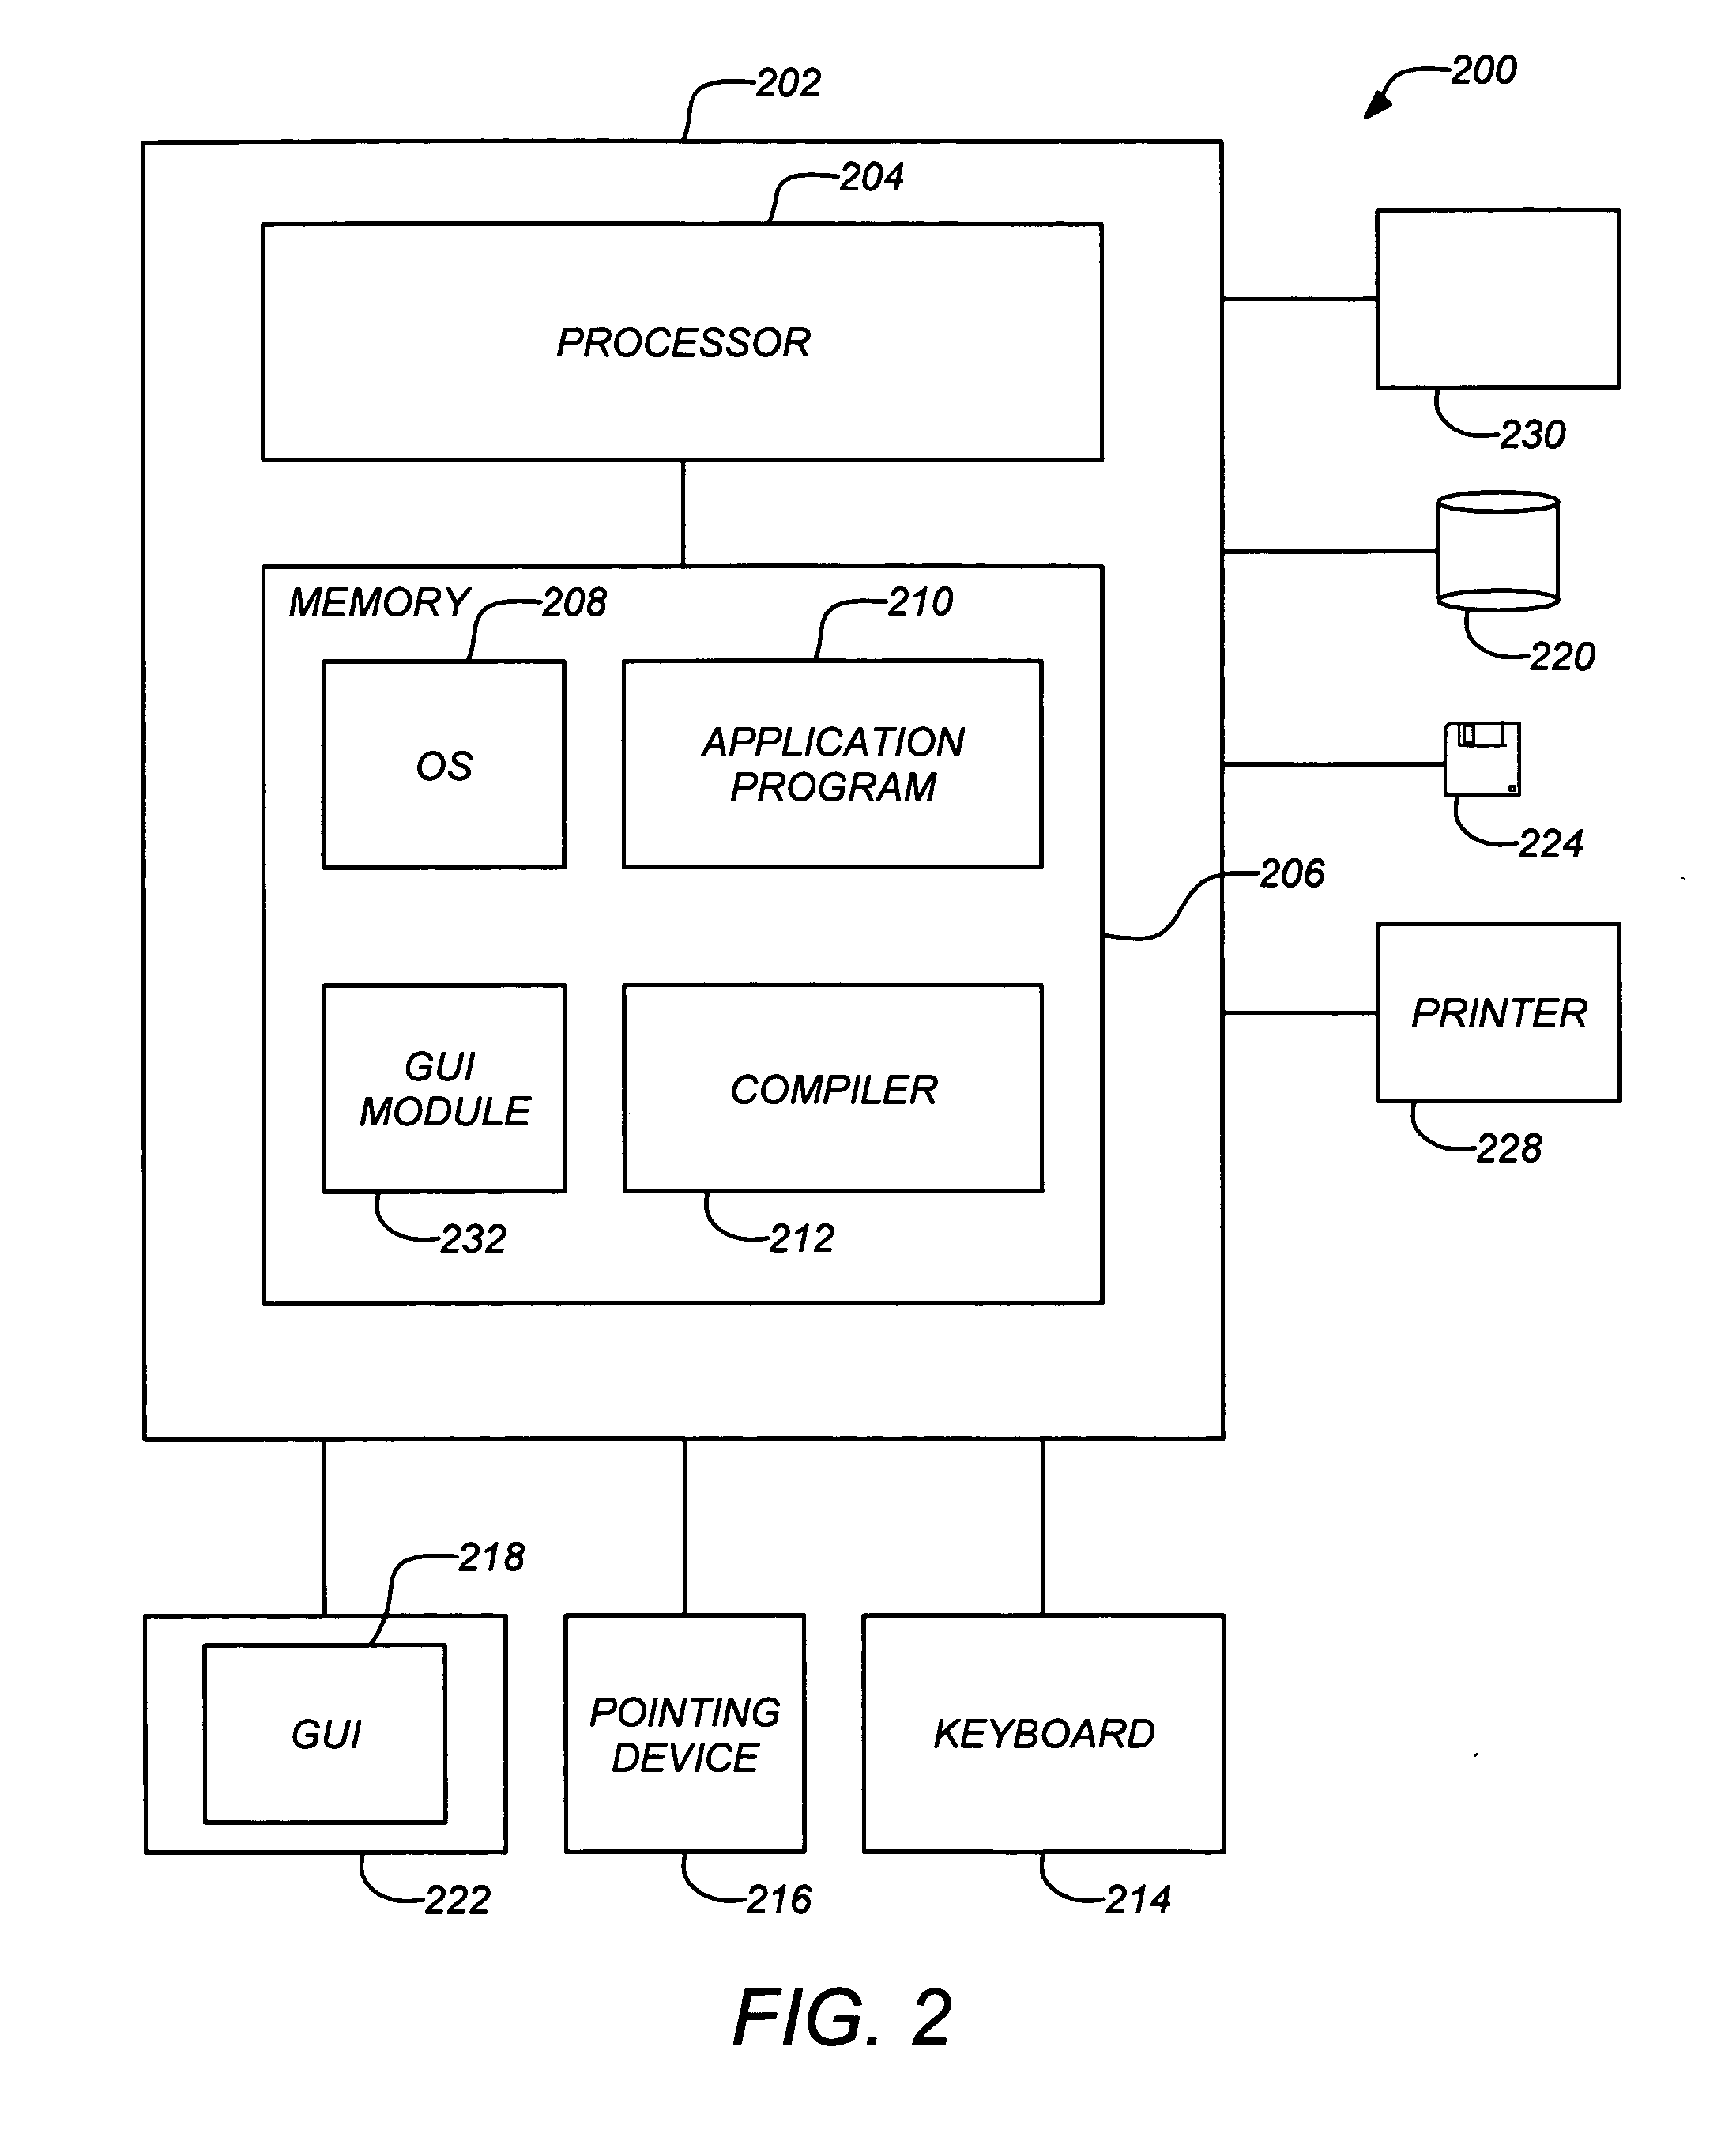
BACKGROUND OF THE INVENTION [0001] 1. Field of the Invention [0002] This invention relates to computer implemented systems and methods for indicating the progress of a computer process. Particularly, the invention relates to systems and methods indicating the progress of a computer process through a graphical user interface (GUI). [0003] 2. Description of the Related Art [0004] Progress bars are a well known visual indicator used in almost every type of software, and particularly those which employ a graphical user interface (GUI). For example, progress bars are commonly used to indicate the progress of a software installation or the progress of a copy or file transfer process. [0005]FIG. 1 illustrates a typical progress bar 100 employed in the GUI 102 of a display 104 for a typical computer operating system. The progress bar 100 may be shown in a window of a running software application 106 which is performing an automated process such as downloading a file, installing a software a...

Claims


Application Information

Patent Timeline
Patent Type & Authority Applications(United States)
IPC IPC(8): G06F17/00
CPCG06F9/4443G06F3/0481G06F9/451
Inventor ANZELDE, THOMAS R.LU, ZHAOLLARENA, OSCARMOLANDER, MARK E.
Owner IBM CORP
Learn More