System and method for applying predictive metric analysis for a business monitoring subsystem

a business monitoring and subsystem technology, applied in the field of business monitoring systems, to achieve the effect of reducing costs

Inactive Publication Date: 2008-07-10
IBM CORP
View PDF12 Cites 16 Cited by
  • Summary
  • Abstract
  • Description
  • Claims
  • Application Information

AI Technical Summary

Problems solved by technology

Most of the existing business performance meta models do not consider time as a first class element and therefore allow for modeling the current state of the business but not future predictions of any of the metrics.

Method used


Image

  • System and method for applying predictive metric analysis for a business monitoring subsystem
  • System and method for applying predictive metric analysis for a business monitoring subsystem
  • System and method for applying predictive metric analysis for a business monitoring subsystem

Examples


Embodiment Construction

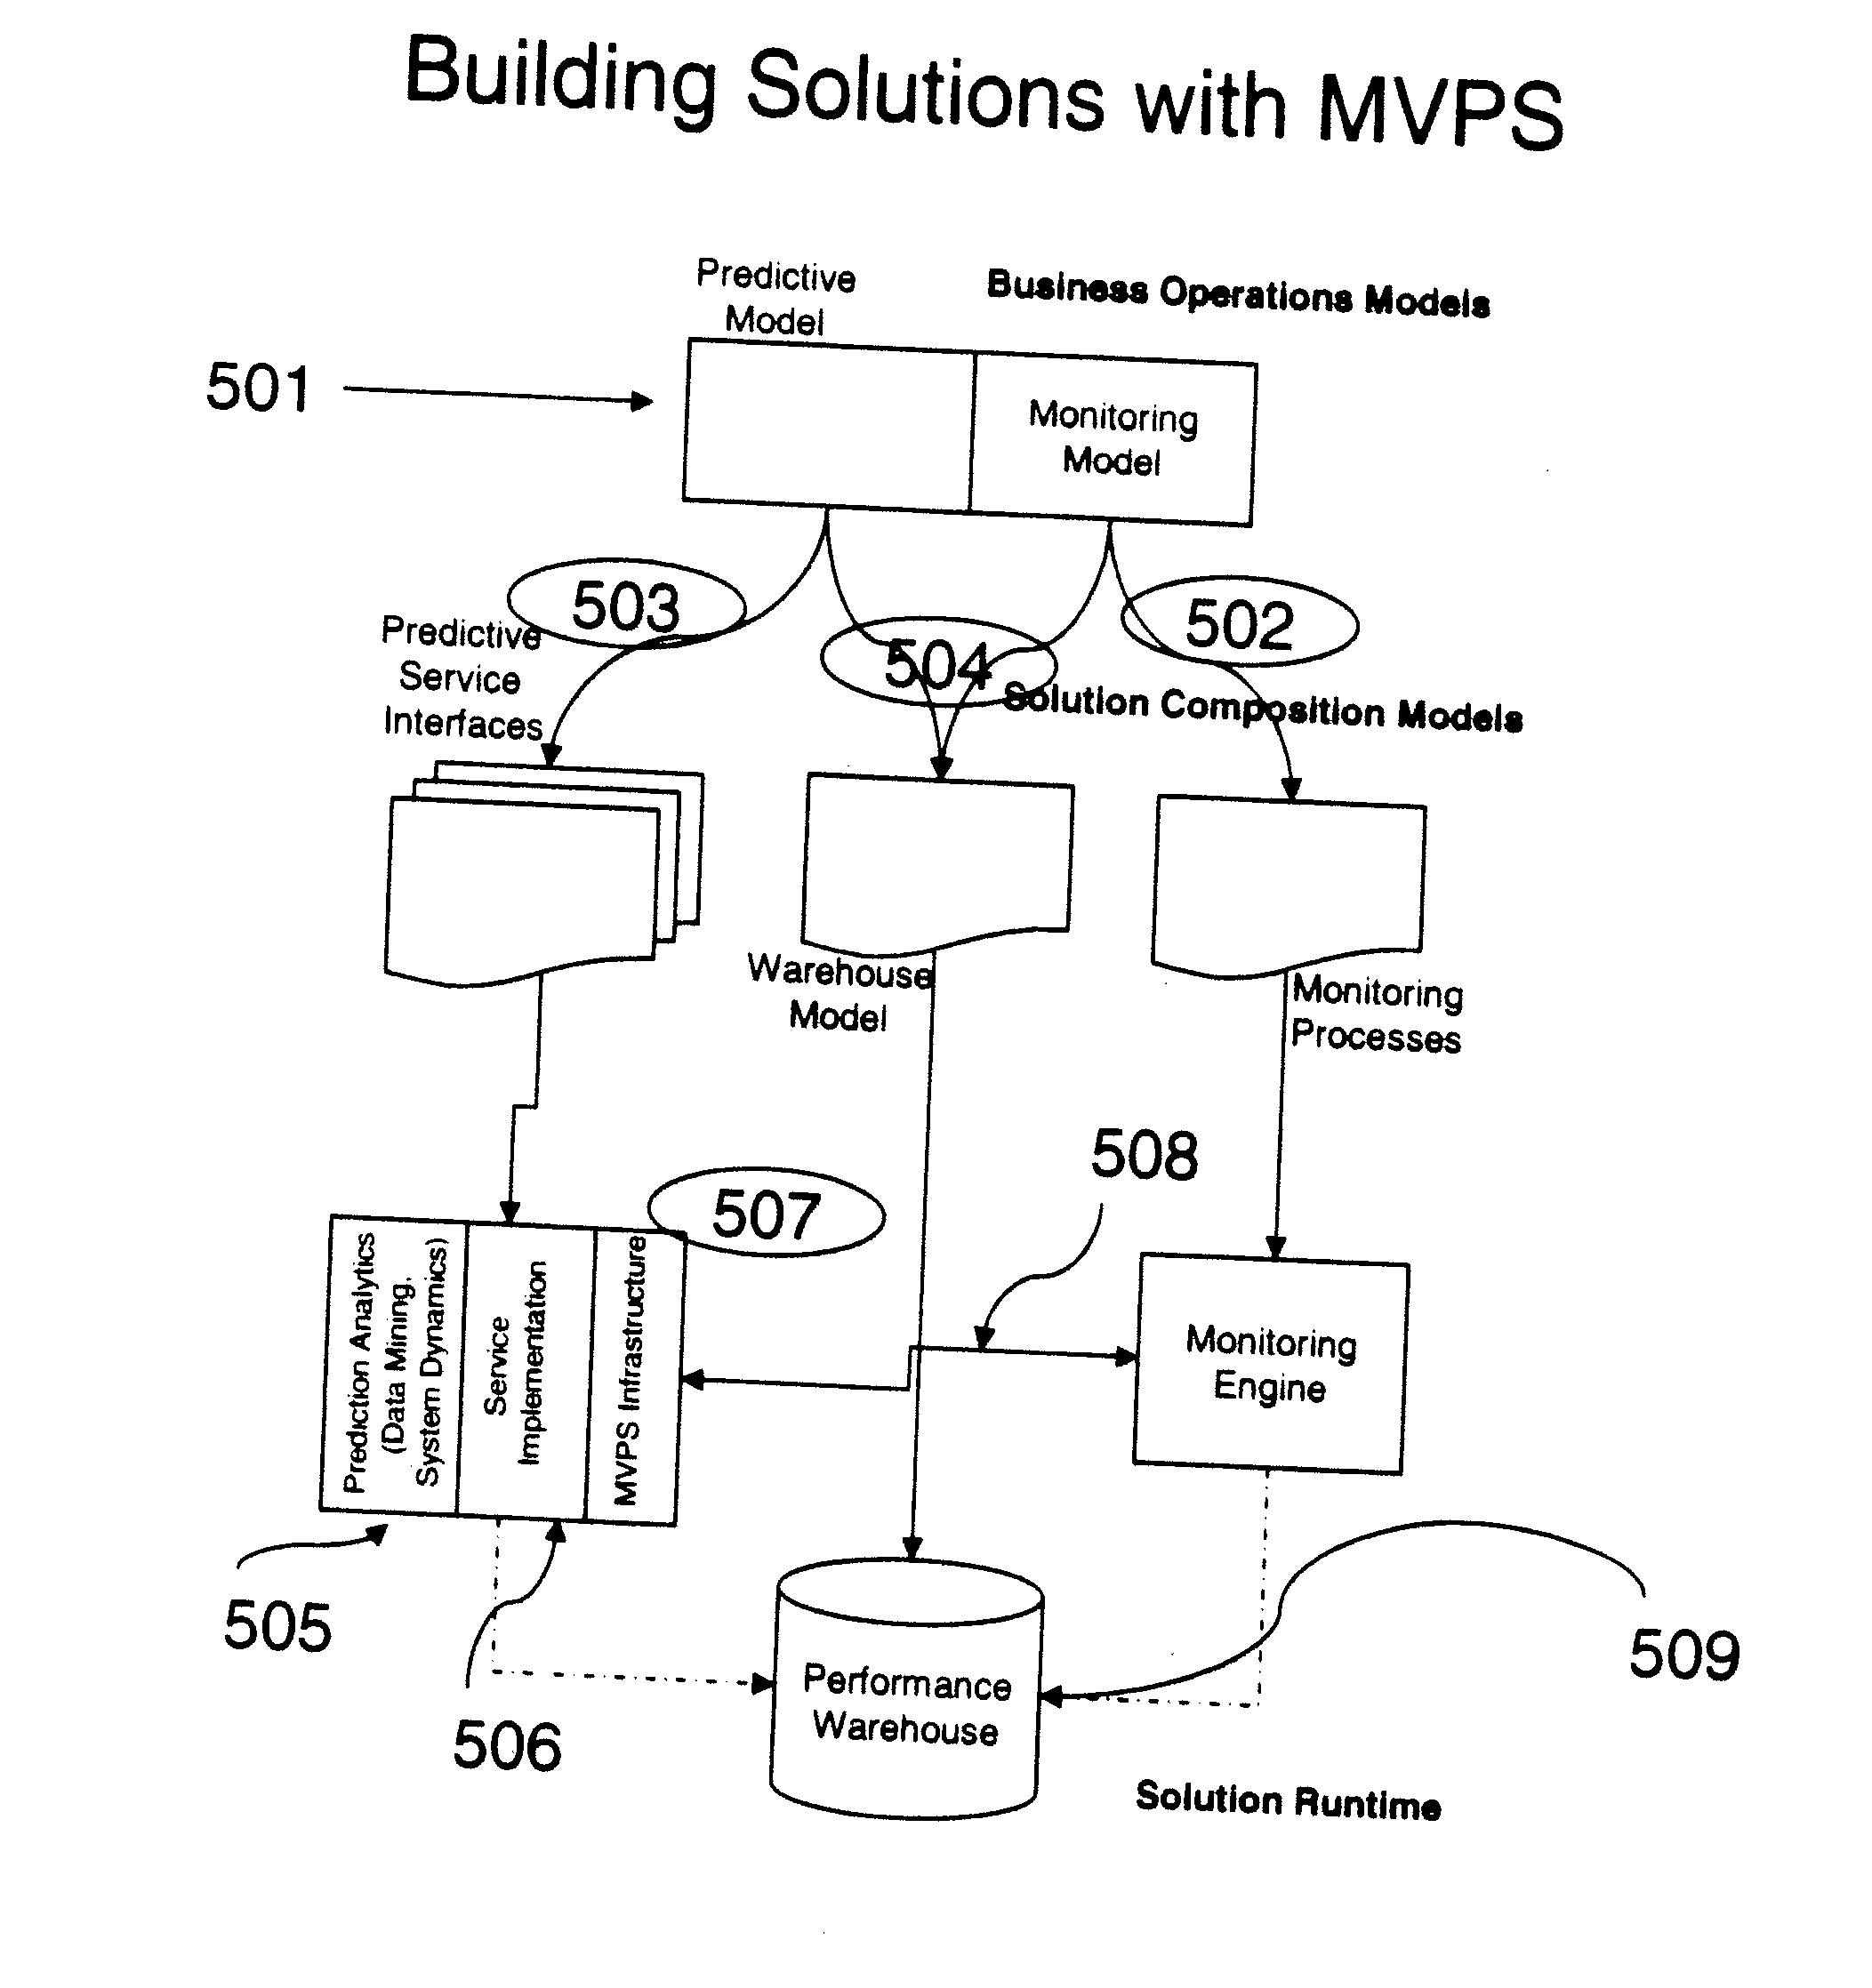
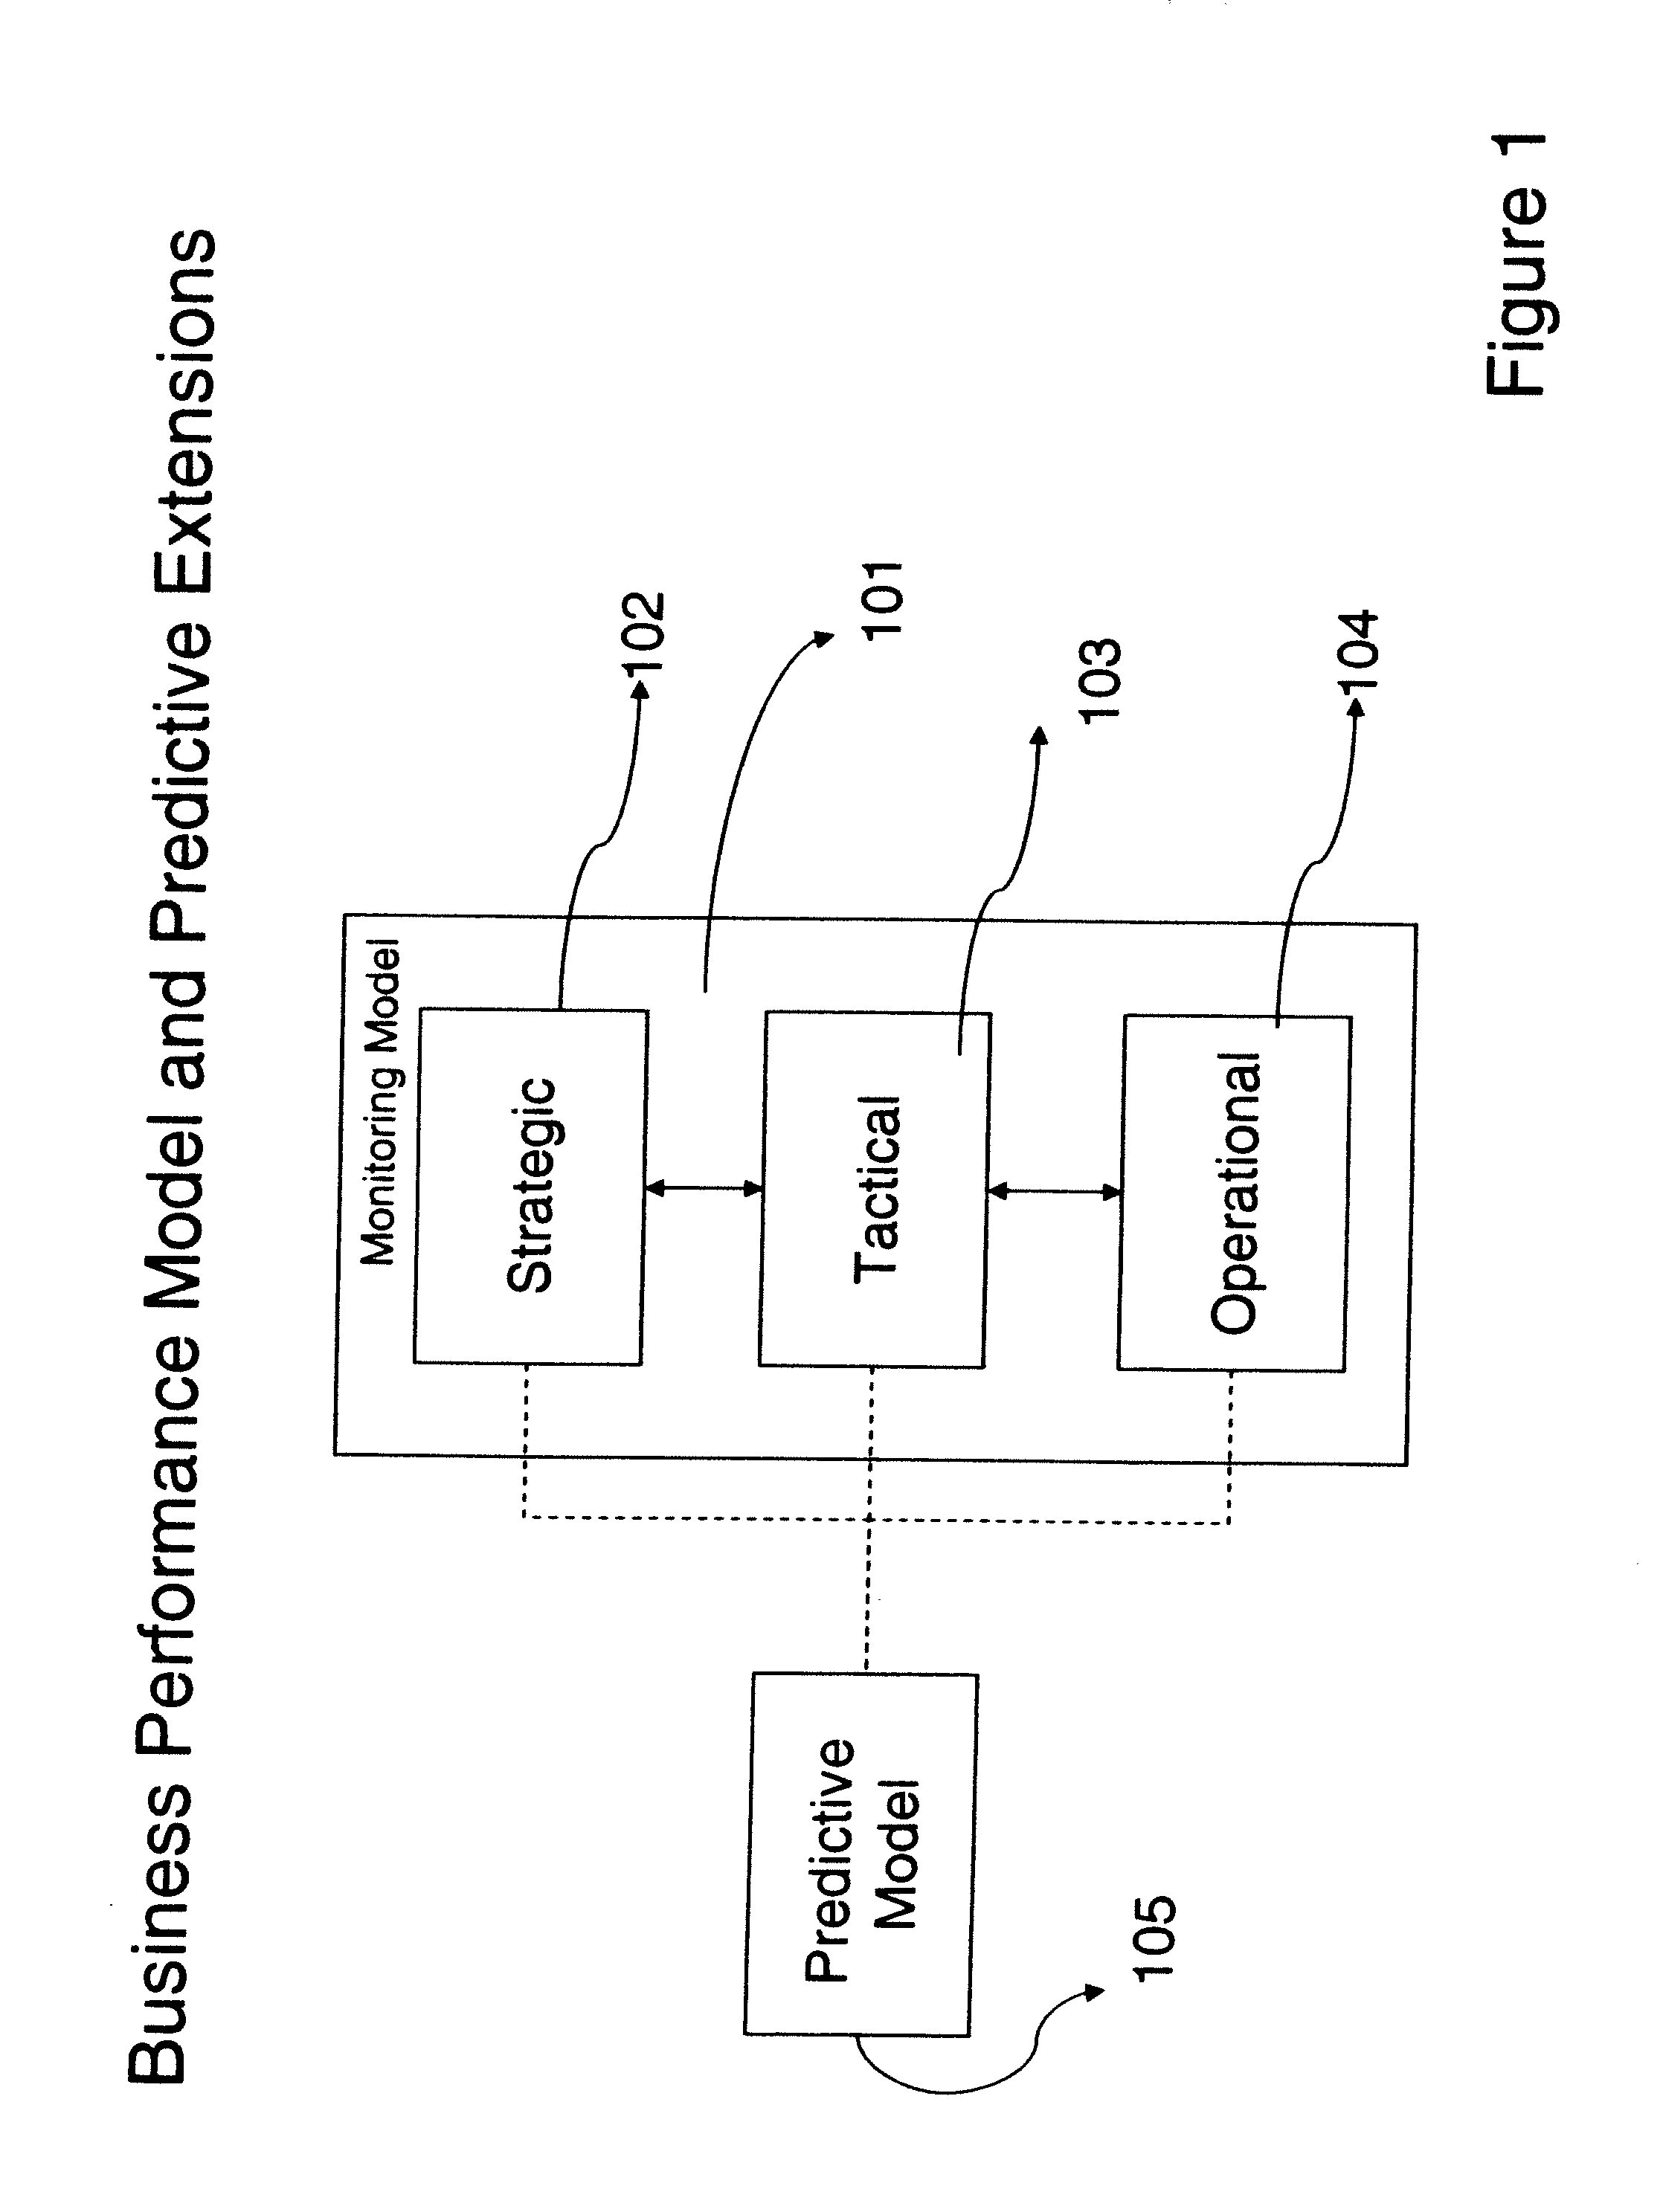
[0018]Referring now to the drawings, and more particularly to FIG. 1, Business Performance Model and Predictive Extensions, there is shown the predictive metric management implemented by the invention. At the top of this diagram are the components of the build time, corresponding to the business owner view of the enterprise. This consists of a predictive model 105 and a monitoring model 101. The predictive model is shown to derive the information on top of the monitoring models. Typically, a metric of interest for the predictive analysis can be chosen along with context metric for predictive analytics. The System then assists user to add additional information as shown in FIG. 4.

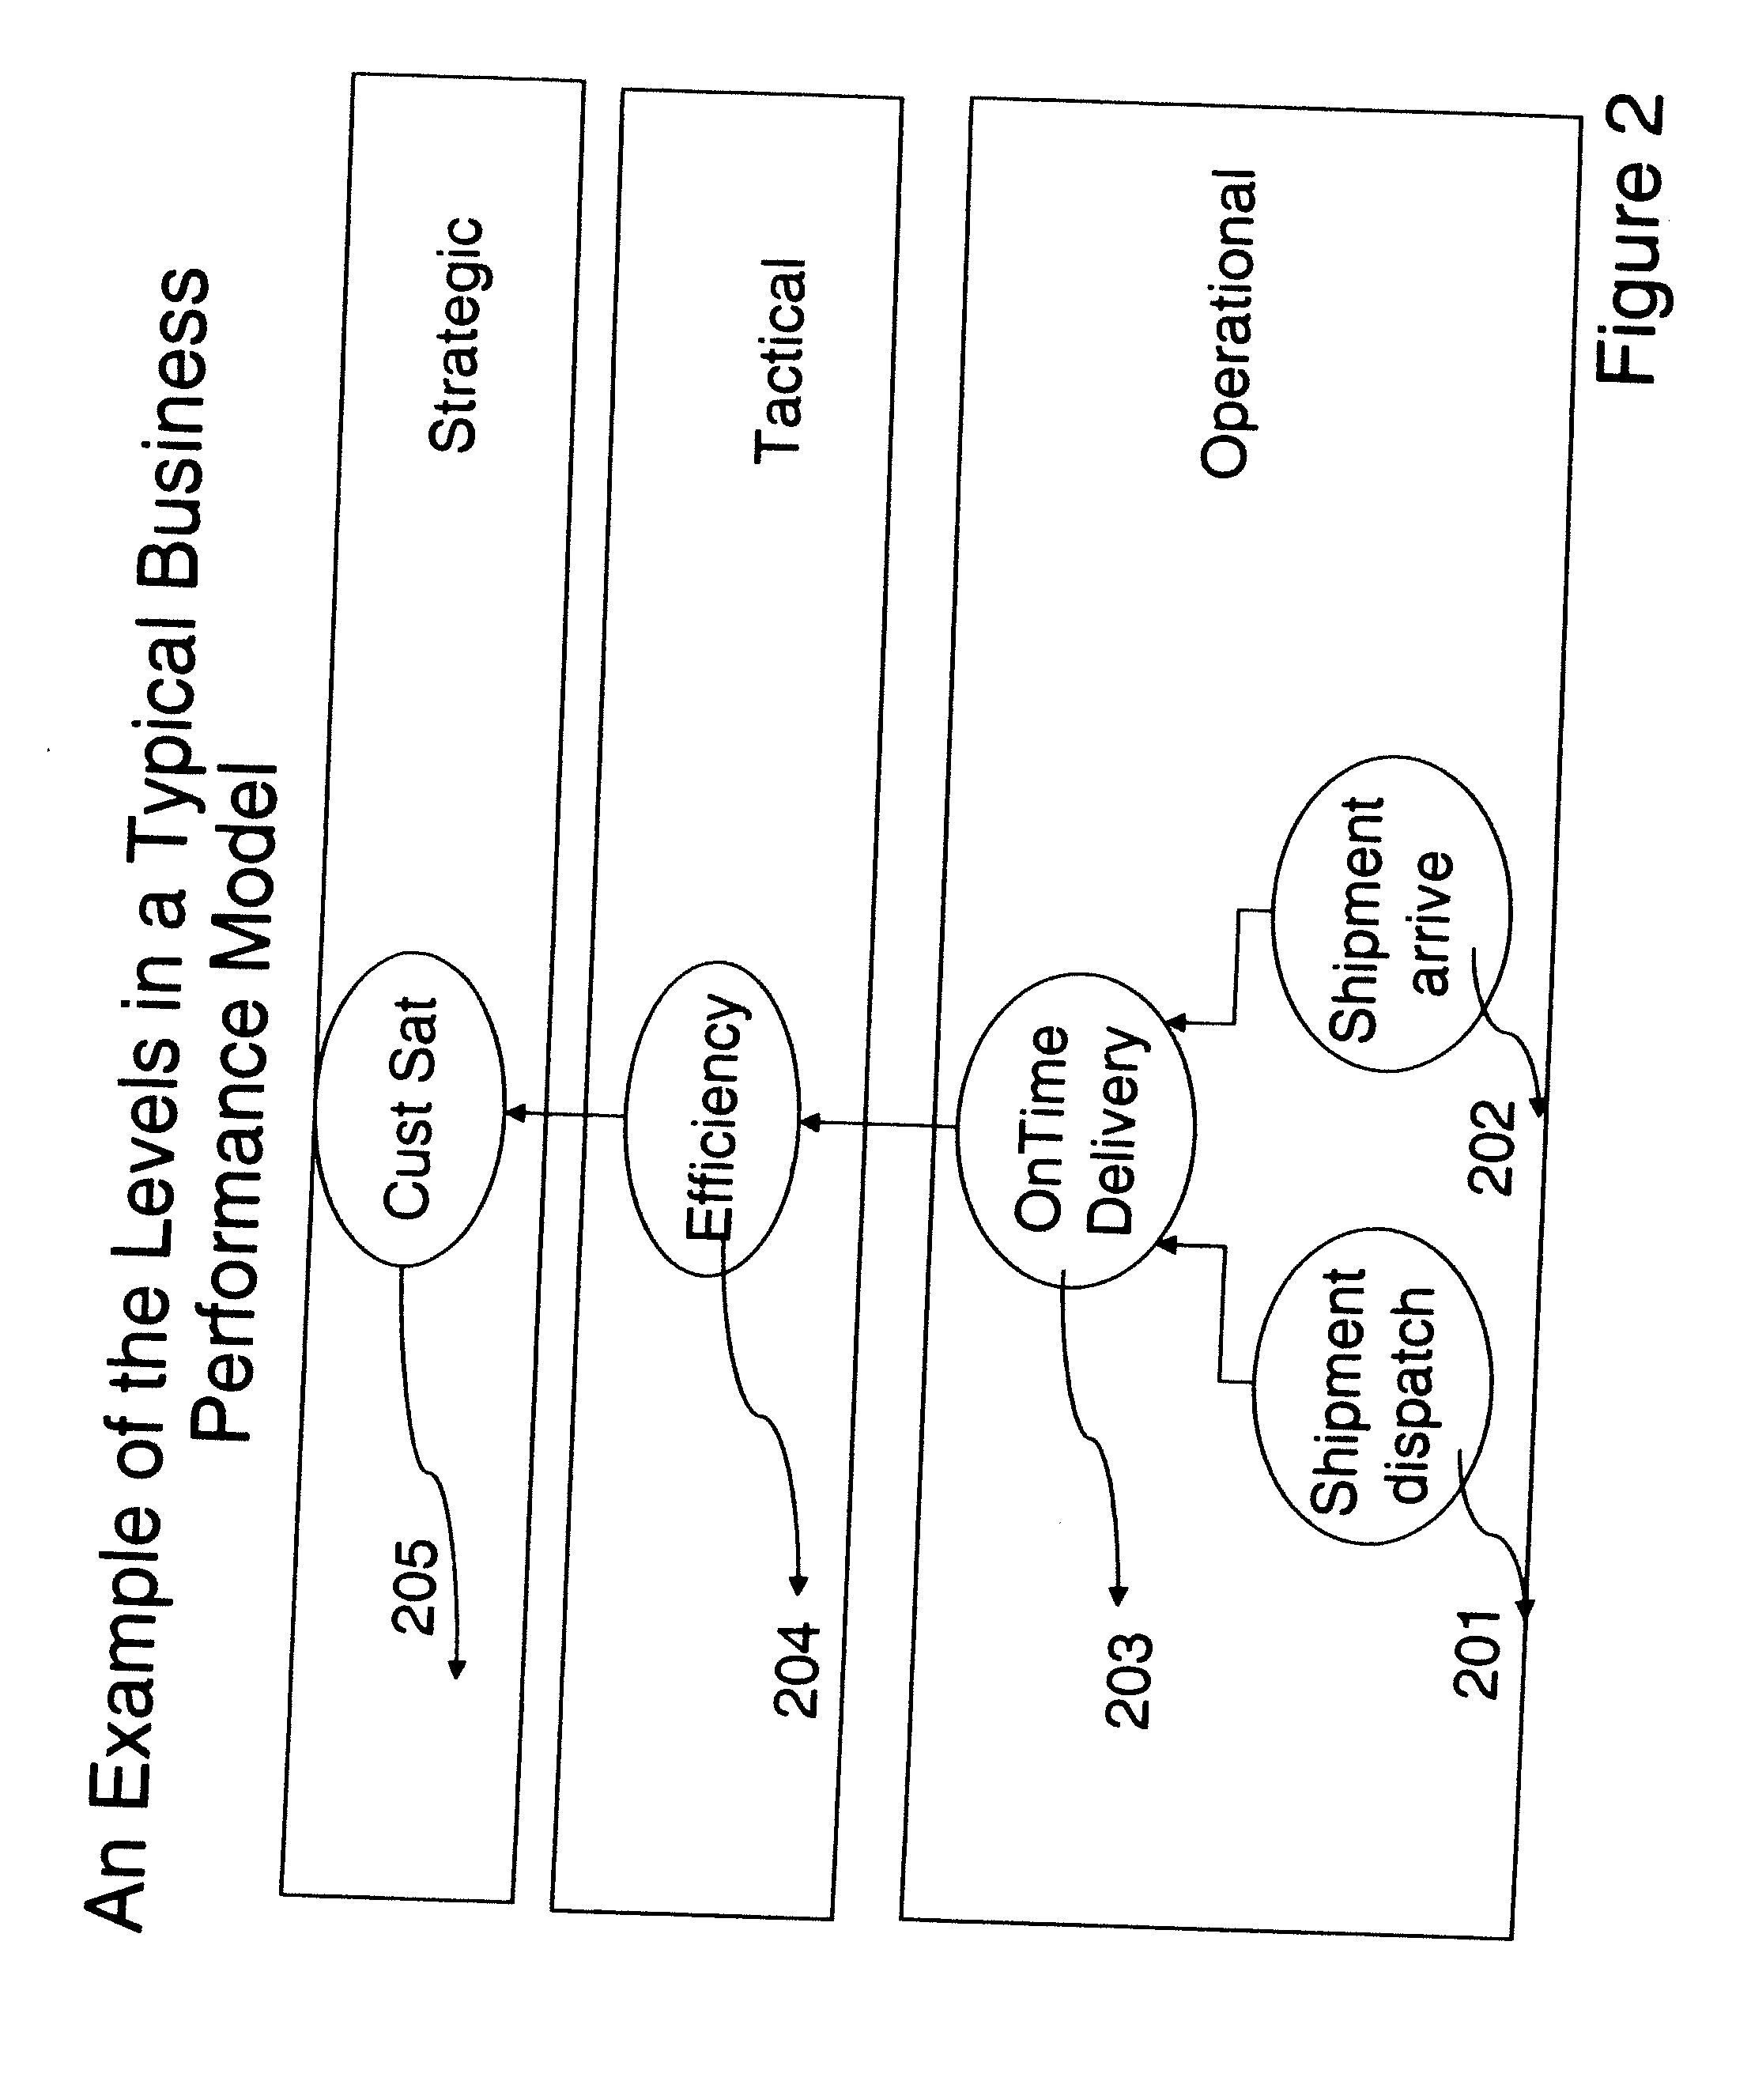
[0019]The monitoring model generally contains metrics that needs to be monitored and corresponding context metrics. These metrics are typically grouped into three levels such as Operational 104, Tactical 103 and Strategic 102. The grouping of metric helps in determining the level of users and the latency of ...


PUM


Abstract

Predictive metric analysis for business management is divided into build time, corresponding to the business owner view of the enterprise, and run time, corresponding to the information technology view of the enterprise. The build time consists of a predictive model and a monitoring model. These models go through transformation processes to the components of the run time. The run time components are a Metric Value Prediction Service (MVPS), which receives as input predictive model transformation and outputs predicted metric values, and a monitoring engine, which receives as input monitoring model transformation, the predicted metric values and business events from the business process. Various analytical engines can be plugged in to provide the predictive capabilities. Input is provided to a framework from various business systems which results in predicting the value of the metrics across the future time horizons.

Description

BACKGROUND OF THE INVENTION[0001]1. Field of the Invention[0002]The present application generally relates to business monitoring systems and, more particularly, to a model driven approach to enhance existing business performance models with predictive modeling capabilities.[0003]2. Background Description[0004]For an enterprise to be competitive, the ability to perform predictive analysis on large amount of data is very important to analyze a trend, discover the paint points, and / or discover new opportunities. Most companies today implement various Business Performance Management solutions including Business Intelligence techniques that help determine the current state of the business. This is achieved by defining metrics or key performance indicators organized in a hierarchy through the various vertical and horizontal silos of the organization. Data and events received in real time are persisted in a data mart and are used to provide historical analysis summarizing what has happened...

Claims


Application Information

Patent Timeline
Patent Type & Authority Applications(United States)
IPC IPC(8): G06Q10/00
CPCG06F2216/03G06Q10/063G06Q10/0637G06Q30/0202G06Q30/02G06Q30/0201G06Q10/06375
Inventor CHOWDHARY, PAWAN RAGHUNATHKAPOOR, SHUBIR
Owner IBM CORP
Why Eureka
Try Eureka