User Simulation for Viewing Web Analytics Data

Active Publication Date: 2008-07-31
ADOBE INC
View PDF19 Cites 67 Cited by
  • Summary
  • Abstract
  • Description
  • Claims
  • Application Information

AI Technical Summary

Benefits of technology

[0081]FIG. 9 shows the virtual focus group GUI 900 with another visit. FIG. 9 illustrates the first page of the visit and the visit has already been simulated and the simulation has been completed, or this visit has not been simulated at all. Clicking the “show another visit” button 720 randomly selects a new visit using the selected filter criteria. FIG. 10 shows the virtual focus group GUI 1000 with the same visit as that shown in FIG. 9. However, at this point the user has selected “browser”1002 from the lower table selection 704. In response, the present invention shows the “browser”1002 in have usually distinct formats such as shaded. This means that all future selected visits using button 720 will match the same criteria. For example, all future visits displayed by the virtual focus group GUI in response to the selection of button 720 will also be from users that use Microsoft Internet Explorer 5.5 as their browser. Referring now also to FIG. 11, the virtual focus group GUI 1100 is shown with the same visit as that shown in FIGS. 9 and 10. However, at this point the user has selected “city” and “country”1102 in addition to “browser”1002. Thes

Problems solved by technology

One difficulty with such statistical information, is that there is presently not a way t

Method used


Image

  • User Simulation for Viewing Web Analytics Data
  • User Simulation for Viewing Web Analytics Data
  • User Simulation for Viewing Web Analytics Data

Examples


Embodiment Construction

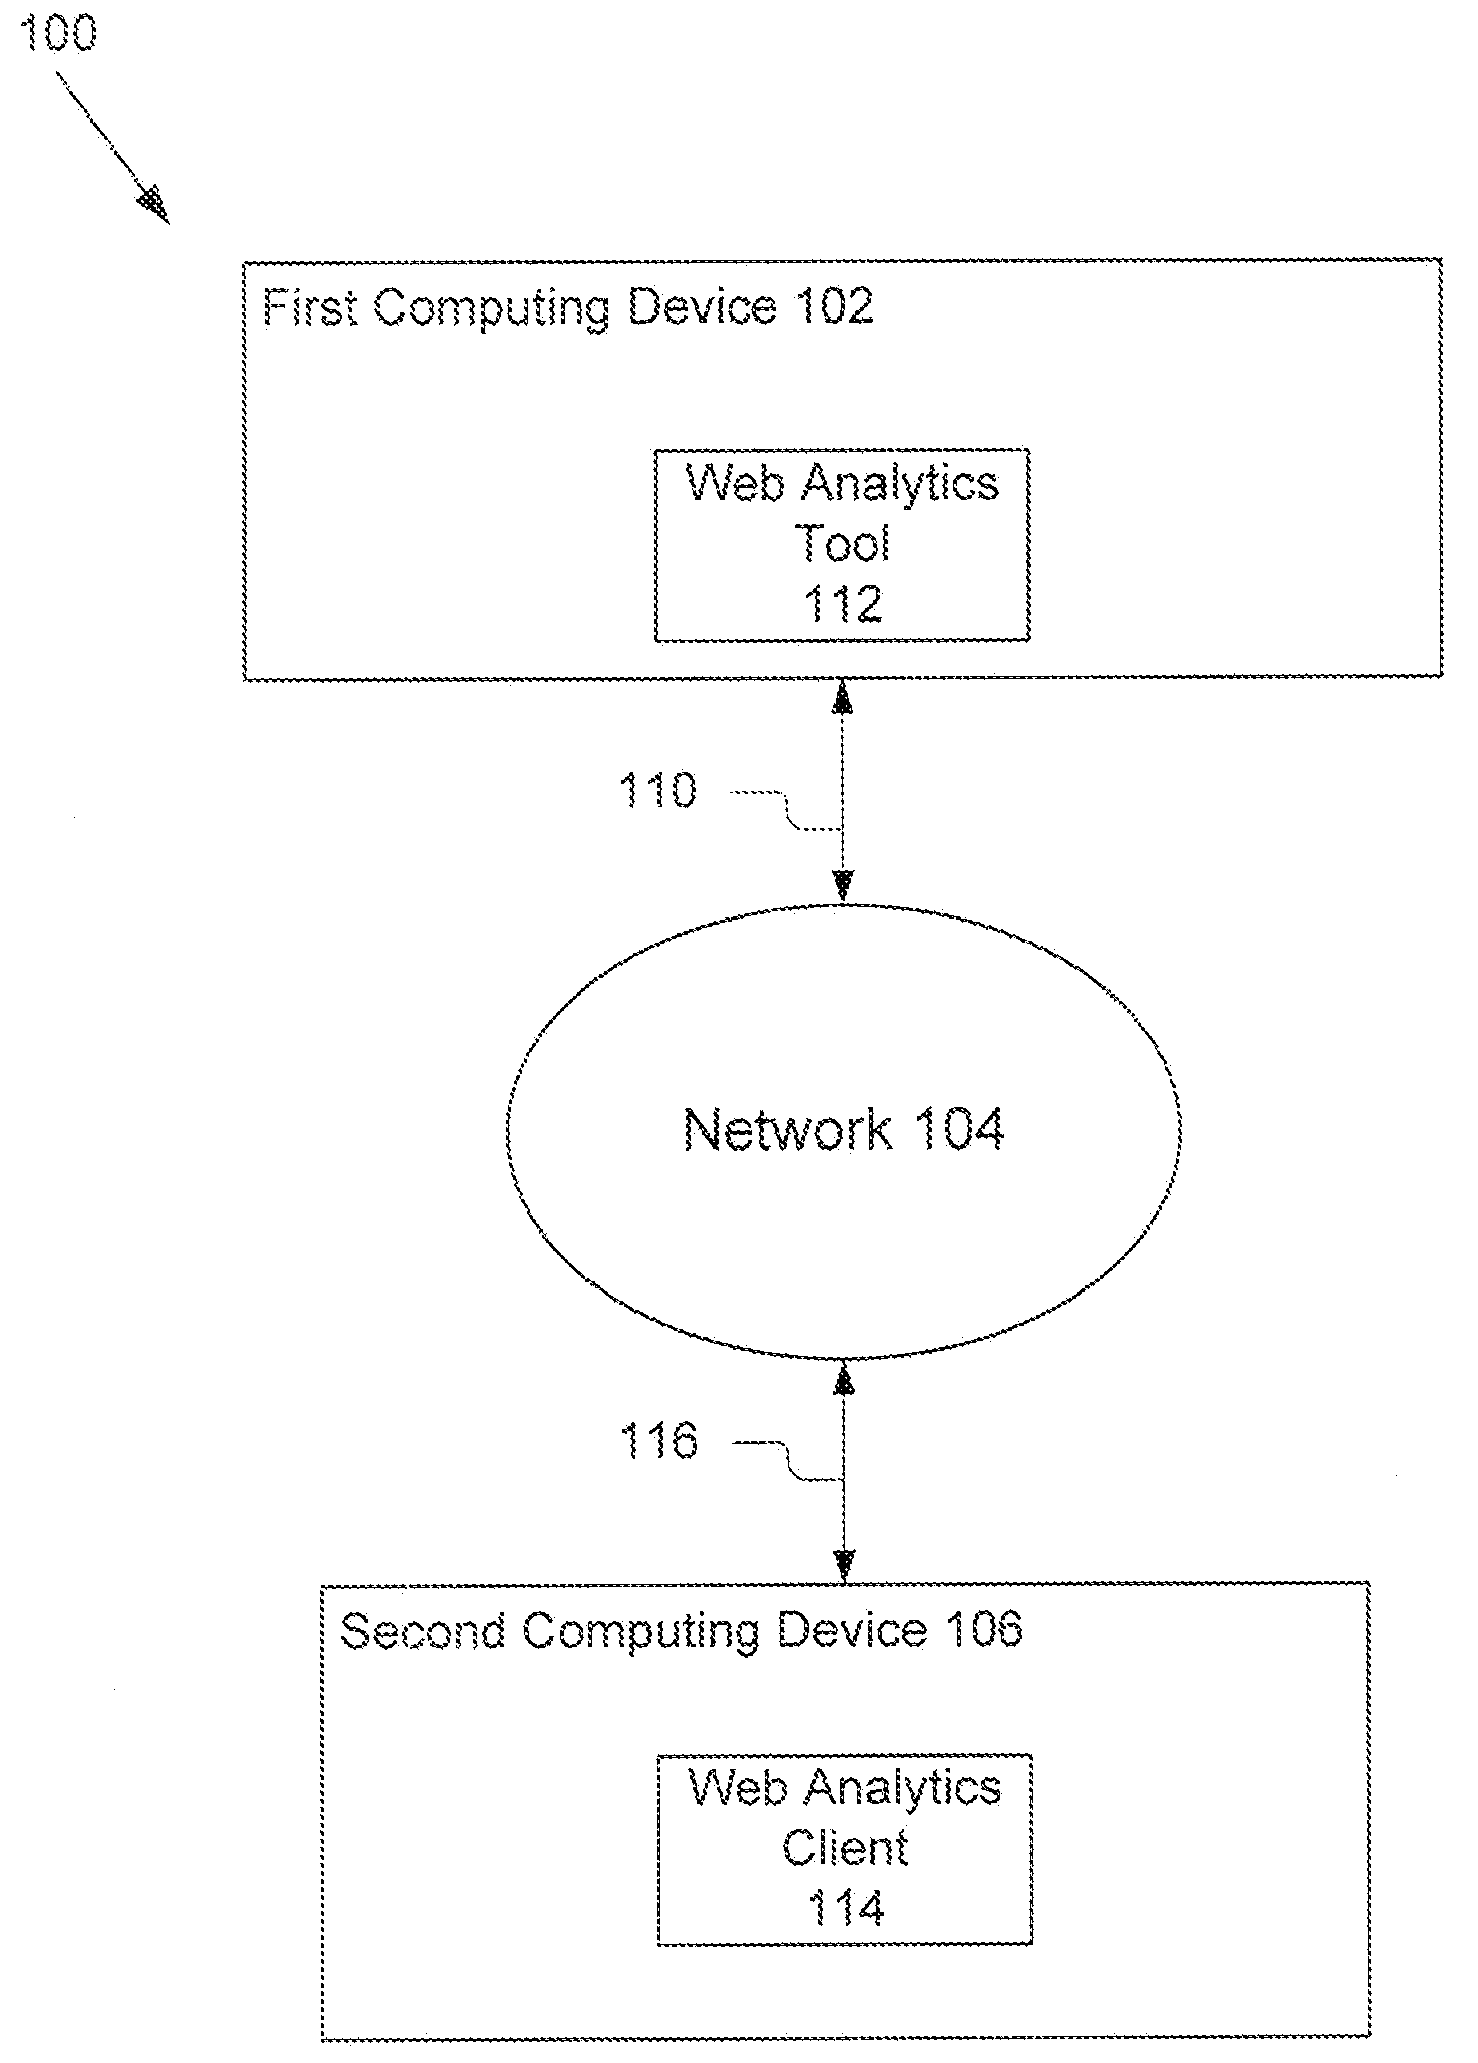
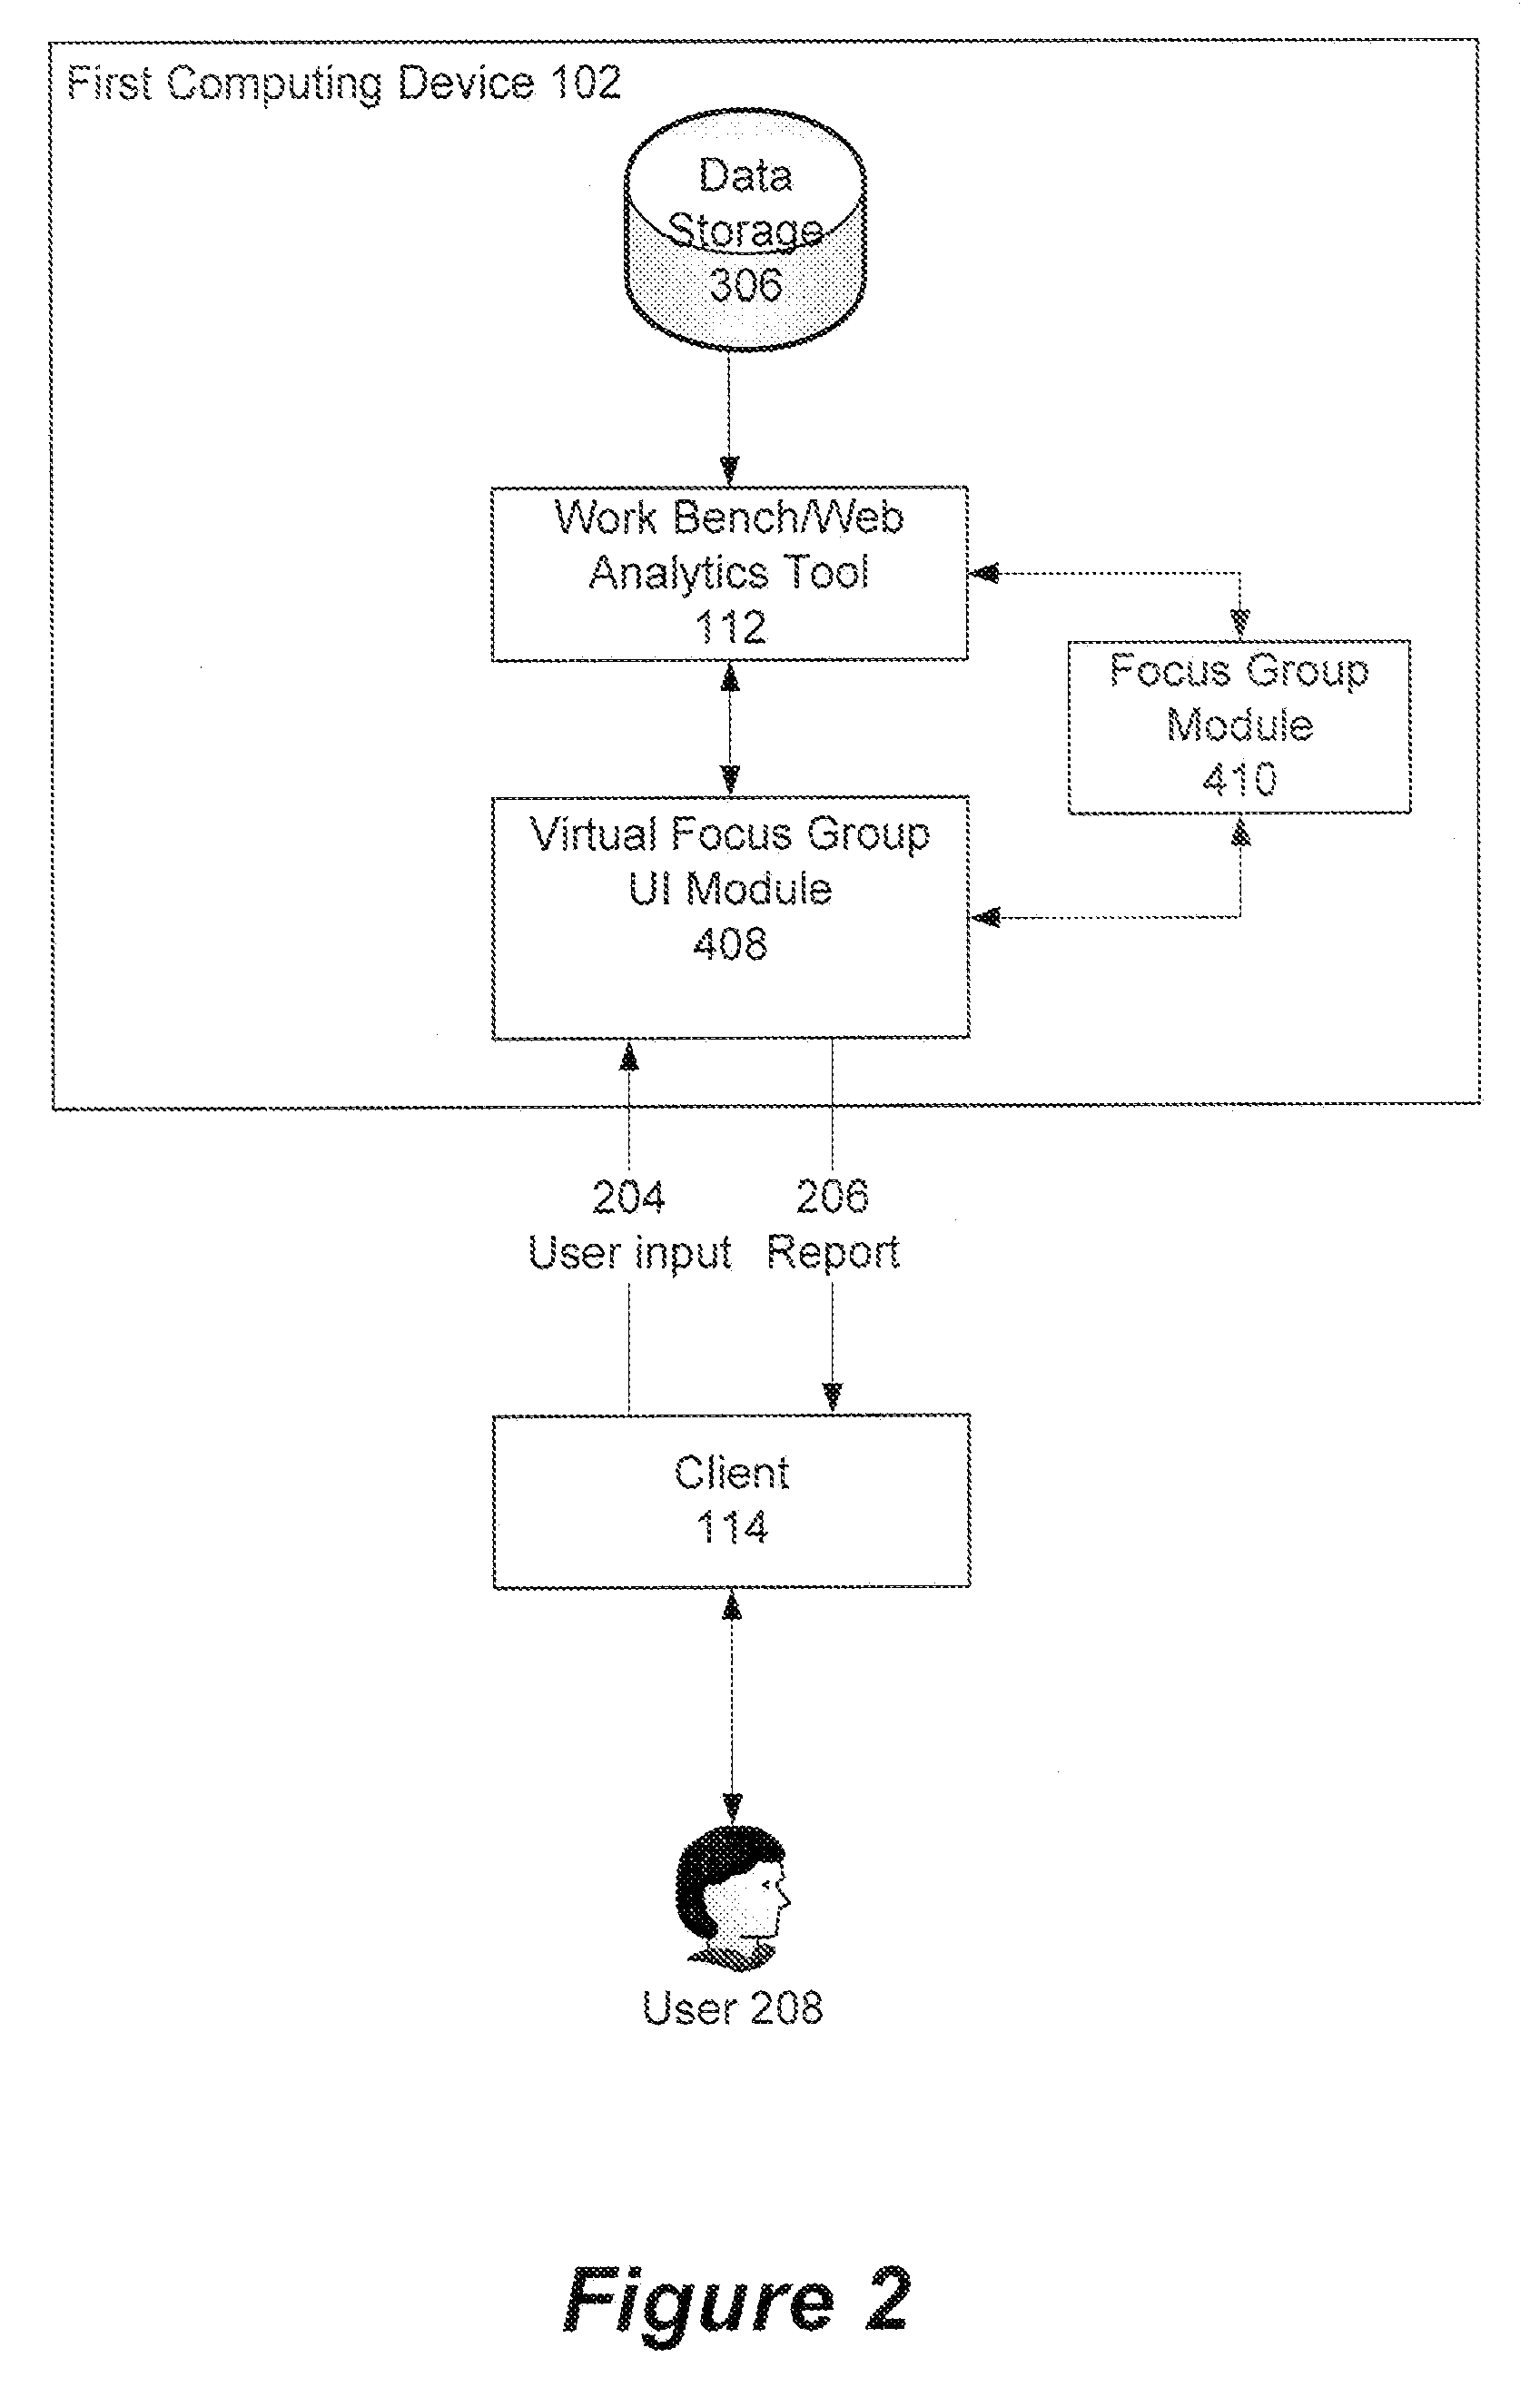
[0023]A system and methods for simulating a visitor experience for a particular individual over a plurality of websites are described. In this application, the terms visit, visitor, web page, hit, definitions know to those skilled art such as:

[0024]A Hit is a request for a file from the web server. Available only in log analysis. A single web-page typically consists of multiple (often dozens) of discreet files, each of which is counted as a hit as the page is downloaded, so the number of hits is really an arbitrary number more reflective of the complexity of individual pages on the website than the website's actual popularity. The total number of visitors or page views provides a more realistic and accurate assessment of popularity.

[0025]A Page View is a request for a file whose type is defined as a page in log analysis. An occurrence of the script being run in page tagging. In log analysis, a single page view may generate multiple hits as all the resources required to view the page...


PUM


Abstract

A system creates and shows a display that simulates the websites during a visit, the flow of the visit and the pace of the visit. The system includes a web analytics tool, a data storage, a focus group module and a virtual focus group user interface module. The focus group module interacts with the web analytics tool to extract information related to a particular visit by a visitor. The virtual focus group user interface module creates a user interface that presents a depiction of each website visited and displays those depictions to the user at a pace similar to the visitor's actual interaction with the websites. The user interface also includes input mechanisms to select a particular portion of the visit, modify the pace at which the depictions are presented, find similar visits, as well as other functionality.

Description

BACKGROUND OF THE INVENTION[0001]1. Field of the Invention[0002]This invention relates generally to systems and methods for web analytics. More particularly, the present invention is related to display of website visitation information and statistics, and specifically to a report that shows websites that were traversed by a user and simulate the visitation experience.[0003]2. Description of the Related Art[0004]Web analytics refers to the analysis of data created by website usage. For instance, web analytics can be used to mine visitor traffic data. A variety of visitor traffic data is measured such as what browser is being used, what links on a given web page were selected, whether a product was purchase, etc. There are number of web analytics tools presently available such as Site Catalyst version 11 from Omniture of Orem, Utah. These tools are able to capture data on website usage, and responsive to a user's request display a variety of different metrics on website usage such fal...

Claims


Application Information

Patent Timeline
IPC IPC(8): G06F3/01
CPCG06F11/3612G06F17/30876G06F17/30056G06F11/3664G06F16/4393G06F16/955
Inventor ERROR, CHRISTOPHER R.
Owner ADOBE INC
Why Eureka
Try Eureka