Method of Visualizing Modifications of a Hierarchical State Diagram

a state diagram and hierarchical representation technology, applied in the field of hierarchical representation of state diagrams, can solve the problems of difficulty in understanding the difference between a second version diagram and the original diagram, design does not capture the commonality, and the difficulty of understanding the modification of the model increases with complexity

Inactive Publication Date: 2008-11-20
IBM CORP
View PDF11 Cites 47 Cited by
  • Summary
  • Abstract
  • Description
  • Claims
  • Application Information

AI Technical Summary

Problems solved by technology

The design does not capture the commonality that exists among states.
However, because the diagram is stored according to internal data transcription, it is difficult to understand the difference between a second version diagram and the

Method used


Image

  • Method of Visualizing Modifications of a Hierarchical State Diagram
  • Method of Visualizing Modifications of a Hierarchical State Diagram
  • Method of Visualizing Modifications of a Hierarchical State Diagram

Examples


Embodiment Construction

Overview

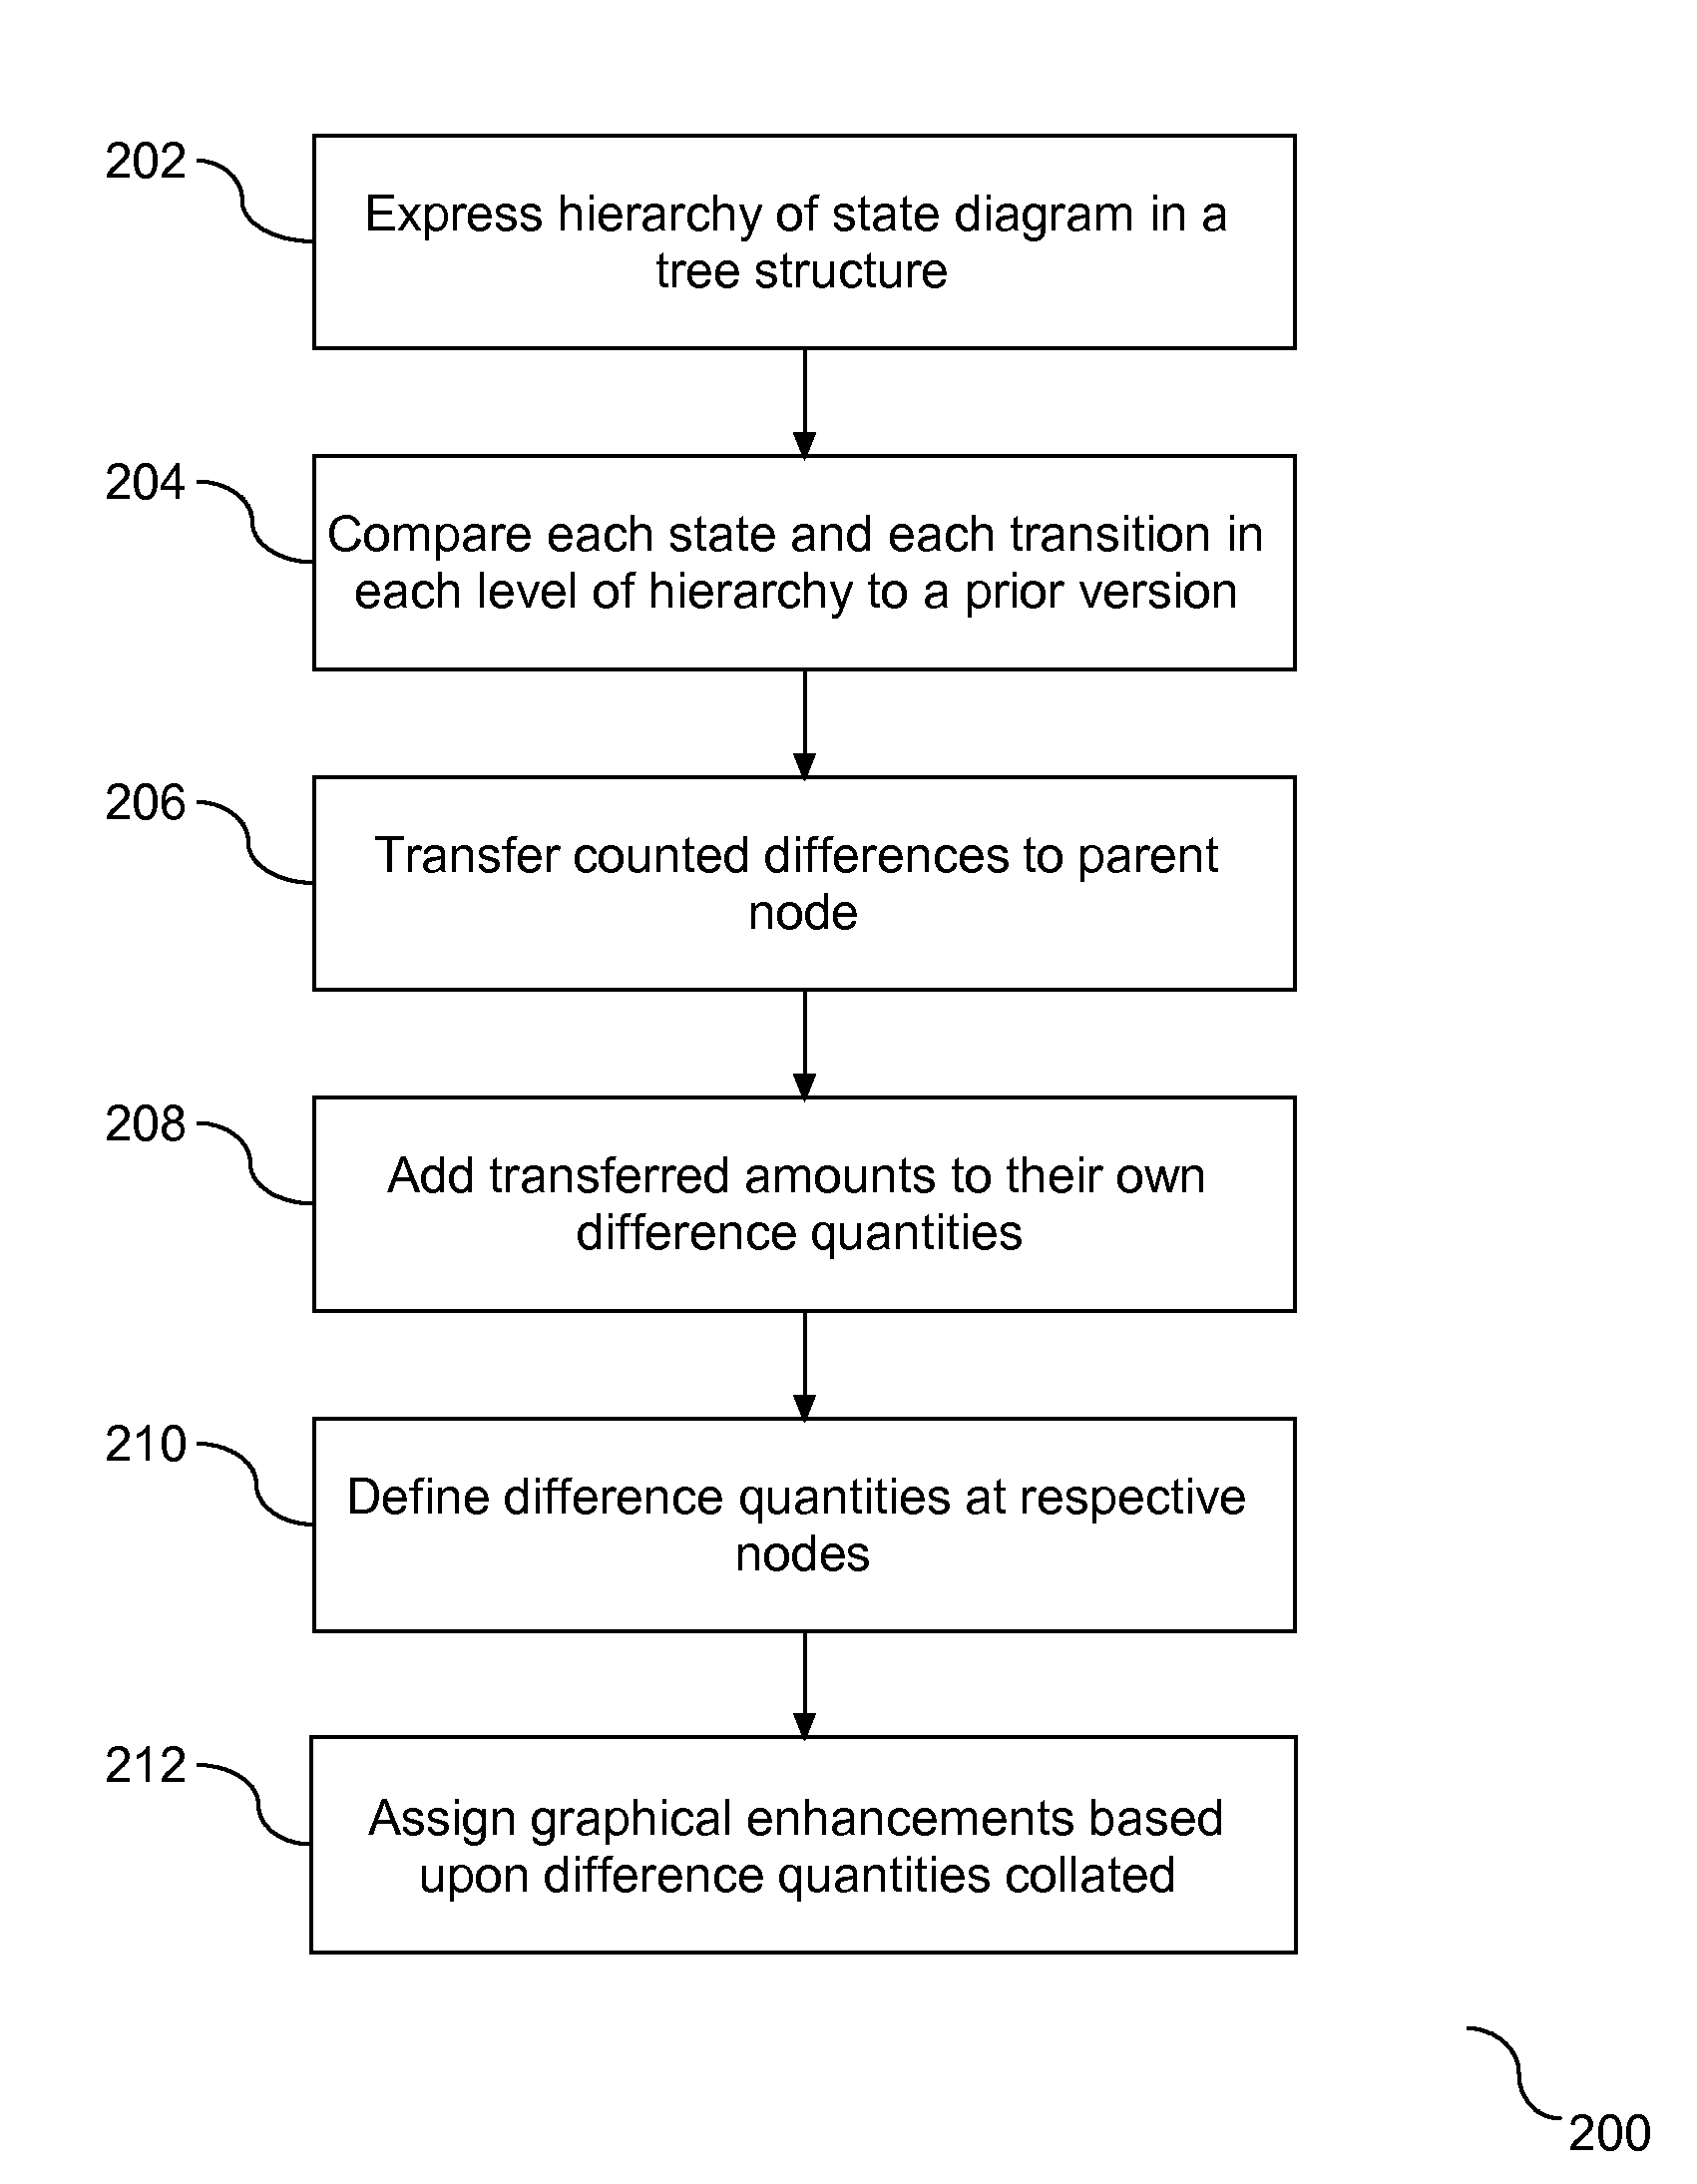
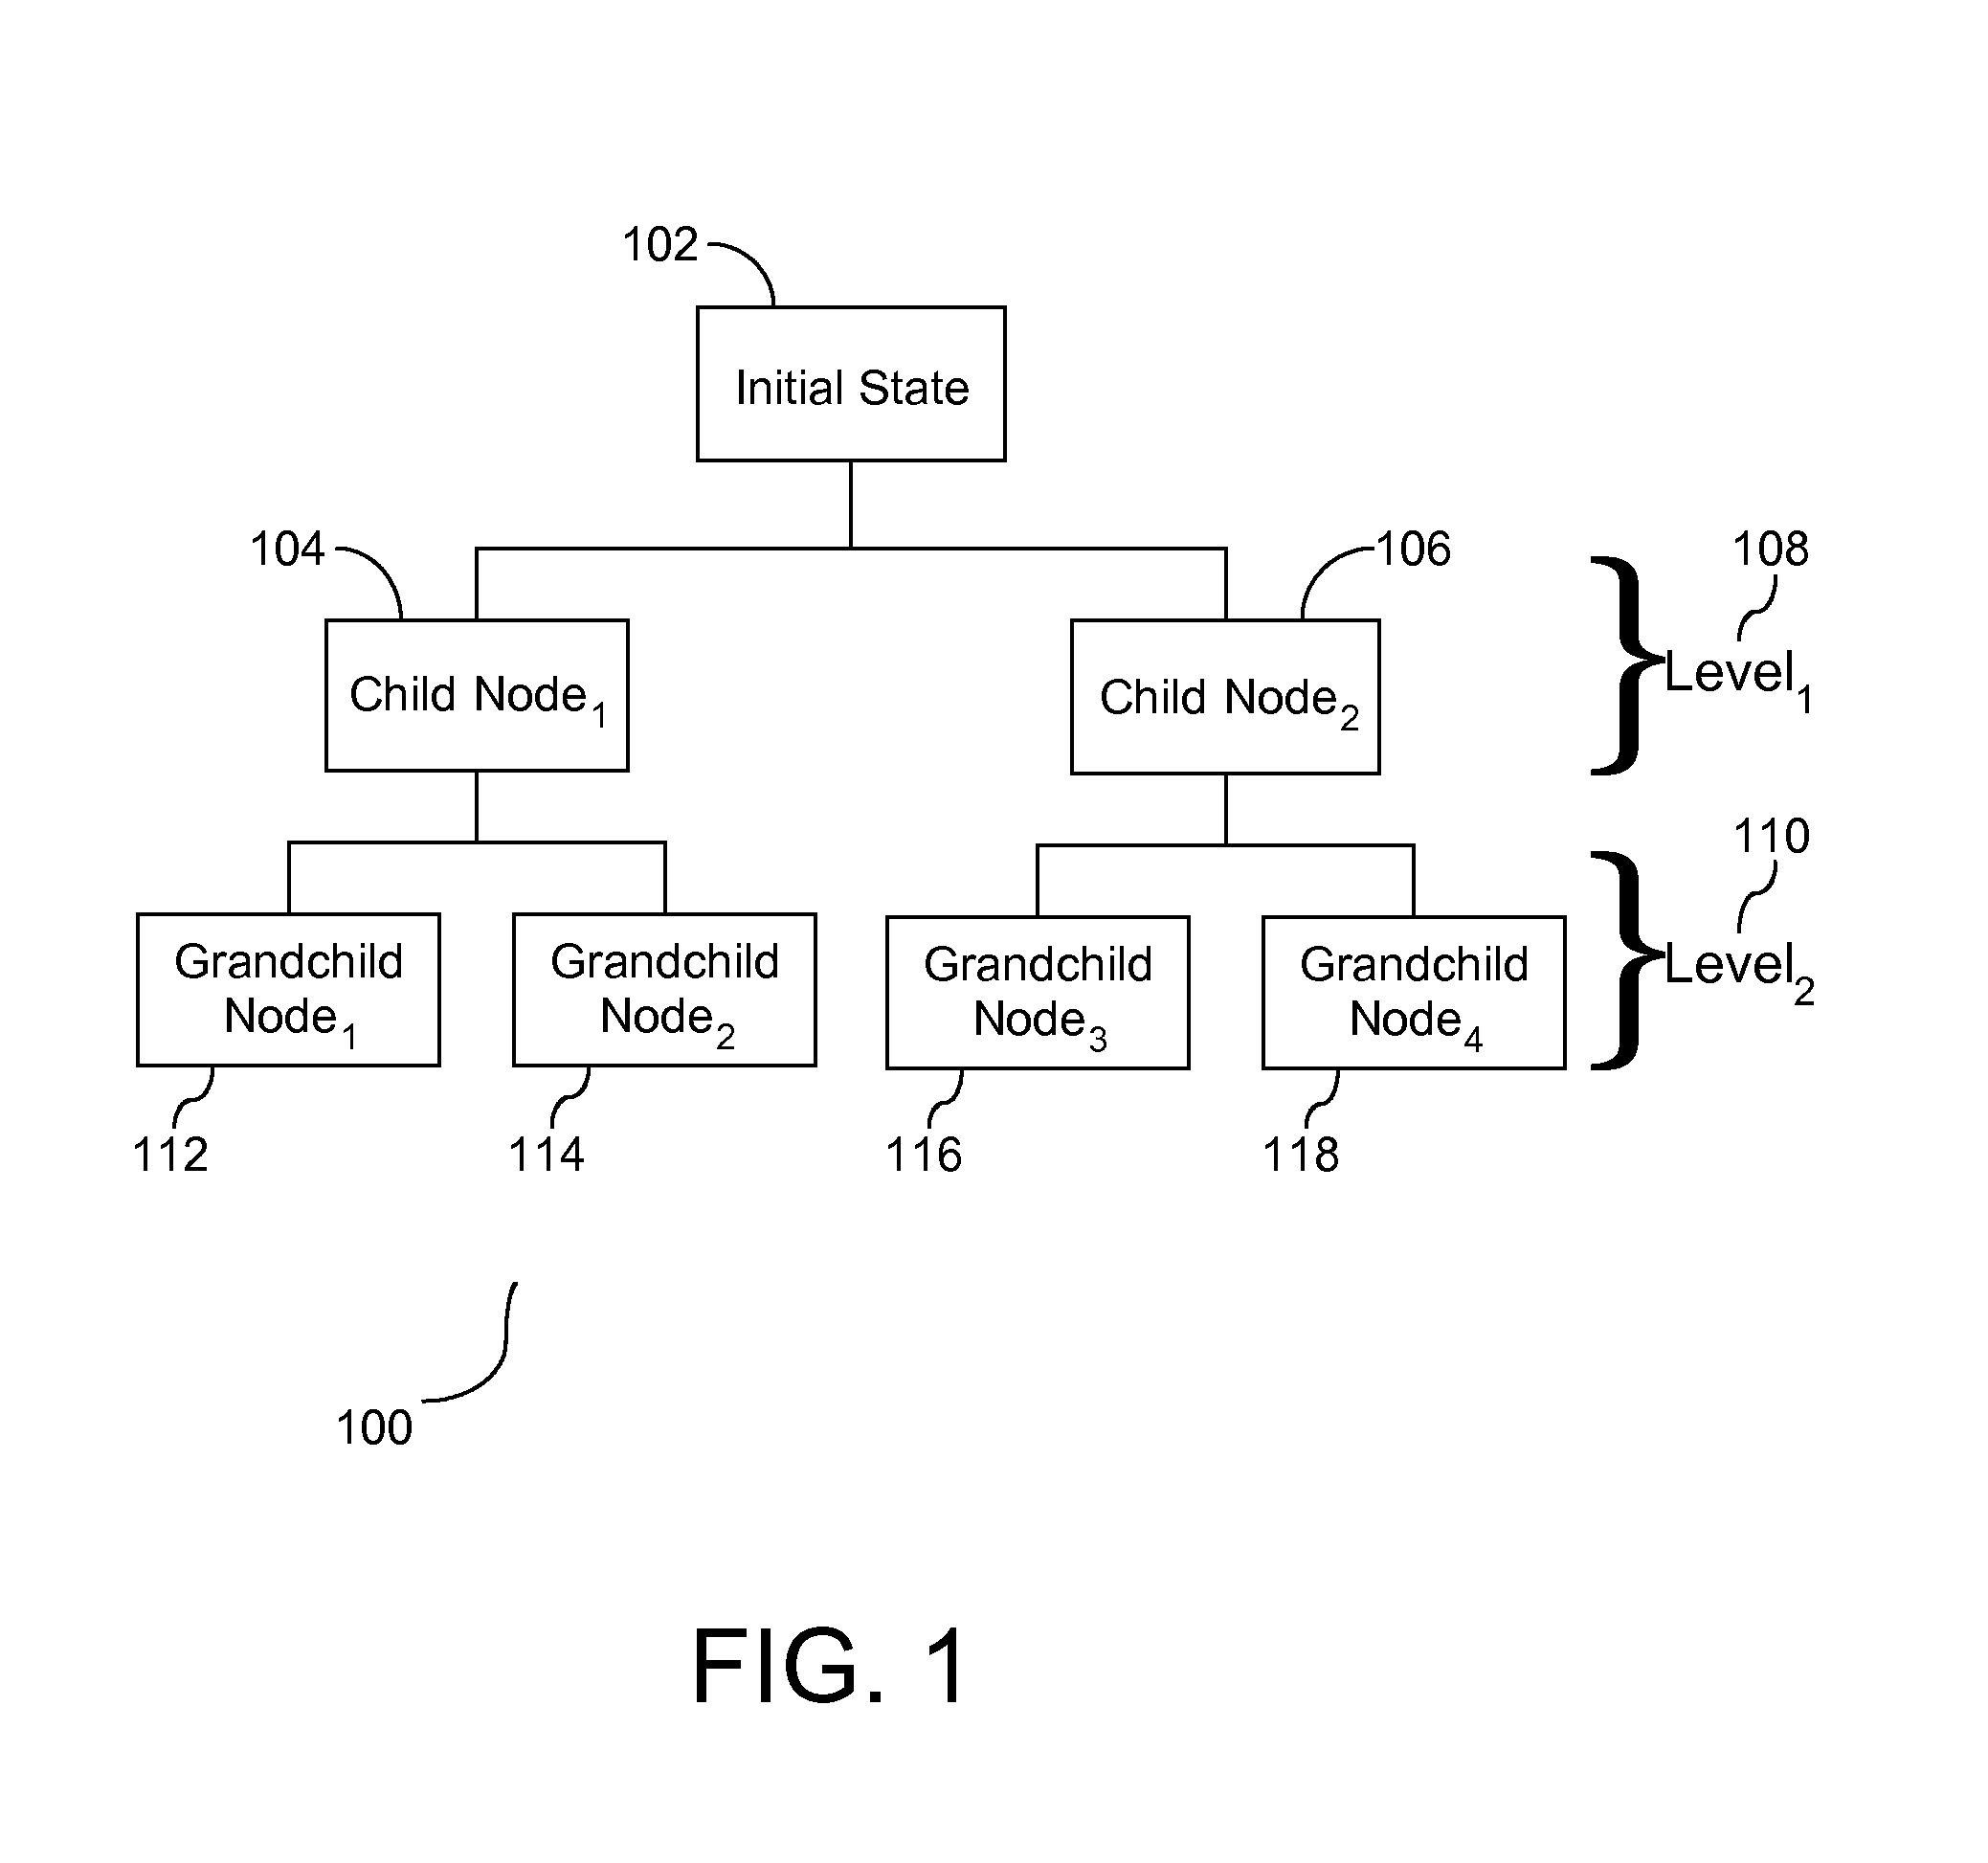
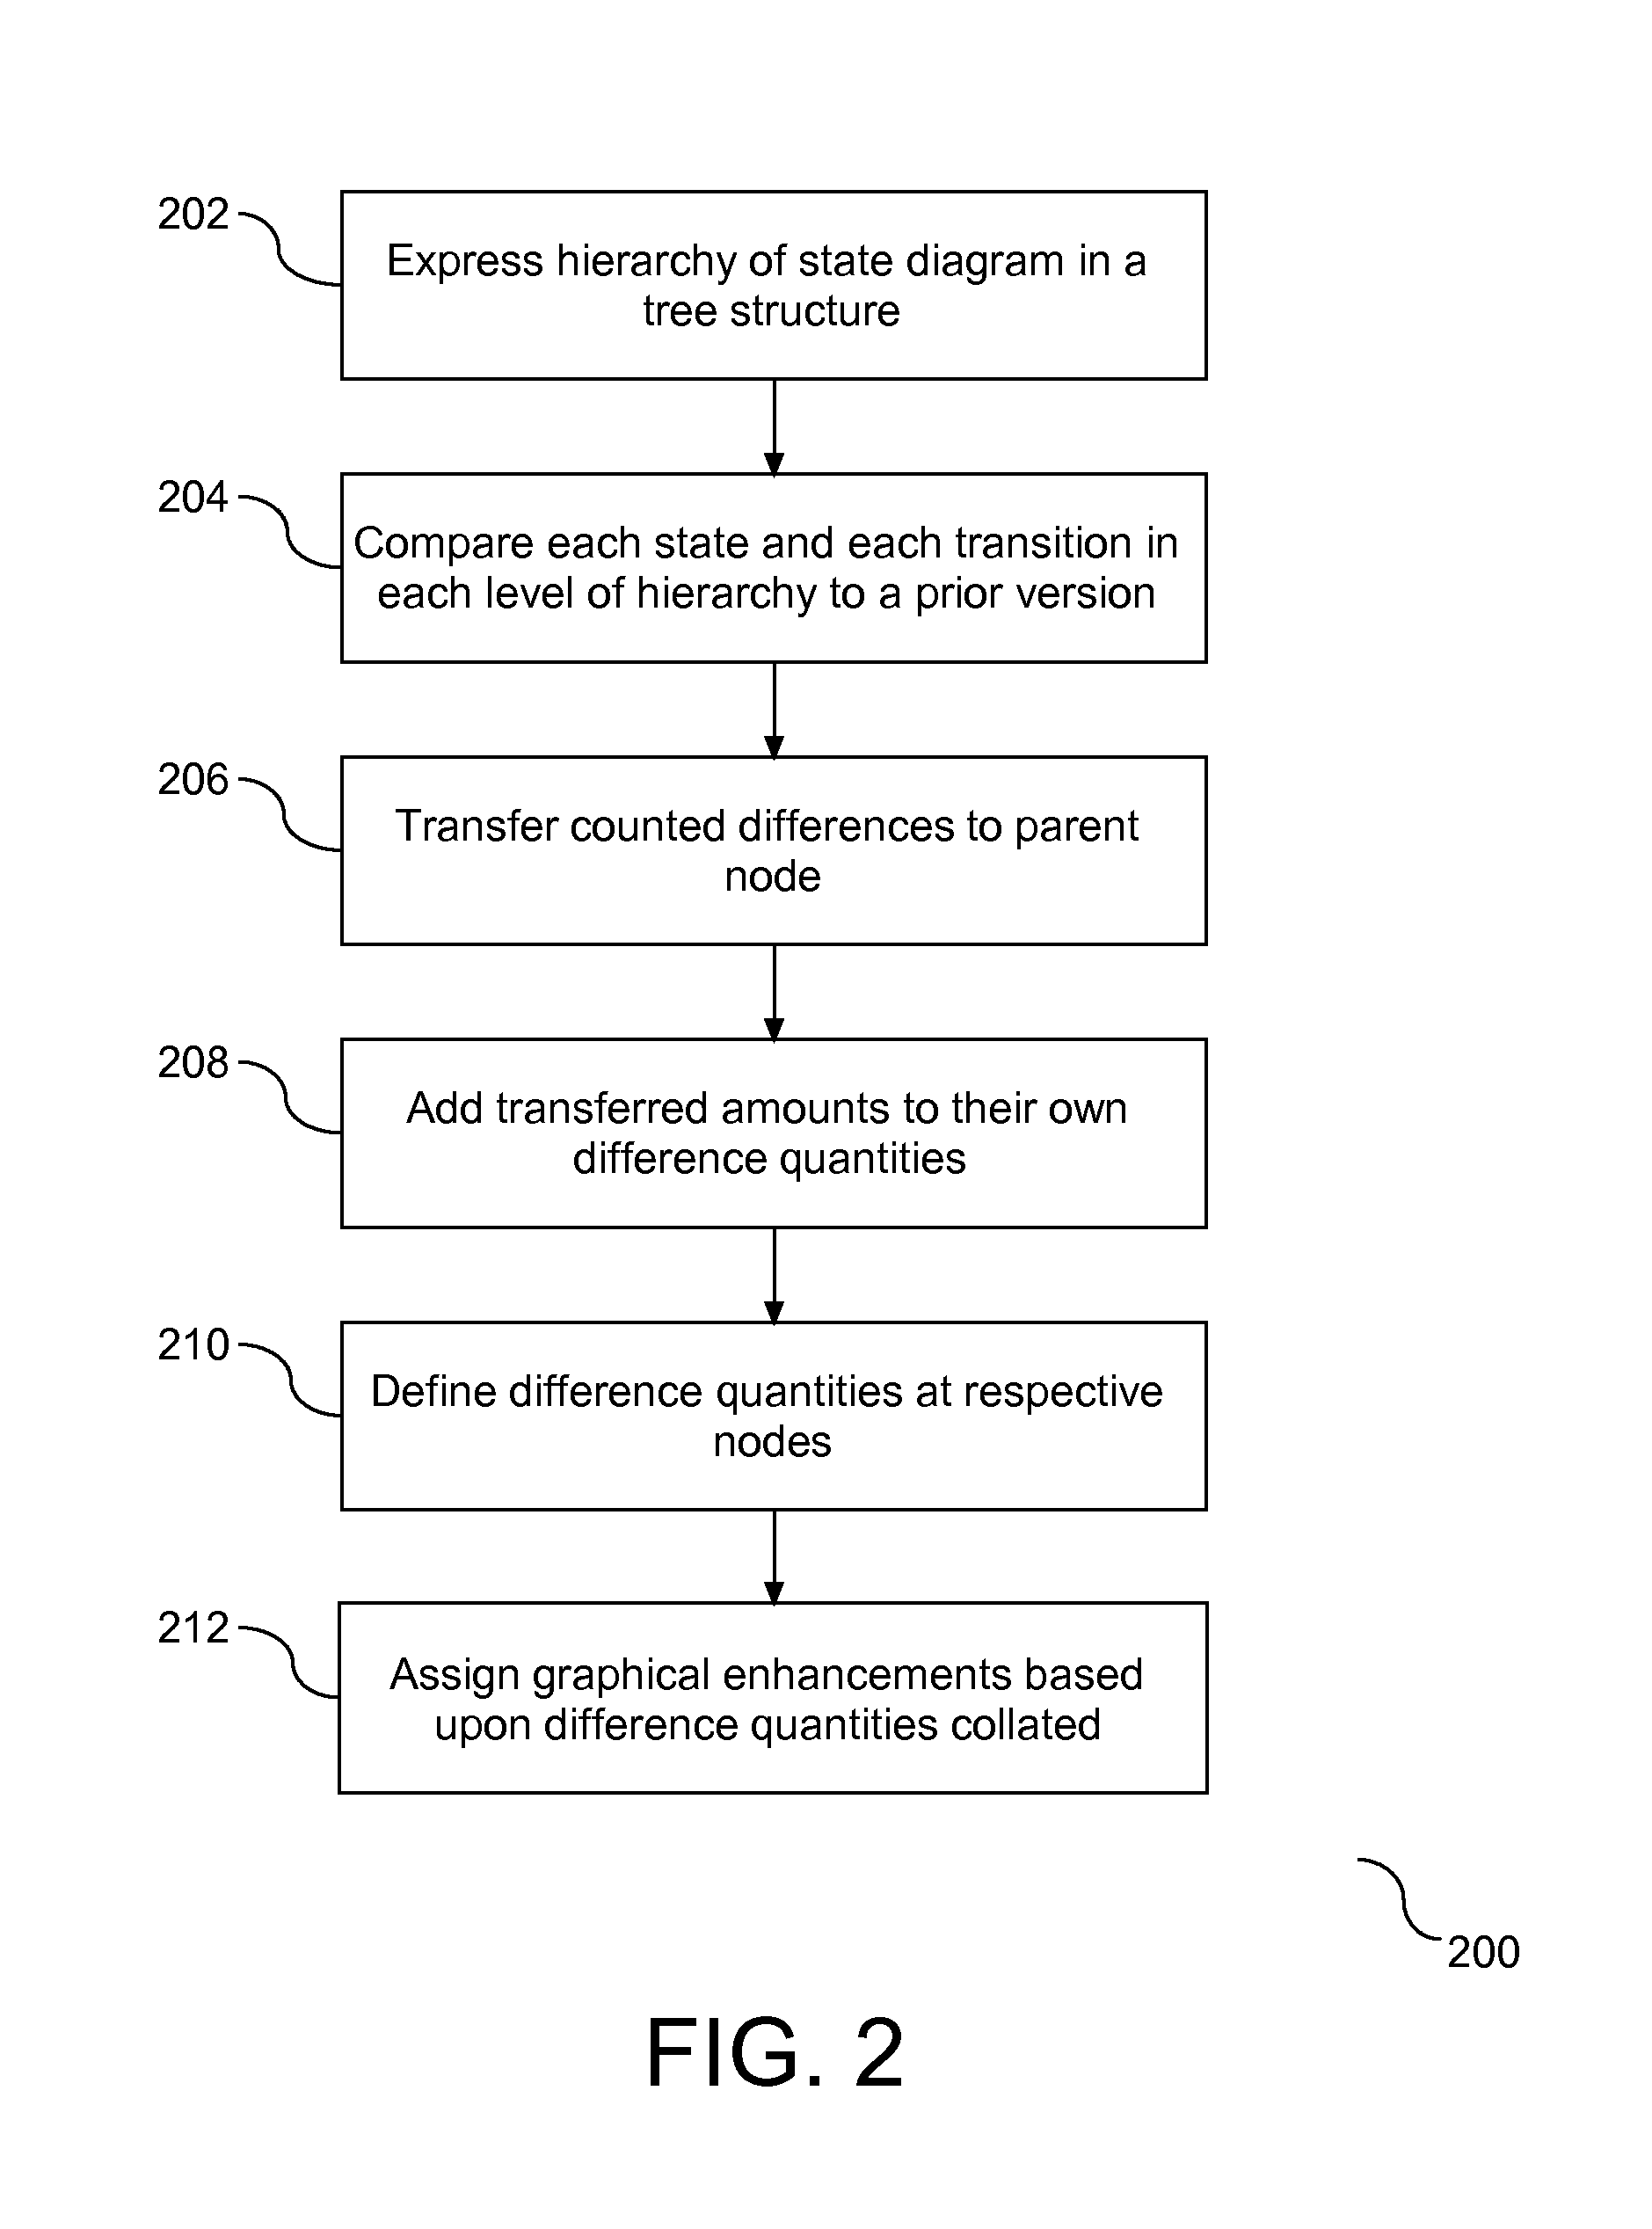
[0021]State diagrams have basic elements that include a rounded box representing the state of the object and arrows indicating the transition to the next state. An activity section of a state depicts what activities the object will be doing while it is in that state. All state diagrams begin with an initial state of the object. This is the state of the object when it is created. After the initial state, the object begins changing states. A hierarchical state diagram is represented in a tree structure with a parent level and one or more child levels. In a hierarchical state diagrams, the initial state is the parent node of a tree structure and the child nodes represent secondary states, i.e. a transition state or a final state. Conditions based on activities determine the next state to be represented in the diagram, i.e. the state the object transitions to. It is accepted in the art that a modeled state diagram may be modified over time. The modifications are accumulated at e...


PUM


Abstract

Hierarchical state diagrams are reflected in a tree structure with the initial state of the diagram represented as the parent node, intermediate states represented as intermediate levels of the hierarchy, and final states represented as the lowest level in the hierarchy. Information on the modification(s) on a child or subsequent level is transferred to the parent node. Such information includes quantifying and displaying of the modification(s). Accordingly, content and extent of any modifications to the diagram can be viewed at the parent node without requiring review of different levels in the hierarchy to view modifications to the state and/or transition in such levels.

Description

BACKGROUND OF THE INVENTION[0001]1. Technical Field[0002]This invention relates to a hierarchical representation of a state diagram. More specifically, the invention relates to graphically presenting modifications to the hierarchical state diagram in a manner that transfers across the hierarchical layers therein.[0003]2. Description of the Prior Art[0004]State diagrams are used to graphically represent finite state machines. One form of a state diagram for a finite state machine is a directed graph. Another form of the state diagram is represented through the unified modeling language (UML), i.e. a modeling language in which the state diagram includes standardized notation that can describe computer programs, business processes, etc. Basic notational elements that make up a diagram include the following: a filled circle pointing to the initial state, a hollow circle containing a smaller filled circle indicating the final state, a rounded rectangle denoting a state, an arrow denoting...

Claims


Application Information

Patent Timeline
IPC IPC(8): G06F9/44
CPCG06F8/34
Inventor TAZOE, EIICHIMATSUZAKI, TSUYOSHIOHTANI, MUNETAKA
Owner IBM CORP
Why Eureka
Try Eureka