Visualization of stress level cardiac functional analysis results

a cardiac functional analysis and multi-stress technology, applied in the field of visualizing medical image data, can solve the problems of user's inability to easily numerically compare local myocardial contractions at different stress levels, tedious and time-consuming tasks, etc., and achieve the effect of easy numerical comparison

Inactive Publication Date: 2010-01-28
KONINKLIJKE PHILIPS ELECTRONICS NV
View PDF5 Cites 7 Cited by
  • Summary
  • Abstract
  • Description
  • Claims
  • Application Information

AI Technical Summary

Benefits of technology

[0003]It would be advantageous to visualize multiple stress level cardiac functional analysis results in a way that allows easy numerical comparison of local myocardial contractions at different stress levels.

Problems solved by technology

A shortcoming of this approach to visualizing multiple stress level cardiac functional analysis results is that the user cannot easily numerically compare local myocardial contractions at different stress levels.
This is a tedious and time-consuming task.

Method used


Image

  • Visualization of stress level cardiac functional analysis results
  • Visualization of stress level cardiac functional analysis results
  • Visualization of stress level cardiac functional analysis results

Examples


Embodiment Construction

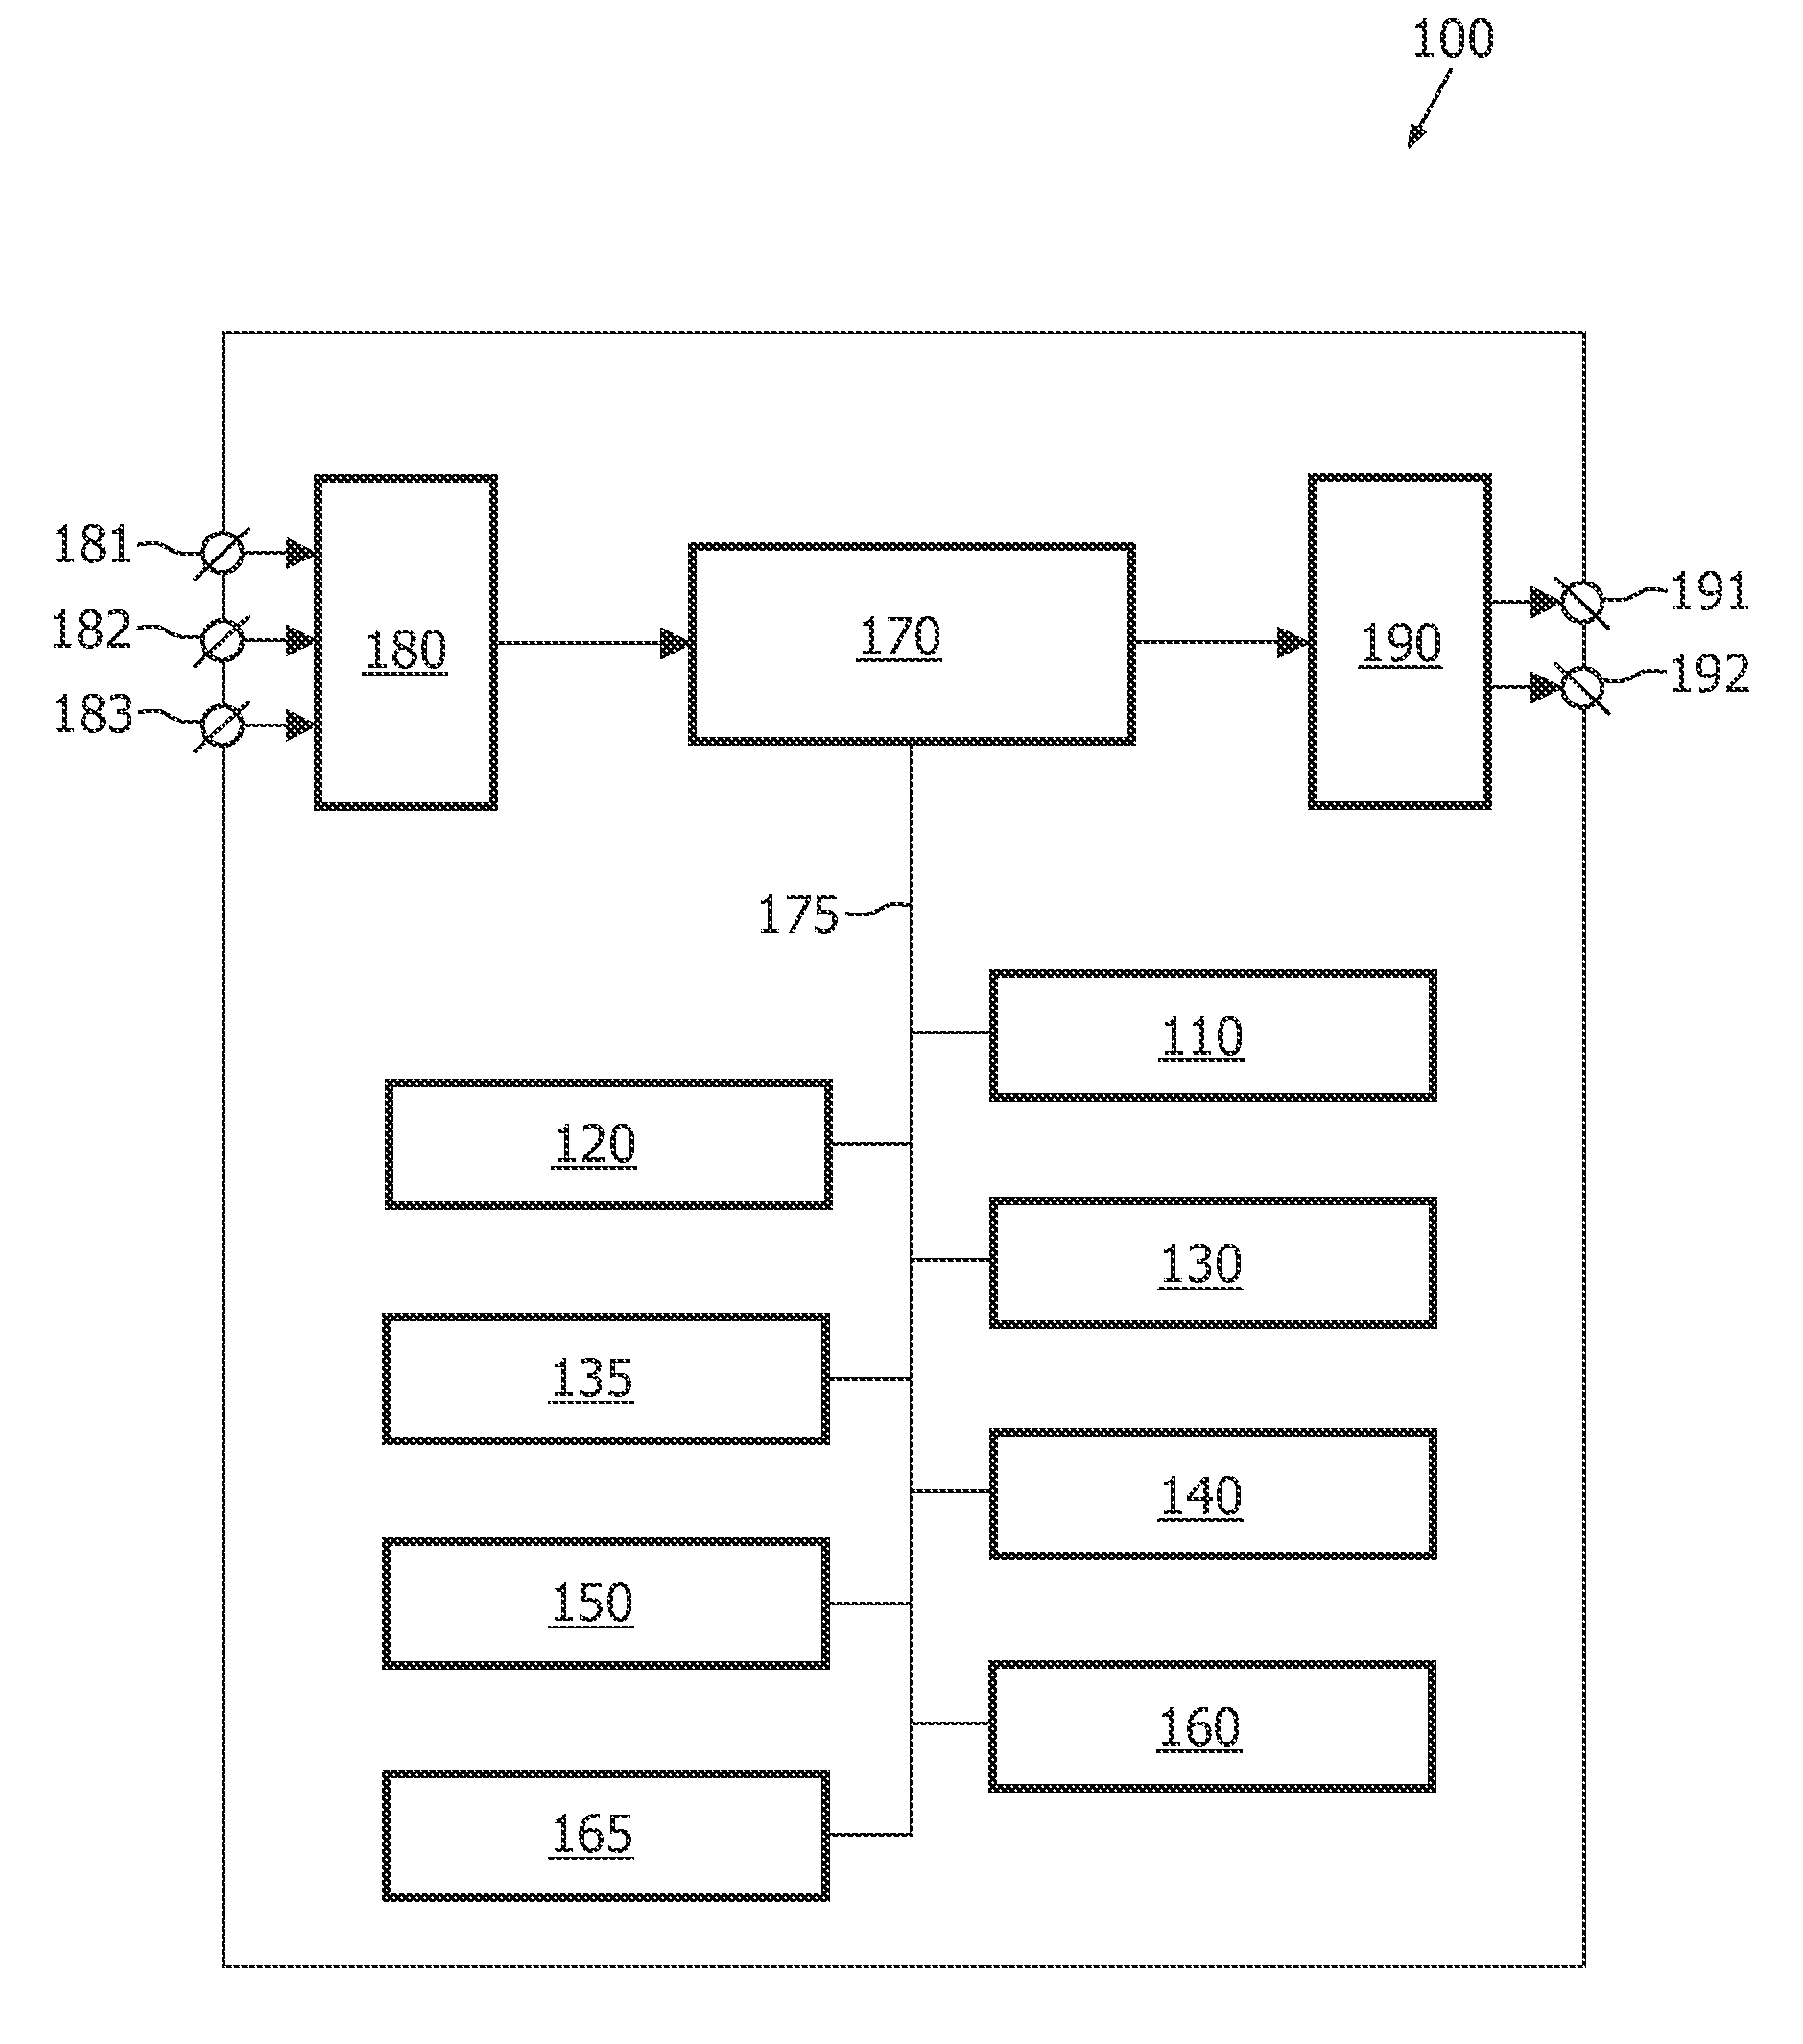
[0047]FIG. 1 schematically shows a block diagram of an exemplary embodiment of the system 100 for visualizing a cardiac parameter at a plurality of positions in a myocardium and at a plurality of stress levels, the system 100 comprising:

[0048]a determination unit 110 for determining a value of the cardiac parameter at a position from the plurality of positions in the myocardium and at a stress level from the plurality of stress levels on the basis of stress level cardiac functional data; and

[0049]a visualization unit 120 for visualizing the determined value of the cardiac parameter by displaying a point in a viewing plane, where in a polar coordinate system in the viewing plane:

[0050]a radial coordinate of the point visualizes the determined value of the cardiac parameter; and

[0051]an angular coordinate of the point visualizes an angular coordinate of the position in the myocardium in a cylindrical coordinate system.

[0052]The exemplary embodiment of the system 100 further comprises ...


PUM


Abstract

The invention relates to a system (100) for visualizing a cardiac parameter at a plurality of positions in a myocardium and at a plurality of stress levels, the system comprising a determination unit parameter at a position from the plurality of positions in the myocardium and at a stress level from the plurality of stress levels on the basis of stress level cardiac functional data, and a visualization unit (120) for visualizing the determined value of the cardiac parameter by displaying a point in a viewing plane. The visualized points are defined by their polar coordinates in a polar coordinate system in the viewing plane. A radial coordinate of the point visualizes the determined value of the cardiac parameter. An angular coordinate of the point visualizes an angular coordinate of the position in the myocardium in a cylindrical coordinate system. Thus, the system allows easy numerical comparison of local myocardial contractions at different stress level values.

Description

FIELD OF THE INVENTION[0001]The invention relates to the field of visualization of medical image data and more specifically to the visualization of multiple stress level cardiac functional analysis results.BACKGROUND OF THE INVENTION[0002]Visualizing multiple stress level cardiac functional analysis results is described by M. Breeuwer in an article entitled “Quantification of atherosclerotic heart disease with cardiac MRI” in Medica Mundi, vol. 49 no. 2, pages 30-38, 2005, hereinafter referred to as Ref. 1. The article describes a number of parameters for quantifying a myocardial contractile function. For example, a parameter for quantifying the myocardial contraction may be wall thickening WT=((WES−WED) / WED) 100%, where WED is the wall thickness at end diastole and WES is the wall thickness at end systole. Wall thickening can be determined locally as a value at a position in the myocardium or as an average per myocardial segment. A standardized myocardial segmentation is described ...

Claims


Application Information

Patent Timeline
Patent Type & Authority Applications(United States)
IPC IPC(8): A61B5/02
CPCA61B5/1075A61B6/503G06F19/3406G06T7/0012G06T2207/30048G06T11/206G06T2200/24G06T2207/10072G06T7/20A61B5/742G16H40/63
Inventor BREEUWER, MARCEL
Owner KONINKLIJKE PHILIPS ELECTRONICS NV
Why Eureka
Try Eureka