Chronic population based cost model to compare effectiveness of preventive care programs

a cost model and population technology, applied in the field of chronic population based cost model to compare the effectiveness of preventive care programs, can solve the problems of distorted medical needs of populations beyond the limits of statistical extrapolation, inability of current healthcare cost models and inability to accurately predict the cost of next year. , to achieve the effect of accurate cost estimates, increased future costs, and worsening with time and cos

Inactive Publication Date: 2010-09-30
KURIYAN JACOB GEORGE
View PDF21 Cites 12 Cited by
  • Summary
  • Abstract
  • Description
  • Claims
  • Application Information

AI Technical Summary

Benefits of technology

[0022]Because chronic illness has no cure, passage of time in the model is represented by patients in one health state staying put or transitioning to another health state that represents a more severe chronic condition and incurring greater costs.

Problems solved by technology

But the spread and prevalence of chronic illness and cancer have distorted the medical needs of populations beyond the limits of statistical extrapolations.
In analyzing the medical claims data of an employee population it became obvious that it wasn't aging that caused the rise in medical needs but aging in an unhealthy fashion.
In other words, many employees became chronically ill with diseases like hypertension and diabetes and at an early stage these diseases tend to get neglected because there is no pain nor any overt signs of problems.
In time the disease festers, causing many complications and they are mistakenly attributed to aging.
The primary one has to do with the inability of current healthcare cost models to predict next year's costs accurately based solely on statistical factors.
In other words, while the model does not predict which enrollees will develop a chronic condition or complications, once identified by the diagnosis code in the claim as belonging to a specific health state then the annual medical cost for the new health state is known.

Method used


Image

  • Chronic population based cost model to compare effectiveness of preventive care programs
  • Chronic population based cost model to compare effectiveness of preventive care programs
  • Chronic population based cost model to compare effectiveness of preventive care programs

Examples


Embodiment Construction

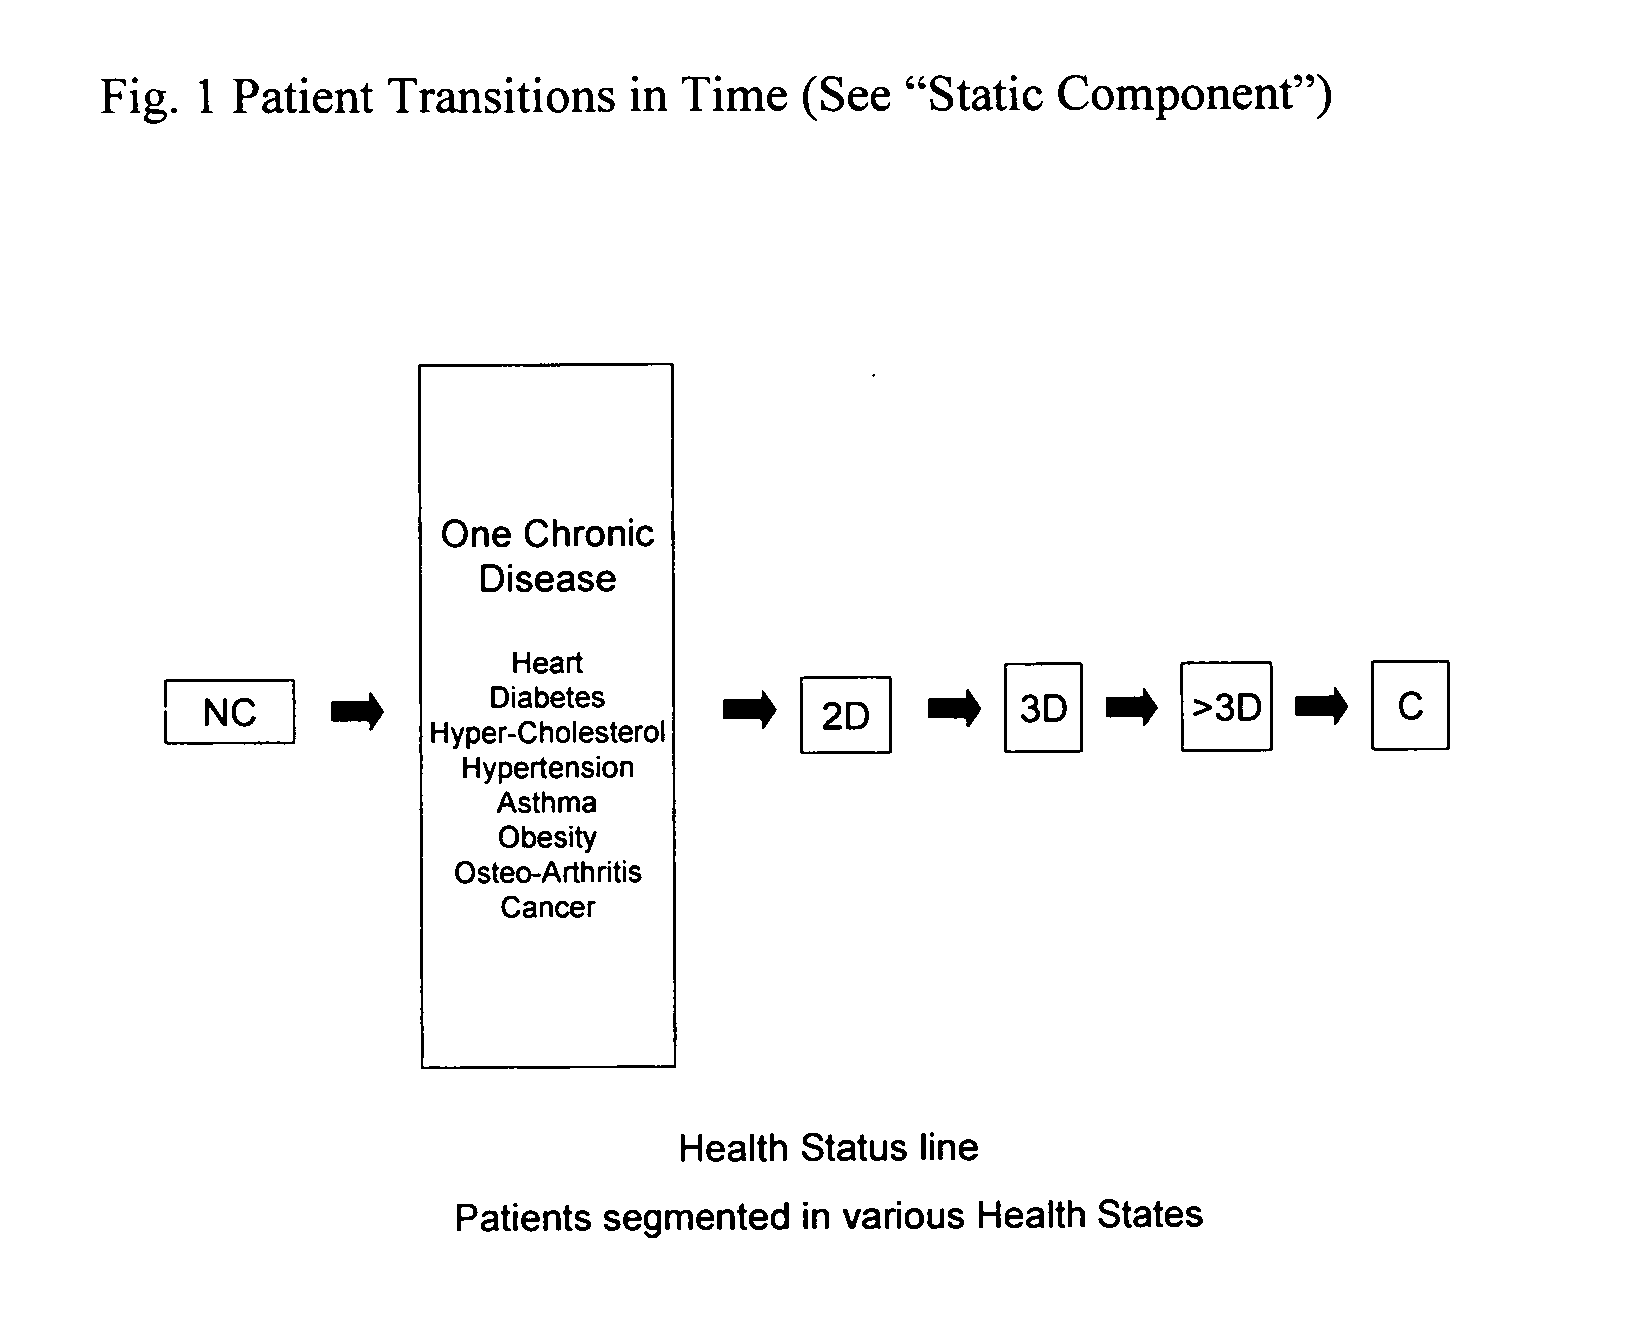
” as Static Component. The population is divided into various health segments, Non Chronic, 1 Disease, 2 Disease etc. and arranged from left to right. This figure then describes the typical temporal development of a population, from left to right. For example, non-chronic patients, over a period of time can develop one or more chronic diseases, and move to the right in the figure, to any of the health segments. Because there is no cure for chronic disease, the re is never a movement from right to left in the figure. Also, transitions to “C” (cancer) are allowed from any of the states defined in FIG. 1 above. As stated in the text, cancer costs are so large that it belongs in a special category.

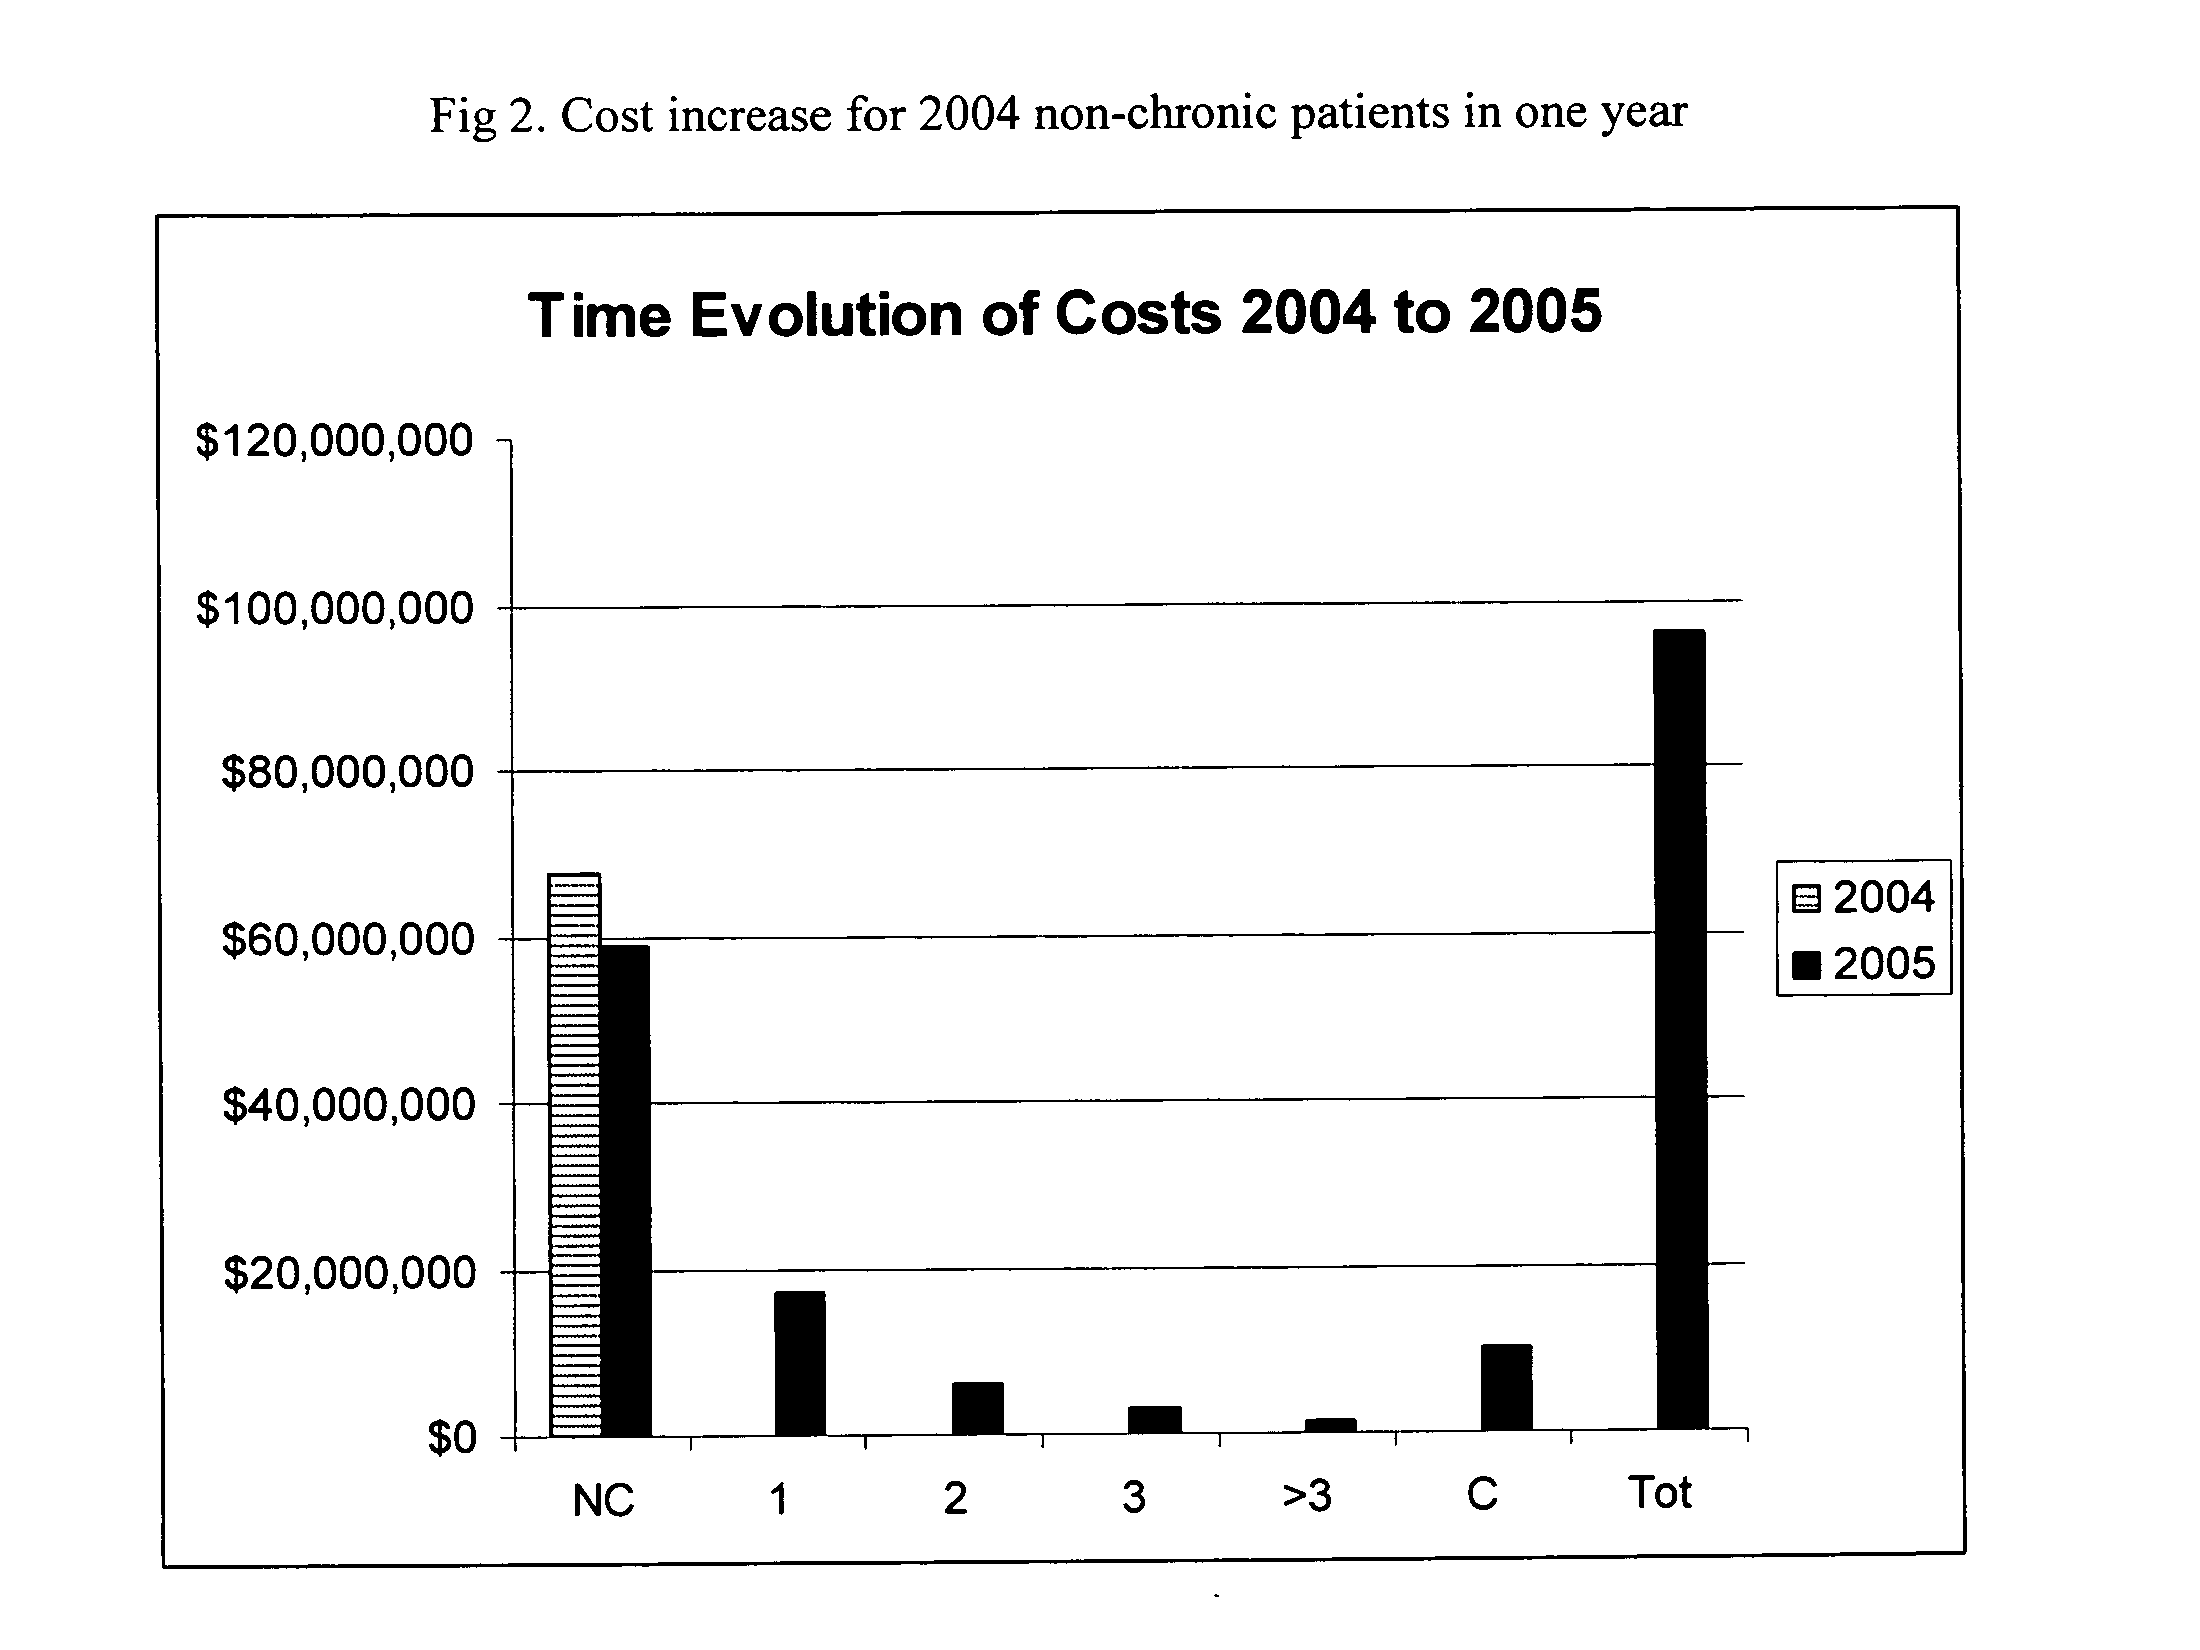
[0038]FIG. 2. Cost increase for 2004 non-chronic patients in one year

[0039]Explanatory note to FIG. 2:

[0040]In this example, about 55,000 non chronic patients in 2004 incurred costs of about $67.5 million. During the following year, many non chronic patients remained in the same health segment...


PUM


Abstract

Our invention is a cost model for healthcare, based not on “age”, as it is done currently, but on “chronic illness” as a risk factor. Using the model it is possible to derive two burden numbers, “Primary” and “Secondary” that is an inverse measure of the success of primary and secondary preventive care programs. Using this new metric, a better explanation for cost increases is possible. It can help estimate increases more accurately and make explicit suggestions on where the focus of attention should be to lowering costs. Trendlines of the metric can measure performance of care programs month by month and not have to wait a decade to yield perceptible results.A particular embodiment of this model is the software program described in this application, called HealthKeys, which serves as a decision support system for CFOs of companies and healthplans to help institute relevant preventive care programs and measure the success of them. HealthKeys is one example of a “useful, concrete and tangible result” that is based on our invention of a new cost model.

Description

CROSS-REFERENCES TO RELATED APPLICATIONS[0001]The application claims the priority of U.S. Provisional Application Ser. No. 61164929 entitled “A cost model for US Healthcare based on a chronic population based delivery system” filed on 31 Mar. 2009, the entire contents and substance of which are hereby incorporated in total by reference.SEQUENCE LISTING[0002]Not applicable.STATEMENT REGARDING FEDERALLY SPONSORED RESEARCH OR DEVELOPMENT[0003]Not applicable.[0004]The Names of the Parties to a Joint Research Agreement[0005]Not applicable.[0006]Reference to a Sequence Listing, a Table or Computer Program[0007]Not applicable.BACKGROUND OF THE INVENTION[0008](1) Field of the Invention[0009]This invention relates to a method of comparing the effectiveness of preventive care programs for chronic patients using a metric for performance that can then be illustrated via the use of a “Preventive Care Atlas™” and scatter plots of care performance and Costs. More specifically this invention relate...

Claims


Application Information

Patent Timeline
Patent Type & Authority Applications(United States)
IPC IPC(8): G06Q50/00G06Q90/00G06Q10/00
CPCG06F19/328G06F19/3431G06F19/3437G06Q50/22G06Q99/00G06Q10/04G16H50/20G16H50/30G16H70/40G16H50/50
Inventor KURIYAN, JACOB GEORGE
Owner KURIYAN JACOB GEORGE
Why Eureka
Try Eureka