
Identification of aberrant measurements of in vivo glucose concentration using temperature

Inactive Publication Date: 2011-06-23
MEDTRONIC MIMIMED INC
View PDF100 Cites 40 Cited by
  • Summary
  • Abstract
  • Description
  • Claims
  • Application Information

AI Technical Summary

Benefits of technology

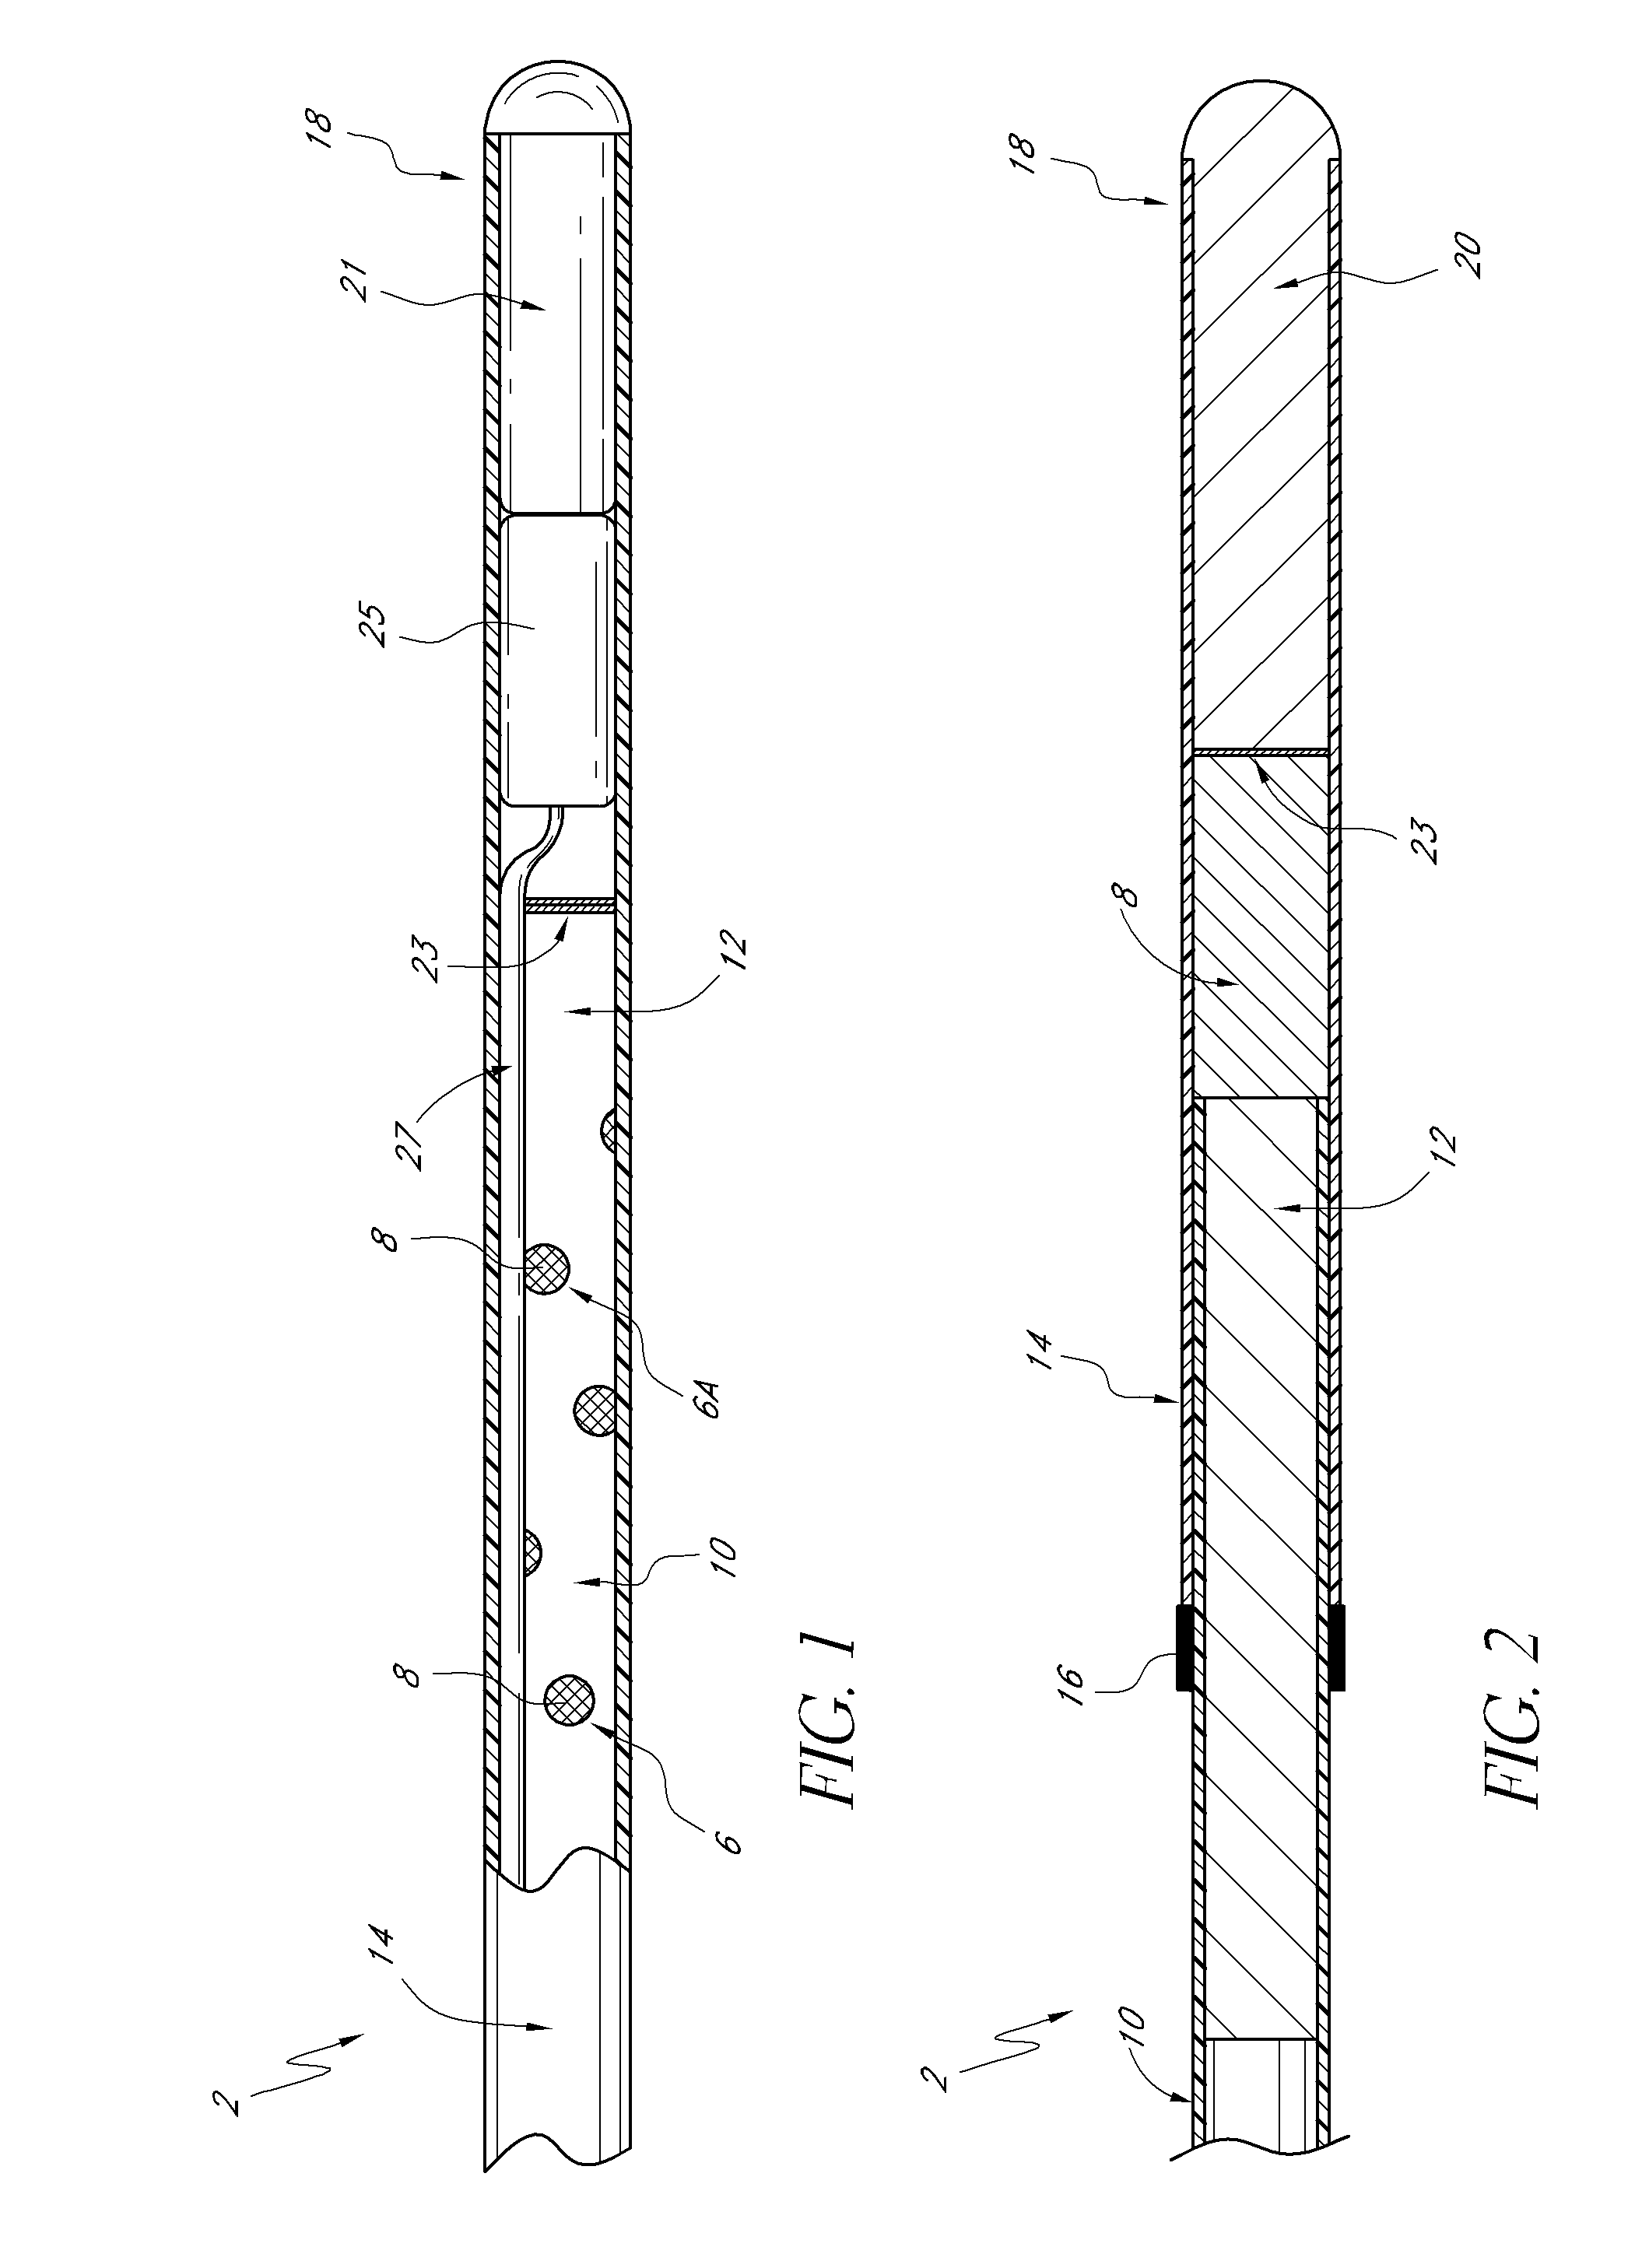
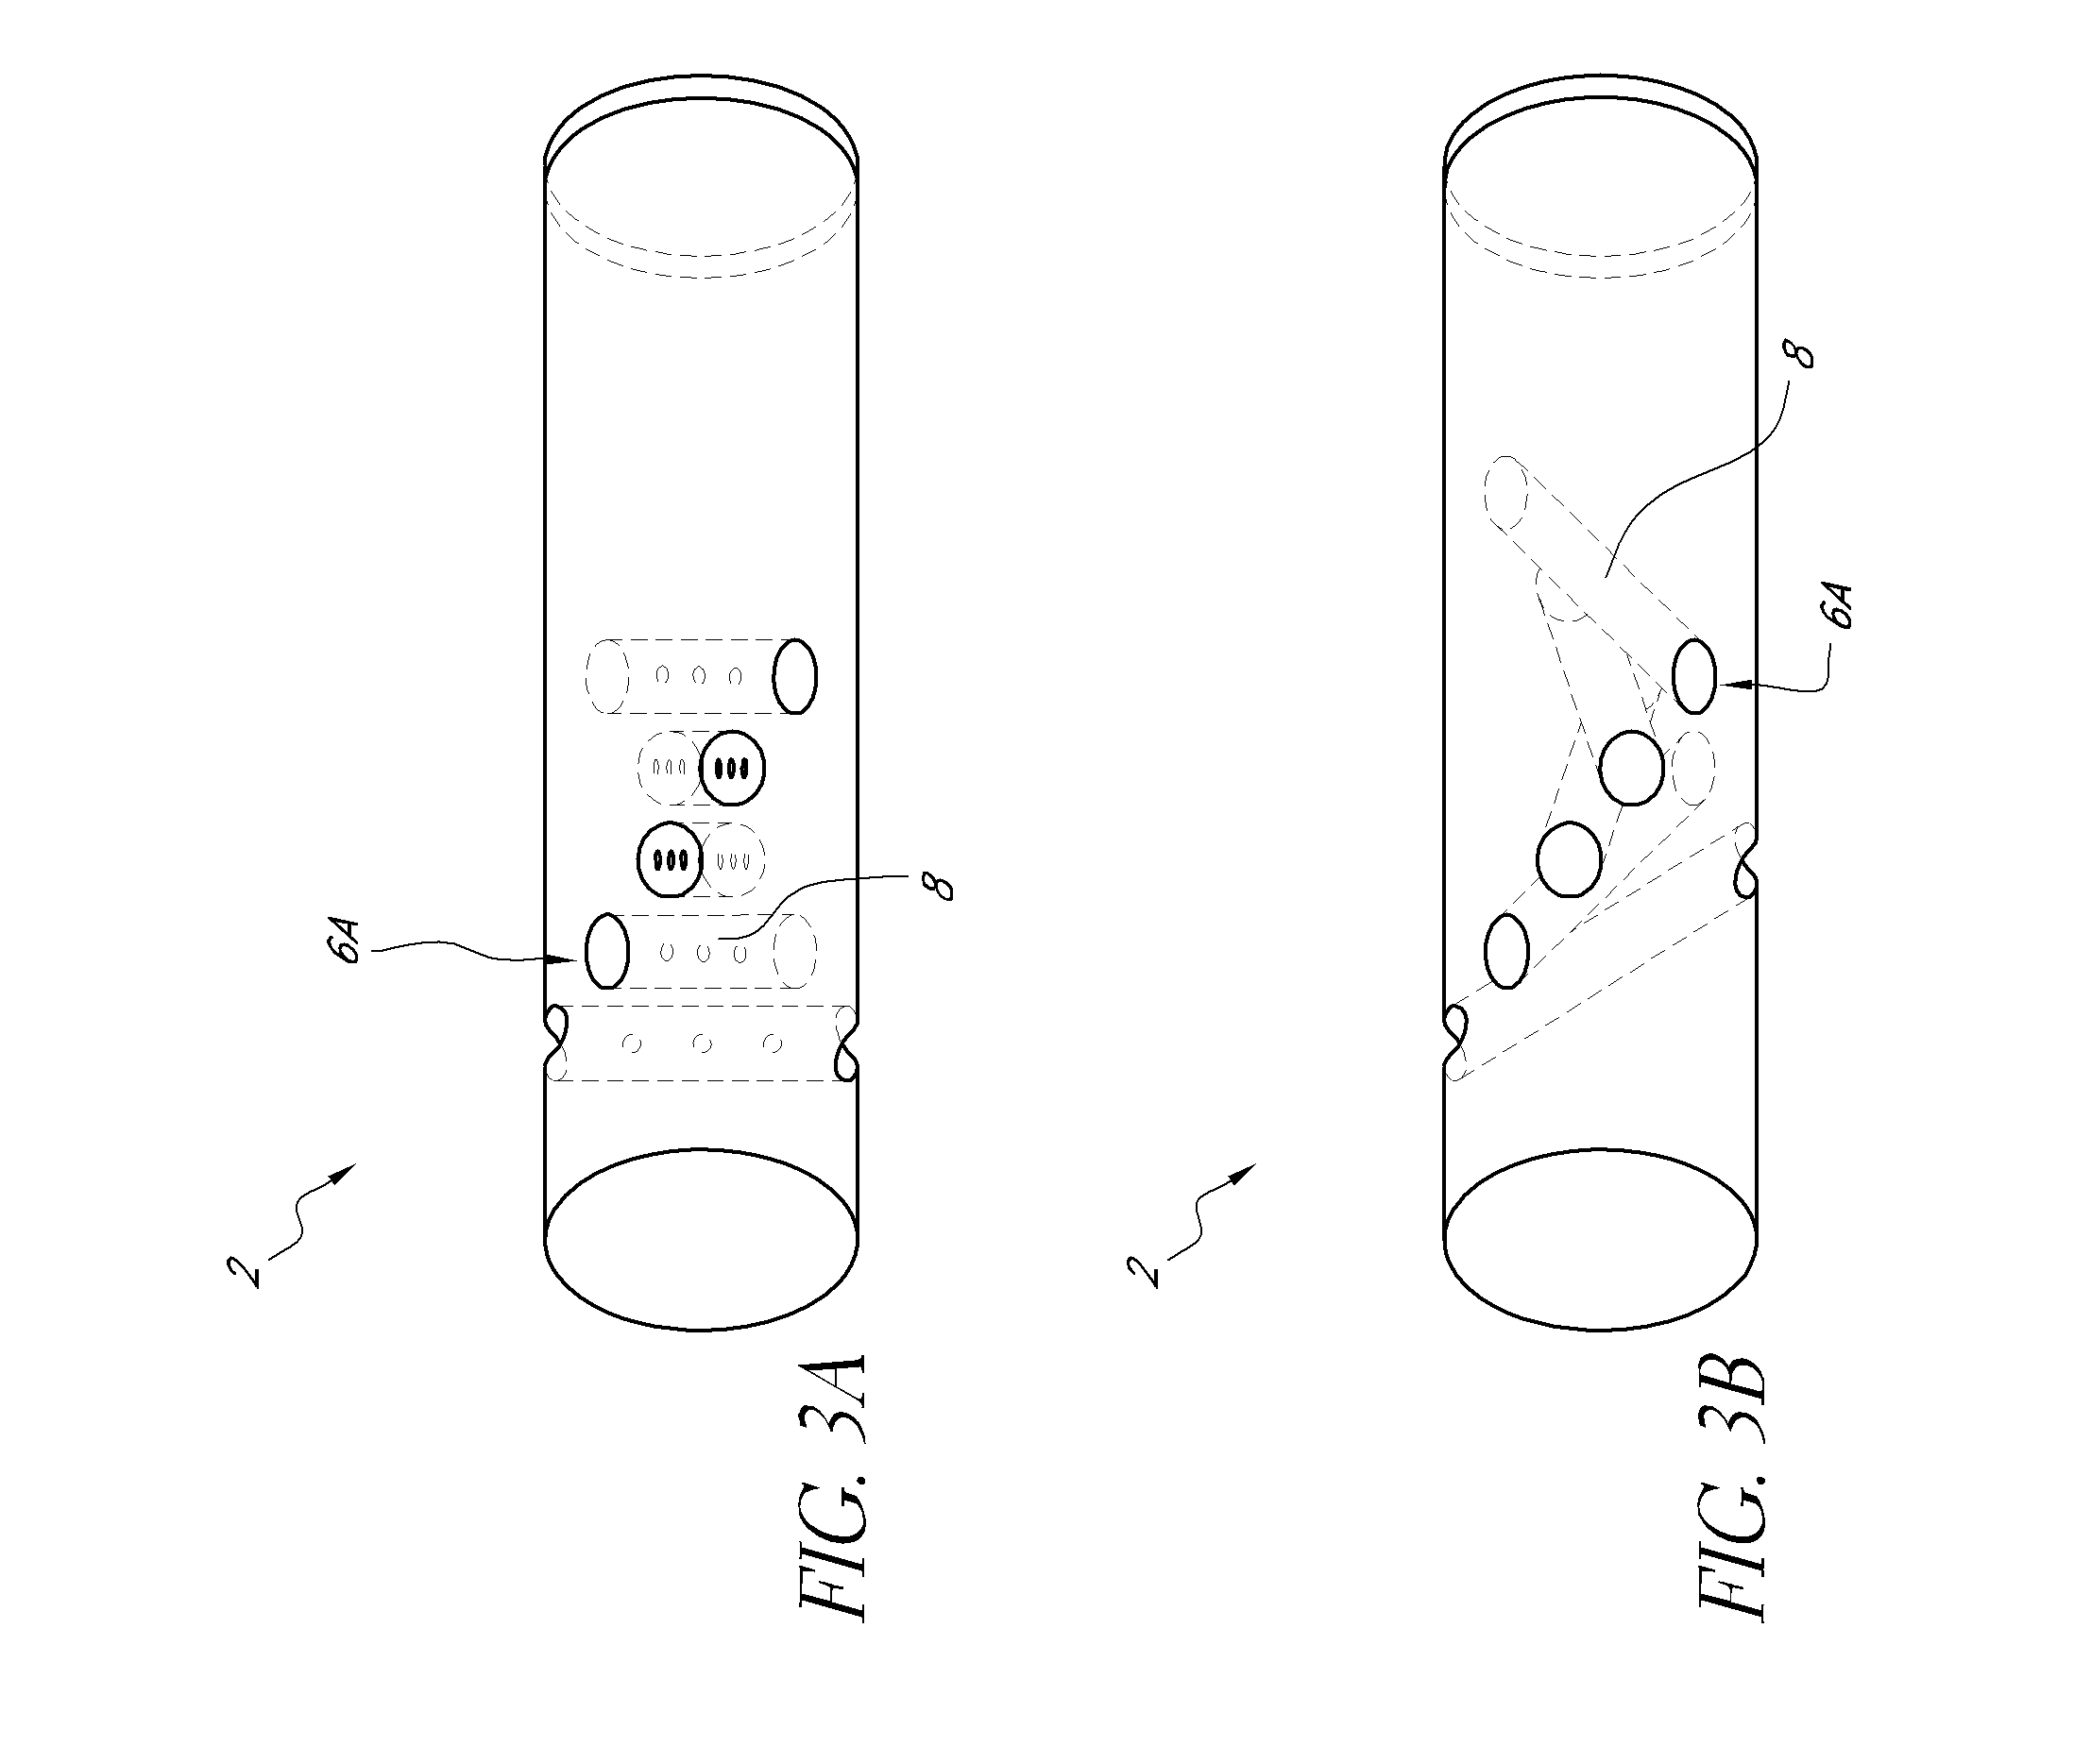
[0013]Also disclosed herein are systems for measuring an in vivo concentration of an analyte at a particular time and identifying whether the measurement is aberrant. In some embodiments, the system includes an analyte sensor configured to generate a signal indicative of the in vivo concentration of the analyte at the particular time. In some embodiments, the system includes a temperature sensing element configured to generate a plurality of signals including a first signal indicative of temperature, and a second signal indicative of temperature at the particular time. In some embodiments, the system includes at least one sensor control unit which is configured to control the operation of the analyte sensor and the temperature sensing element. In some embodiments, the system includes at least one receiving and processing u

Problems solved by technology

In these situations, glucose levels rise in critically ill patients thereby increasing the risk of damage to a patient's organs.
If an aberrant glucose measurement is used for some medical decisions or for control of blood glucose level, such as by administration of insulin, an improper dose could be given or an incorrect and potentially hazardous medical decision could be made.

Method used


Image

  • Identification of aberrant measurements of in vivo glucose concentration using temperature
  • Identification of aberrant measurements of in vivo glucose concentration using temperature
  • Identification of aberrant measurements of in vivo glucose concentration using temperature

Examples


example 1

[0130]A sensor comprising a glucose sensor and a temperature sensor made according to the present disclosure is prepared. The sensor is calibrated by using at least one calibration solution with a known glucose concentration. The sensor is deployed intravascularly into the subject and allowed to stabilize. The proximal end of the sensor is coupled to a light source and a programmable monitor adapted to display continuous real-time glucose measurements as well as rates and directions of changes in blood glucose levels. The monitor is programmed to generate an alarm when it detects an aberrant glucose measurement based on a threshold set to 0.4° C. / min.

[0131]The sensor and monitor are put into operation mode where the light source emits light at a fixed frequency of every 15 seconds. The glucose sensor is excited by the light and emits an emission that is indicative of the glucose activity. The glucose sensor measures a glucose activity, which is optionally converted to a glucose conc...

example 2

[0133]A sensor is inserted substantially similarly to Example 1, except the alarm is set to trigger when the average temperature of the first and third times is different by more than 0.4° C. than the average temperature of the second and fourth times. At a first time, the glucose level is about 100 mg / dL and the temperature sensor is measuring 37.0° C. At the same first time, IV fluid is infused into the subject upstream of the same vascular line used for the glucose measurements. At a second time about 15 seconds after the infusion, the sensor measures the glucose concentration to be about 95 mg / dL at 36.9° C. At a third time about 30 seconds from the infusion, the sensor measures the glucose concentration to be about 95 mg / dL at 36.8° C. At a fourth time about 45 seconds from the infusion, the sensor measures the glucose concentration to be about 90 mg / dL and the temperature sensor is measuring 36.9° C. At a fifth time about 60 seconds from the infusion, the sensor measures the g...


PUM


Abstract

Disclosed herein are methods and systems for generating an estimate of an in vivo analyte concentration and identifying whether the estimate is aberrant. In some embodiments, the system includes a sensor comprising an analyte sensor and a temperature sensing element, and a control unit programmed to identify changes in temperature that may indicate a non-physiologic condition (and result in an aberrant glucose measurement). In some embodiments, the methods include generating an estimate of analyte concentration at a particular time using the analyte sensor, and generating first and second signals indicative of temperature using the temperature sensing element. In some embodiments the methods include identifying the estimate of analyte concentration as aberrant if the magnitude of the difference between the first and second signals indicative of temperature exceeds a threshold value.

Description

CROSS-REFERENCE TO RELATED APPLICATIONS[0001]This application claims priority to U.S. Provisional Patent Application No. 61 / 287,656, filed Dec. 17, 2009, the disclosure of which is hereby expressly incorporated by reference and hereby expressly made a portion of this application. This application is also related to co-pending U.S. patent application Ser. Nos. 11 / 671,880, filed on Feb. 6, 2007, now U.S. Pat. No. 7,751,863 issued on Jul. 6, 2010; 12 / 027,158, filed on Feb. 6, 2008; 12 / 026,396, filed on Feb. 5, 2008; 12 / 118,429, filed on May 9, 2008; 12 / 118,401, filed on May 9, 2008; 12 / 274,617, filed on Nov. 20, 2008; and 12 / 424,902, filed on Apr. 16, 2009; the disclosure of each of which is hereby expressly incorporated by reference in its entirety and is hereby expressly made a portion of this application.BACKGROUND OF THE INVENTION[0002]1. Field of the Invention[0003]Disclosed herein are systems and methods relating to in vivo measurements of analyte concentration and the use of tem...

Claims


Application Information

Patent Timeline
IPC IPC(8): A61B5/145
CPCA61B5/01A61B5/14532A61B5/1473A61B5/7239A61B2560/0252A61B2562/0271A61B5/1495
Inventor PEYSER, THOMAS A.PURVIS, RICHARD E.MARKLE, DAVID R.GAMSEY, SOYAROMEY, MATTHEW A.
Owner MEDTRONIC MIMIMED INC
Learn More