Determining hemodynamic performance
a technology of hemodynamic performance and determining method, which is applied in the field of determining method, system and software product for determining hemodynamic performance, can solve the problems of heart failure, subject will often enter a state of shock, and worsening of patient's condition, and achieve the effect of restoring non-optimal hemodynamic performan
- Summary
- Abstract
- Description
- Claims
- Application Information
AI Technical Summary
Benefits of technology
Problems solved by technology
Method used
Image
Examples
example 1
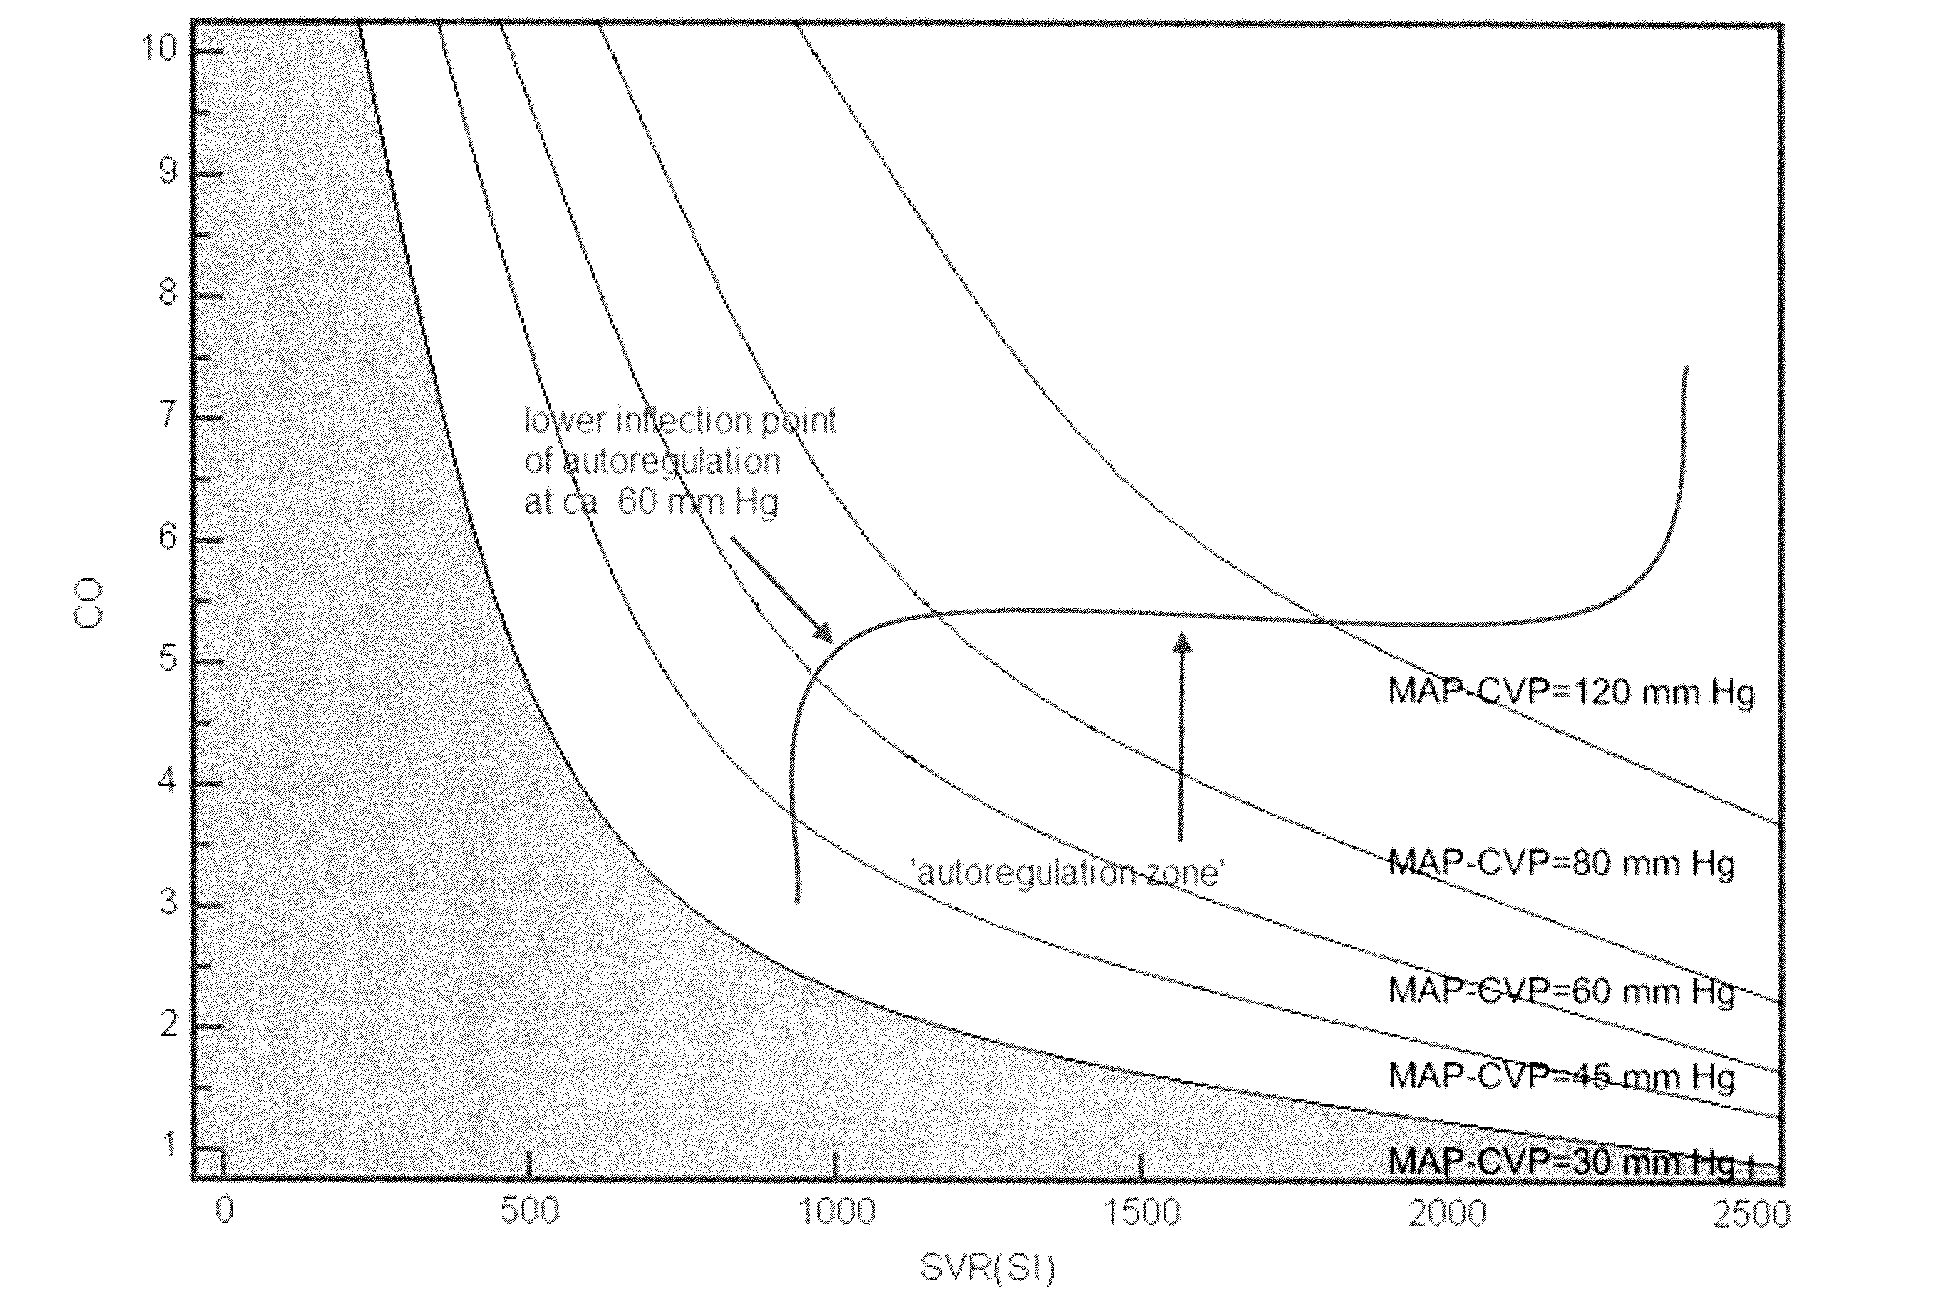
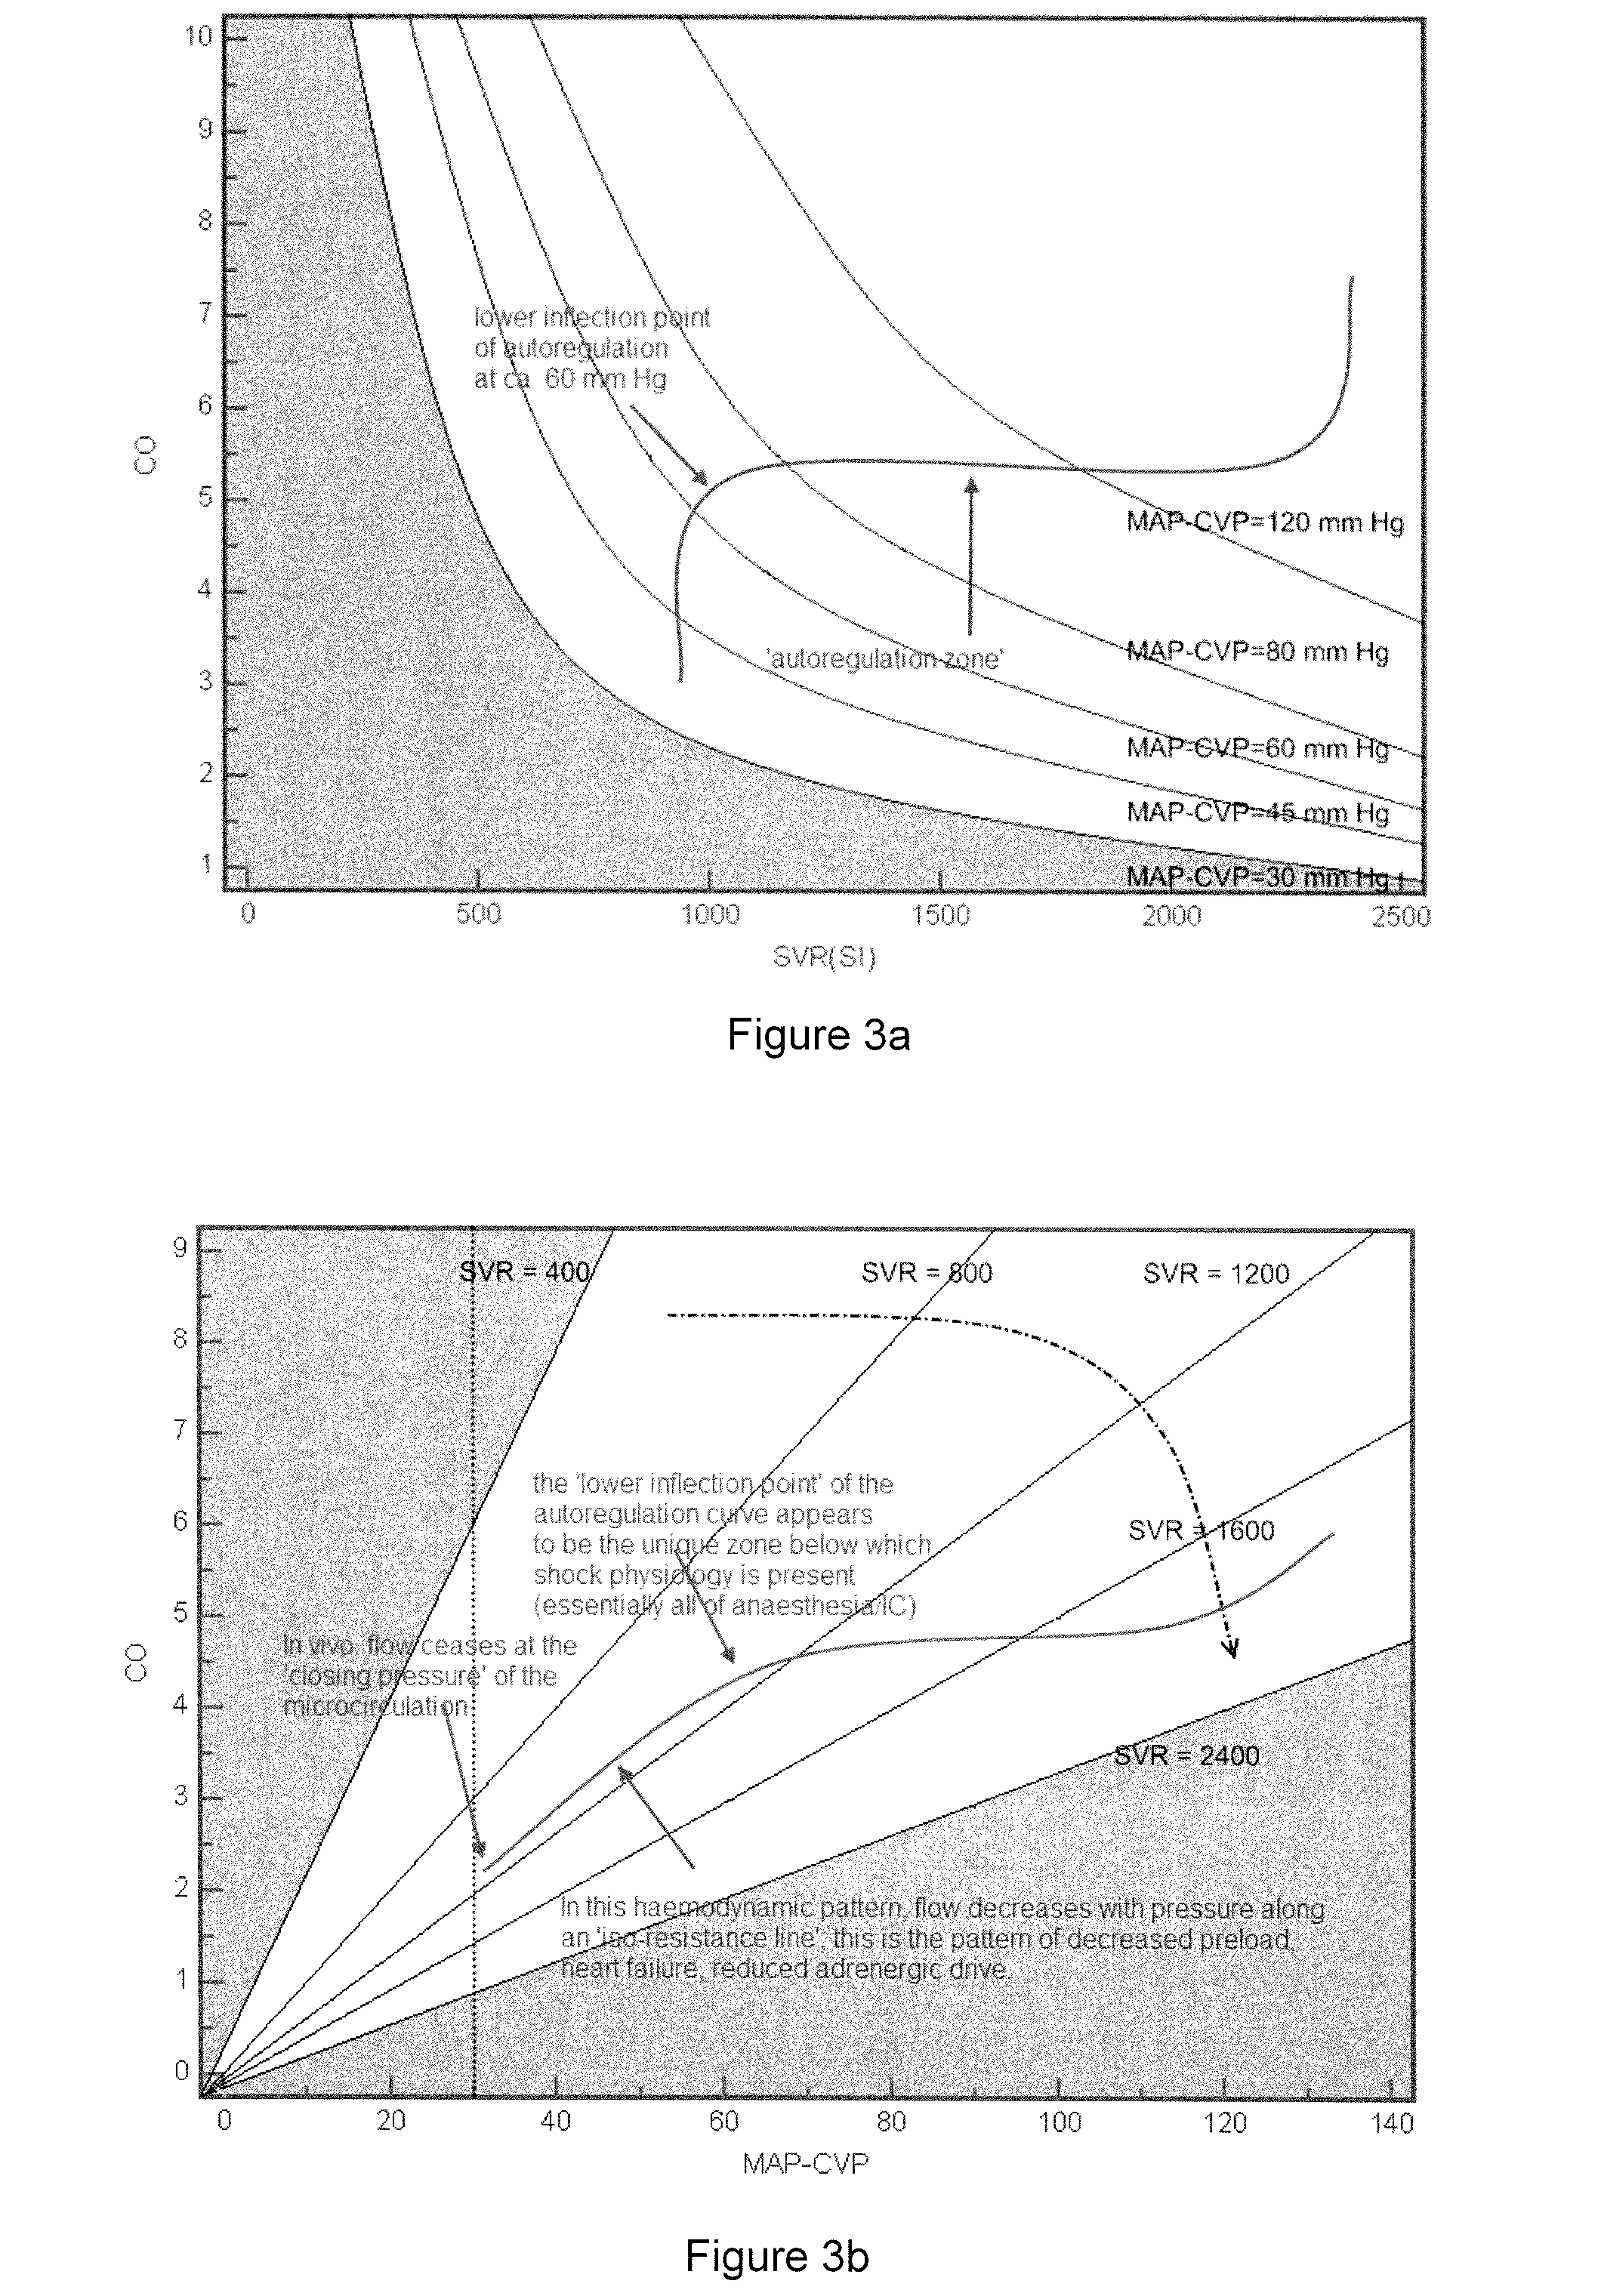
[0183]80 year old male with dilated cardiomyopathy admitted with Pseudomonas, urinary tract infection (UTI) and worsening renal function. This patient illustrates sepsis with systolic dysfunction. The haemodynamic mapping in FIG. 9a shows that on admission the patient is in circulatory failure (i.e. failure of the vascular pump) as is evident by the trend of day 1 data along the third isobar (compare with pattern represented in FIG. 8a). Because of a dilated cardiomyopathy, systolic dysfunction prevents the subject from maintaining the systemic perfusion pressure at his physiological autoregulation zone. As he responds to treatment, the mapping shows that his circulation returns to the zone of normal autoregulation (see day 3 and day 4 data) coinciding with normalization of renal function and cessation of inotropic support. The autoregulation zone when represented in flow-pressure format (iso-resistance nomogram in FIG. 9b) also shows progressive recovery over 3 days.
[0184]As discus...
example 2
[0185]79 year old female undergoing right hemicolectomy and transabdominal oesophagectomy. Pre-induction CO at rest is 5.9 (the resting pre-induction CO is the physiologic autoregulation zone and is valuable in reading the ‘haemodynamic map’). The autoregulation zone in flow-pressure format (iso-resistance nomogram in FIG. 10a) shows a clear ‘heart failure’ pattern during anaesthesia in the operating theatre (OT data).
[0186]If this patient were in the normal autoregulation range, the data values in FIG. 10a would trend horizontally and to the right of the pre-induction value as shown by the solid line in FIGS. 6a-6d. However the data trends downward in FIG. 10a along an iso-resistance line corresponding to the representation of Type 3 shock as represented in the shock pattern of FIG. 6c. Knowing this value is also useful in interpreting the ‘isobar nomogram’ illustrated in FIG. 10b. Here, we see the patient data trending downward from the autoregulation zone again showing a pattern ...
example 3
[0187]Healthy 62 yr male with normal left ventricular function undergoing Coronary Bypass Surgery. The autoregulation zone in FIG. 11a shows a ‘heart failure’ pattern pre-bypass and post-bypass (compare with Type 3 shock as represented in FIG. 6c), and an inflammatory pattern developing post-operation in ICU (compare with Type 1 shock as represented in FIG. 6a).
[0188]On arrival in intensive care, the patient is developing a systemic inflammatory response, so the pattern changes to a Type 1 (sepsis like) pattern. From the mapping in FIG. 10b, the autoregulation zone appears to be around 80 mmHg, at the inflection between the heart failure pattern and the inflammatory pattern. Postoperatively, this patient developed the usual inflammatory response pattern.
[0189]Two days after surgery, when he was hypotensive and oliguruc, the haemodynamic data was mapped again (FIG. 11b) and it unexpectedly showed a ‘heart failure’ pattern, even though the patient had no clinical signs of heart failur...
PUM
 Abstract
Description
Claims
Application Information
 - R&D
- Intellectual Property
- Life Sciences
- Materials
- Tech Scout
- Unparalleled Data Quality
- Higher Quality Content
- 60% Fewer Hallucinations
Browse by: Latest US Patents, China's latest patents, Technical Efficacy Thesaurus, Application Domain, Technology Topic, Popular Technical Reports.
© 2025 PatSnap. All rights reserved.Legal|Privacy policy|Modern Slavery Act Transparency Statement|Sitemap|About US| Contact US: help@patsnap.com


