Biodegradation Process and Composition
a biodegradation and composition technology, applied in the field of microbial compositions and microbial processes, can solve the problems of serious environmental problems, large losses for the shrimp processing industry, and unused by-products posing economic burdens for the marine product processing industries
- Summary
- Abstract
- Description
- Claims
- Application Information
AI Technical Summary
Problems solved by technology
Method used
Image
Examples
example 1
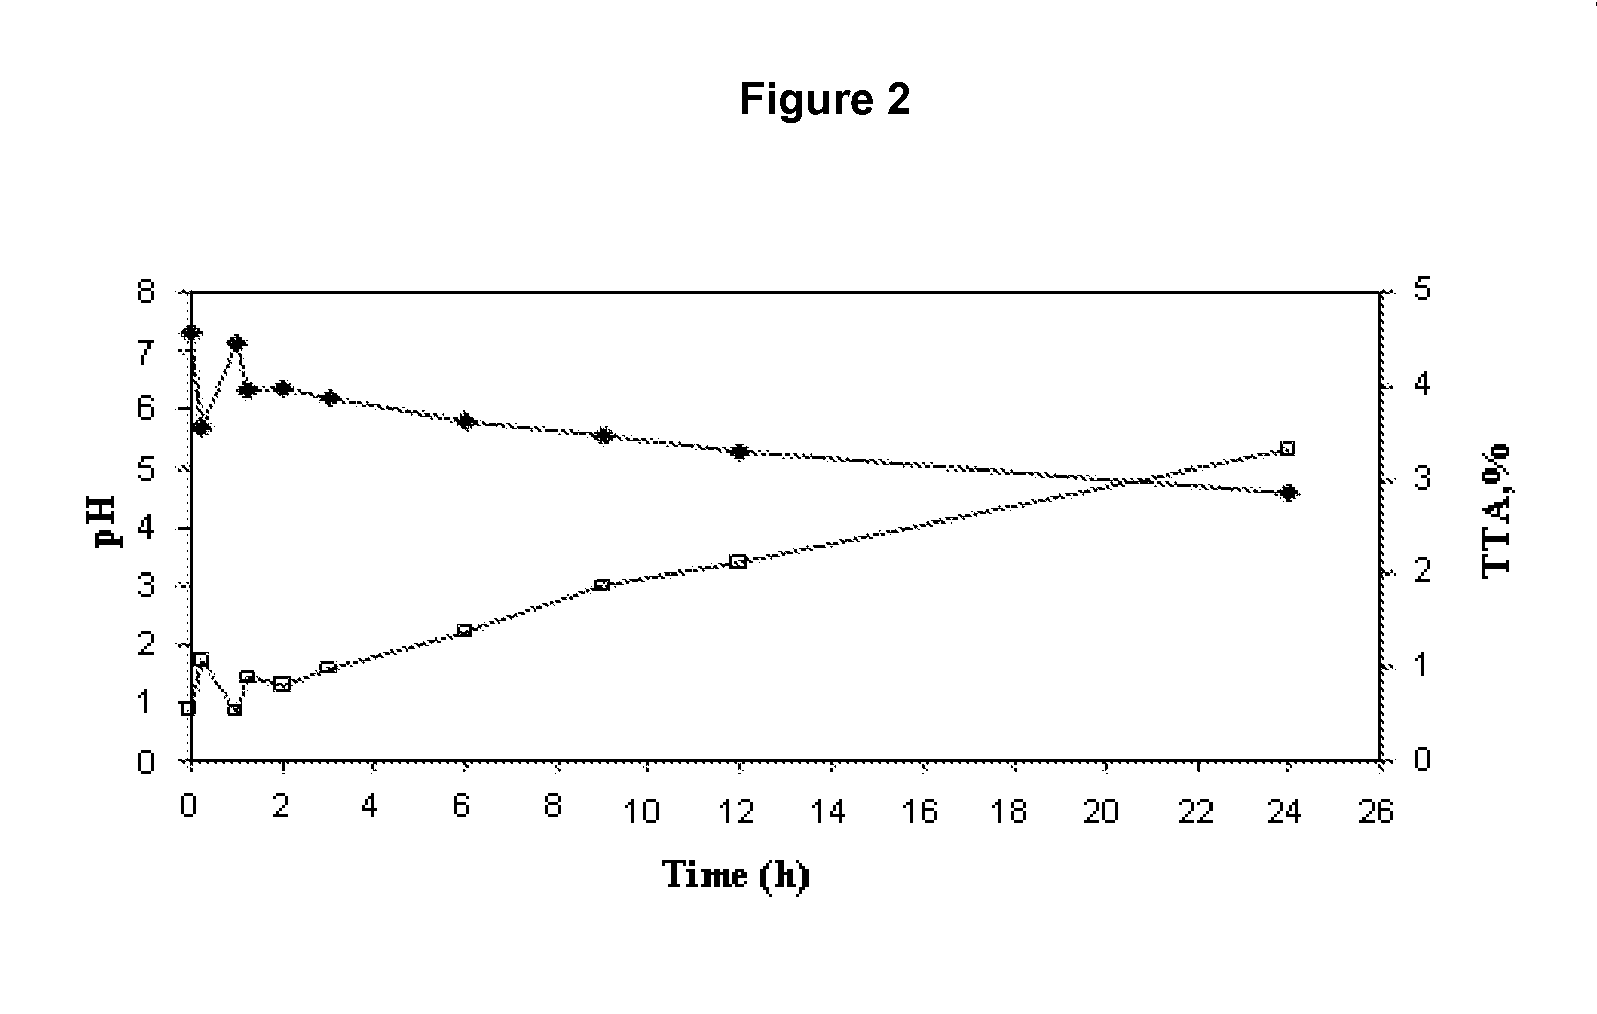
Fermentation Control by Measurement of pH and Total Titratable Acidity (TTA, %)
[0166]The average initial values of pH and TTA were 7.31±0.10 and 0.53±0.09, respectively. As shown in FIG. 2, the pH was initially reduced to 6.5 by the addition of 2 M citric acid. Then, due to proteolysis and the release of ammonium, the pH increased again to 7.11±0.08 during the first 2 h, and later, the pH diminished by 28% (up to 5.28±0.01) during the 12 hours of fermentation. At approximately 24 hours of fermentation, the final pH was 4.57±0.15. In parallel to the decrease in pH a similar behavior was observed in the mean values of the TTA. During the first 2 hours of the average values of TTA were 1%, and then these values increased gradually to an average value of 3.33±0.23 at 24 hours, as shown in FIG. 2.
example 2
Products of the Fermentation and Chemical Composition
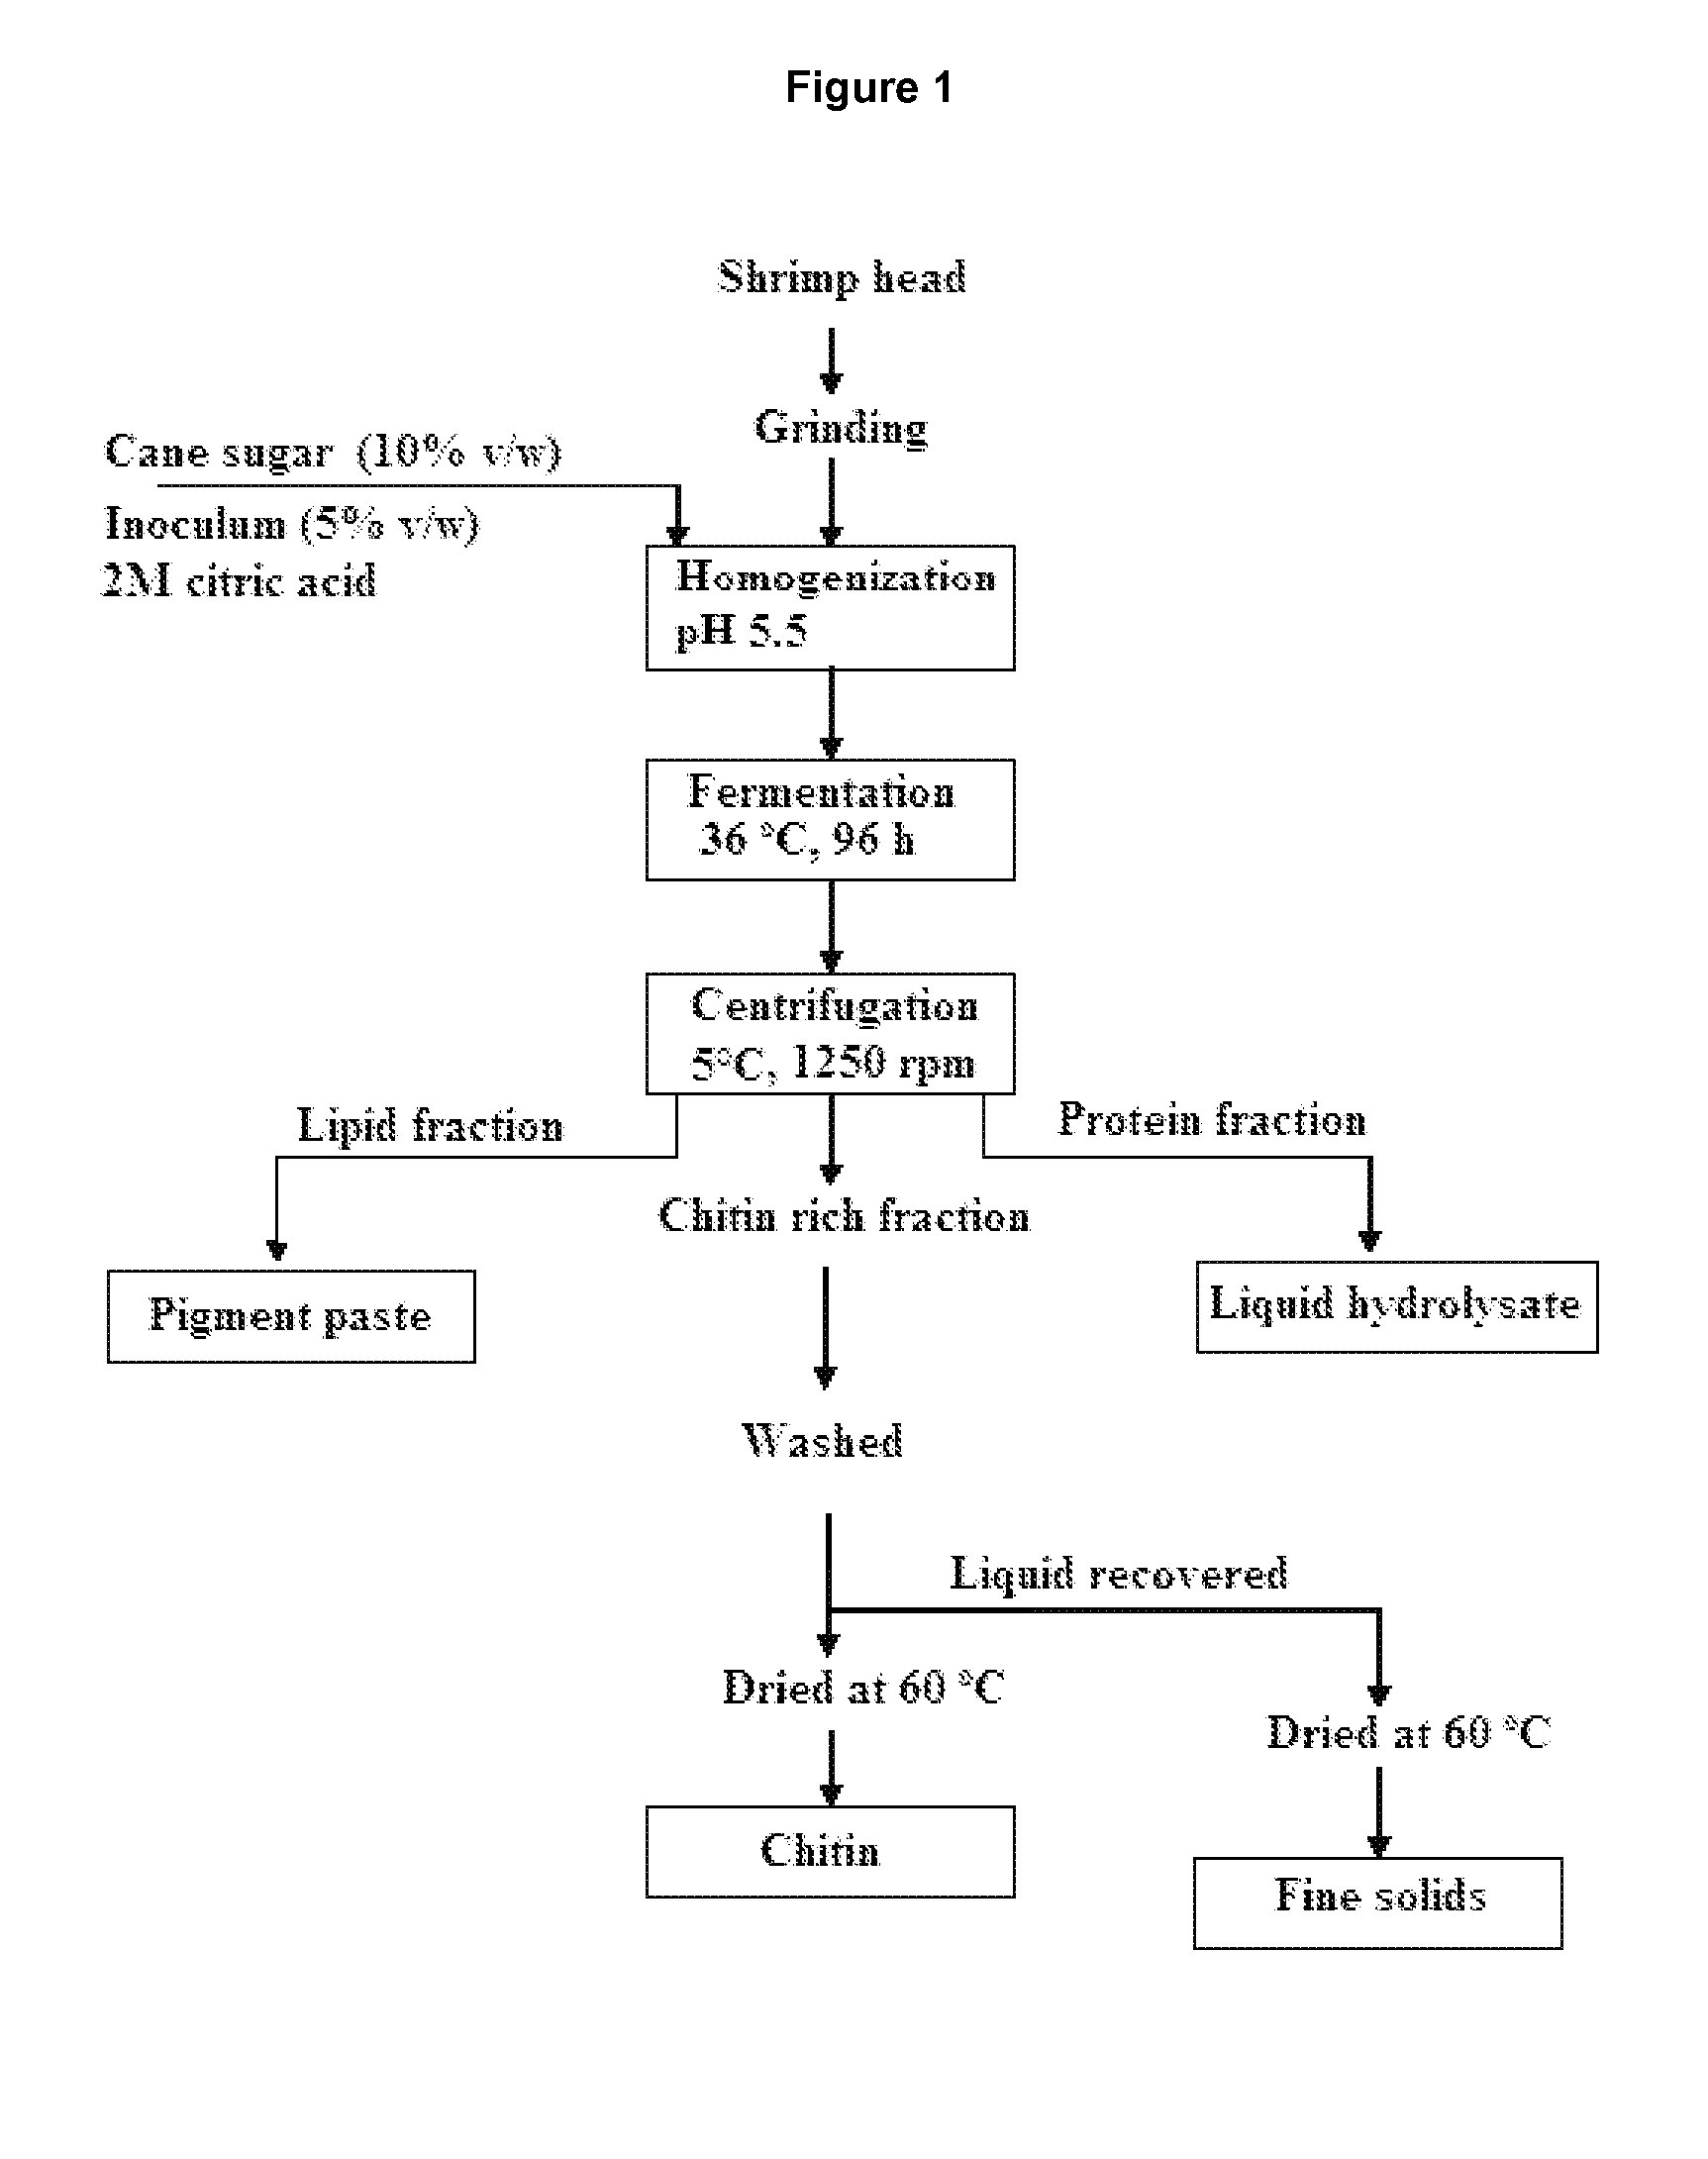
[0167]After the fermentation process, the silage was centrifuged to separate the three principal products (chitin, liquid hydrolysate, and pigment paste). The other product, the fine solids were retained with the raw chitin wash. Table 5 shows the proportion recovered in each fraction. In dry weight, the bigger fraction corresponded to the liquid hydrolysate (55%), then the fine solids (29%), raw chitin (10%) and pigment paste (5%). In the fermented batch, the average value of dry weight was 32% (481.1±5.6 g).
[0168]Table 6 shows the chemical characterization of each of the four main products that were obtained through fermentation. The chitinous product (chitin) shows a partial demineralization reflected as ash. It also reveals high protein content (42.34%) quantified in the liquid hydrolysates. This facilitated the recovery of a pigment paste, consisting mainly of total lipids (42.67%), and produced a fraction abundant in ash (16...
example 3
Amino Acid Profile in the Dry Powder Hydrolysates
[0169]The amino acid content of dried hydrolysate was determined as described by Lopez-Cervantes et al., “Analysis of free amino acids in fermented shrimp waste by high-performance liquid chromatography”, Journal of Chromatography A, volume 1105, 1 (2006). Table 6 shows the total amino acid profile of the dry powder hydrolysates. The proportion of essential amino acids was of 52.5% to dry powder hydrolysates.
TABLE 7Amino acid profile dry powder hydrolysates(mg per g dry weight)Amino acidDry powder hydrolysatesAspartic acid38Glutamic acid39Serine16Histidina*9Glycine28Threonine*14Alanine30Proline8Tyrosine*70Arginine18Valine*20Methionine*4Isoleucine*15Leucine*23Phenylalanine*39Lysine*13Total394* Essential amino207acids
PUM
| Property | Measurement | Unit |
|---|---|---|
| temperature | aaaaa | aaaaa |
| sizes | aaaaa | aaaaa |
| sizes | aaaaa | aaaaa |
Abstract
Description
Claims
Application Information
 - R&D
- Intellectual Property
- Life Sciences
- Materials
- Tech Scout
- Unparalleled Data Quality
- Higher Quality Content
- 60% Fewer Hallucinations
Browse by: Latest US Patents, China's latest patents, Technical Efficacy Thesaurus, Application Domain, Technology Topic, Popular Technical Reports.
© 2025 PatSnap. All rights reserved.Legal|Privacy policy|Modern Slavery Act Transparency Statement|Sitemap|About US| Contact US: help@patsnap.com


