Systems And Methods For Discovering An Optimal Operational Strategy For A Desired Service Delivery Outcome

a service delivery system and optimal operational strategy technology, applied in the field of optimization of service delivery systems, can solve the problems of missing performance targets, service operations management remains extremely complex and unpredictable, and human-provided service delivery systems (“sds”) tend to be significantly labor-intensiv

Inactive Publication Date: 2015-04-09
IBM CORP
View PDF8 Cites 2 Cited by
  • Summary
  • Abstract
  • Description
  • Claims
  • Application Information

AI Technical Summary

Benefits of technology

[0006]A method for creating an action plan for a service delivery system comprising a plurality of operational key performance indicators (KPIs), the method comprising the steps of: (i) receiving predetermined information about at least one relationship between two or more of the KPIs; (ii) weighting the predetermined information about at least one relationship between two or more of the KPIs, wherein the weight is dependent upon the source of the predetermined information; (iii) receiving information about at least one operational constraint on the service delivery system; (iv) receiving information about at least one desired outcome of the service delivery system; (v) determining a plurality of KPI relationships within the service delivery system, wherein each KPI relationship is between two or more of the KPIs and comprises a degree of influence attribute and a rate of influence attribute; (vi) determining, utilizing the weighted predetermined information and the plurality of determined KPI relationships, a KPI relationship map; (vii) predicting for a future time period, utilizing the KPI relationship map, at least one service delivery outcome; and (viii) creating an action plan to achieve the at least one desired outcome of the service delivery system, wherein the action plan is limited by the at least one operational constraint on the service delivery system, and further wherein the action plan comprises information about an operational target for at least one KPI.

Problems solved by technology

Although services account for a major source of revenues and employment in many modern economies, service operations management remains extremely complex and unpredictable.
Human-provided service delivery systems (“SDs”) tend to be significantly labor-intensive and often miss performance targets as the system involves many complex and interdependent processes.
Operational improvements directly impact the operational KPIs as well as the service delivery outcomes, although there may be delays in impacts.

Method used


Image

  • Systems And Methods For Discovering An Optimal Operational Strategy For A Desired Service Delivery Outcome
  • Systems And Methods For Discovering An Optimal Operational Strategy For A Desired Service Delivery Outcome
  • Systems And Methods For Discovering An Optimal Operational Strategy For A Desired Service Delivery Outcome

Examples


example 1

[0025]According to one embodiment, the rate of influence is calculated or estimated by the following calculation:

Rate of Influence=Degree of Influence / Time of Influence

In a service delivery system where both operational and outcome KPI measurement is based on as-is states, the Degree of Influence can be measured by the correlation co-efficient between the operational (cause) and the outcome (effect) metric.

[0026]In this example, consider a pair of cause and effect metrics (X, Y) with data collected for T timestamps, such as X=[X1, X2, . . . XT], and Y=[Y1, Y2, . . . YT]. If h (in weeks) is the maximum timelag possible between a cause and an effect, then a, is defined as the correlation co-efficient between metrics X and Y at timelag i (in weeks), where a0 is the correlation when the cause takes effect instantaneously with no delay, and a1 is the correlation when the cause takes effect after 1 week, and so forth where aN is the correlation when the cause takes effect after N weeks.

[0...

example 2

[0030]According to one embodiment, the method or system maintains a weight of confidence for each of the sources of information and the final KPI relationship is a weighted combination. For example, S1, S2, and S3 can be three sources of information for every relationship edge eij between nodes vi and vj and αij (t), βij (t), and γij are the corresponding weights, where s1 and s2 are sources from experts or knowledge databases and s3 is the information extracted from data. The relationship between the node vi and vj is valid if the sum of the weights αij (t)+βij (t)+and γij rij(t) is greater than a threshold value vij rij the measured value from data at t. According to this embodiment, the weights αij (t) and βij (t) can be updated dynamically based on the measured value from data, such as the following:

αij(t+1)=(1−p)αij(t)+prij(t)

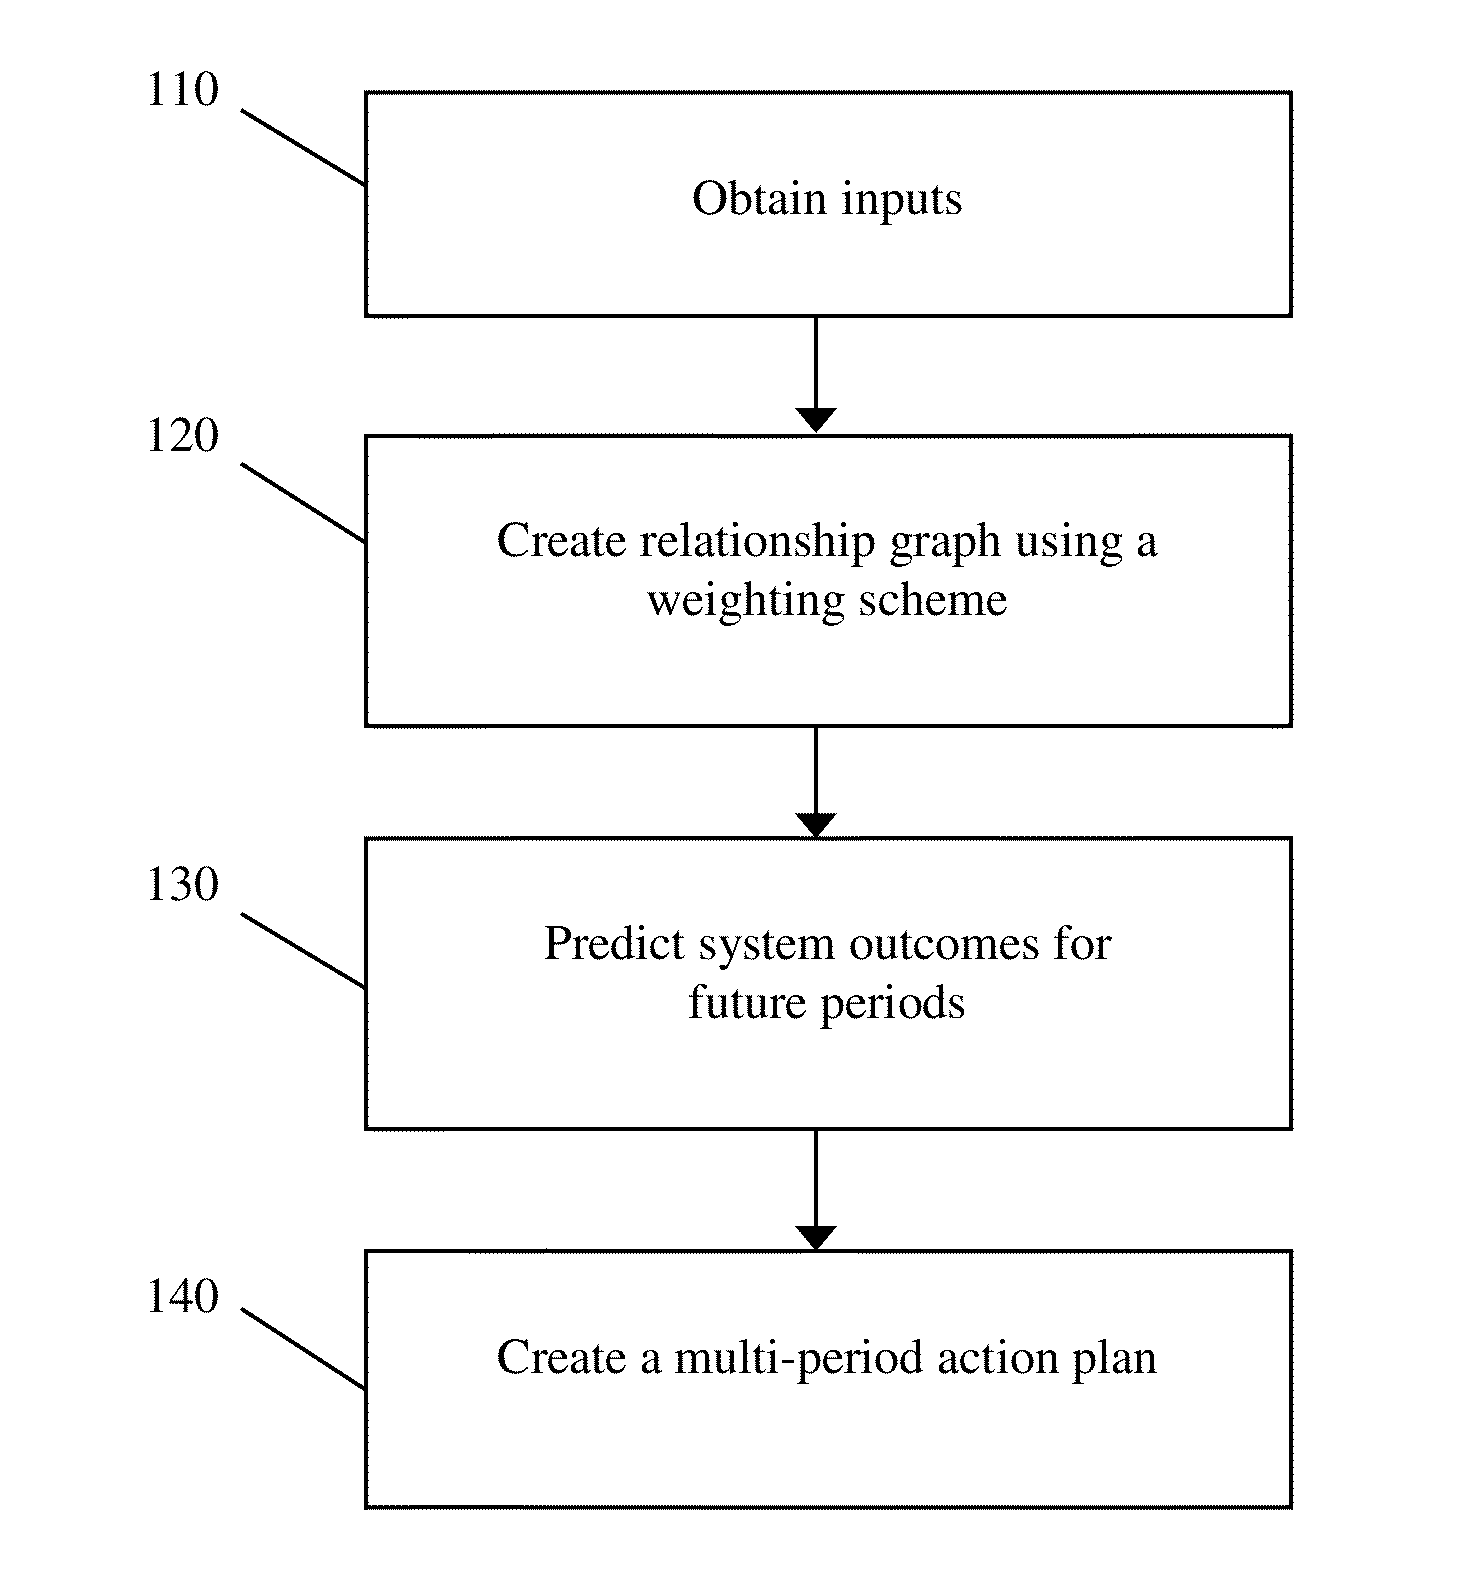
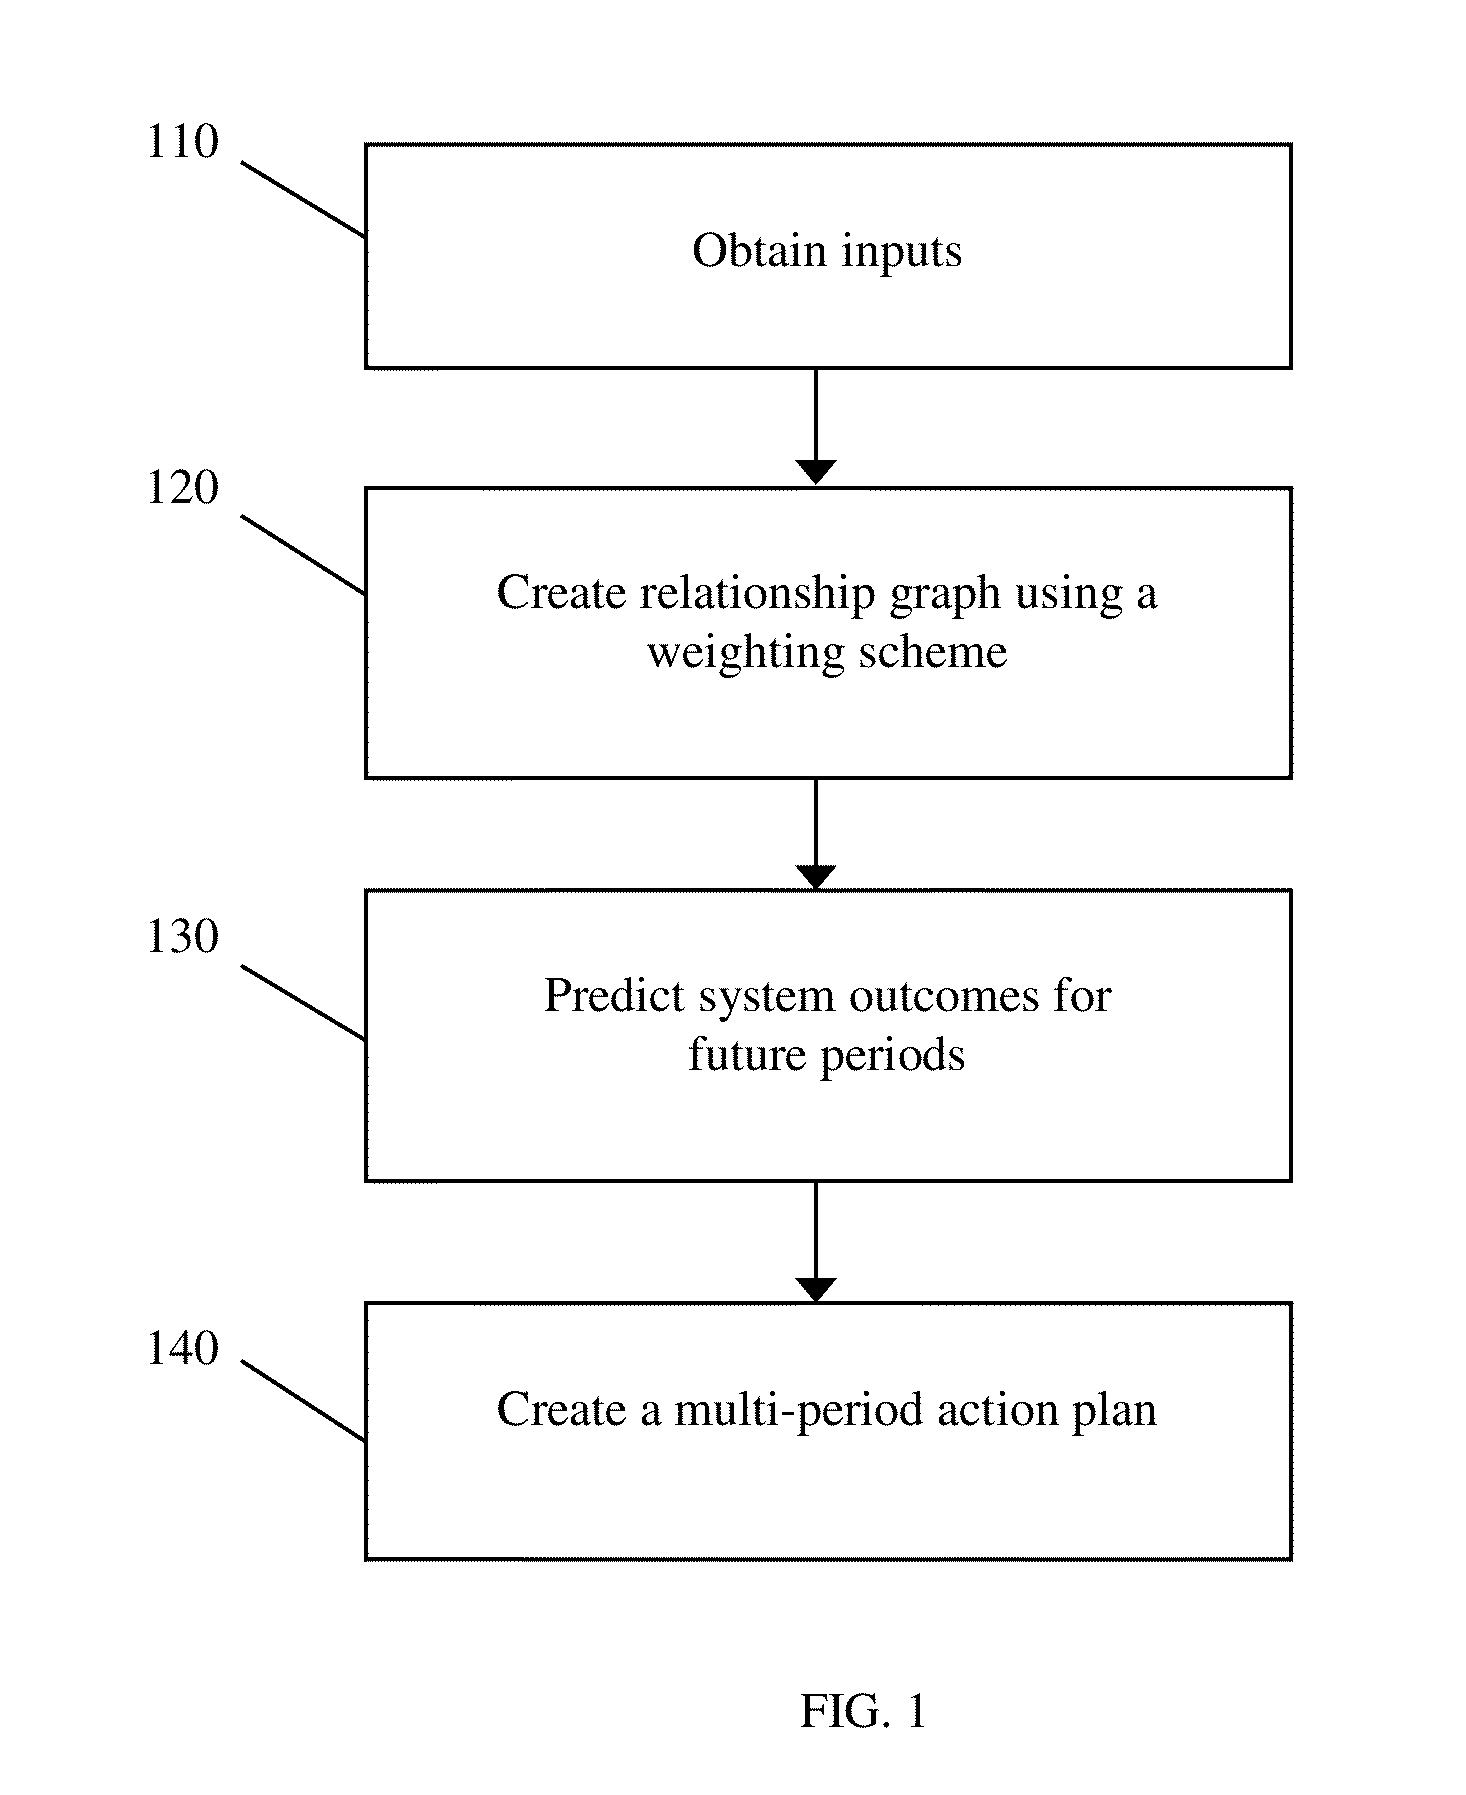
[0031]At step 130 of method 100, the method or system predicts the outcome for the future periods (for example, t+1, t+2, t+3, etc.) given one or more of ...

example 3

[0033]According to one embodiment, the method or system creates a three-week action plan to specify the target performance levels for each of the independent KPIs for each period in order to achieve the desired service delivery outcomes. In this example, the system is considering three KPIs called a, b, and c which are related as shown in FIG. 5. The desired outcome in this example is to move “c” to a value of 0.8.

[0034]According to this action plan, at week 1, KPI “a” should be increased due to an inflow of investment of c1, where the net outcome value of c converges to 0.7. At week 2, KPI “b” should be increased due to a further investment of c2, where the net outcome value is 0.68. At week 3, KPI “a” should be further increased due to an investment of c3, where the net outcome value is 0.81. This action plan therefore attains a net value of 0.81 at end of third week, with a total cost of c1+c2+c3. The cost reflects the investments that trigger change in KPIs “a” and “b.” Here, Φa...


PUM


Abstract

Methods and systems for creating an action plan for a service delivery system comprising a plurality of operational key performance indicators (KPIs). The system receives predetermined information about at least one relationship between two or more of the KPIs, and weights that information based on its source. The system also receives information about operational constraints and desired outcomes. A KPI relationship map is created using both the weighted information and information about KPI relationships within the service delivery system. Future predictions are made based on the KPI relationship map, and the predictions and map are utilized to create an action plan to achieve the desired outcomes in light of the operational constraints.

Description

FIELD OF THE DISCLOSURE[0001]The present disclosure relates to optimization of service delivery systems, and more particularly to methods and systems for characterizing the interrelation of one or more operational performance indicators and service delivery outcomes.BACKGROUND[0002]Although services account for a major source of revenues and employment in many modern economies, service operations management remains extremely complex and unpredictable. Human-provided service delivery systems (“SDs”) tend to be significantly labor-intensive and often miss performance targets as the system involves many complex and interdependent processes.[0003]Service delivery operations can be measured using, among other things, operational key performance indicators (“KPIs”). These KPIs can include, for example, mean time to respond, worker utilization, and workload complexity, among many others. Additionally, to characterize service delivery operation measurements, the interrelationship of KPIs ca...

Claims


Application Information

Patent Timeline
Patent Type & Authority Applications(United States)
IPC IPC(8): G06Q10/06
CPCG06Q10/06393
Inventor DASGUPTA, GARGI B.SHRINIVASAN, YEDENDRA B.NALLACHERRY, JAYANNAYAK, TAPAN K.DESAI, NIRMIT V.
Owner IBM CORP
Why Eureka
Try Eureka