Supercharge Your Innovation With Domain-Expert AI Agents!

Systems and methods for automatic interactive visualizations

Inactive Publication Date: 2015-06-18
IZENDA
View PDF14 Cites 52 Cited by
  • Summary
  • Abstract
  • Description
  • Claims
  • Application Information

AI Technical Summary

Benefits of technology

The patent describes a system and method for creating interactive visualizations based on selected data from a database. The system uses heuristics, or rules, to determine the most appropriate visualization for the data. This helps to make the most out of the data and make it easier to analyze. Overall, the technical effect of this patent is to make it easier for users to access and analyze data in a more efficient way.

Problems solved by technology

However, the typical user does not have the Information Technology (IT) expertise or the resources to employ dedicated IT resources to develop tools or custom reports.
Furthermore, the typical user does not know how to properly visualize vast amounts of disparate data. i.e., the typical user does not have the expertise to make the best decisions on how to visualize data.

Method used


Image

  • Systems and methods for automatic interactive visualizations
  • Systems and methods for automatic interactive visualizations
  • Systems and methods for automatic interactive visualizations

Examples


Embodiment Construction

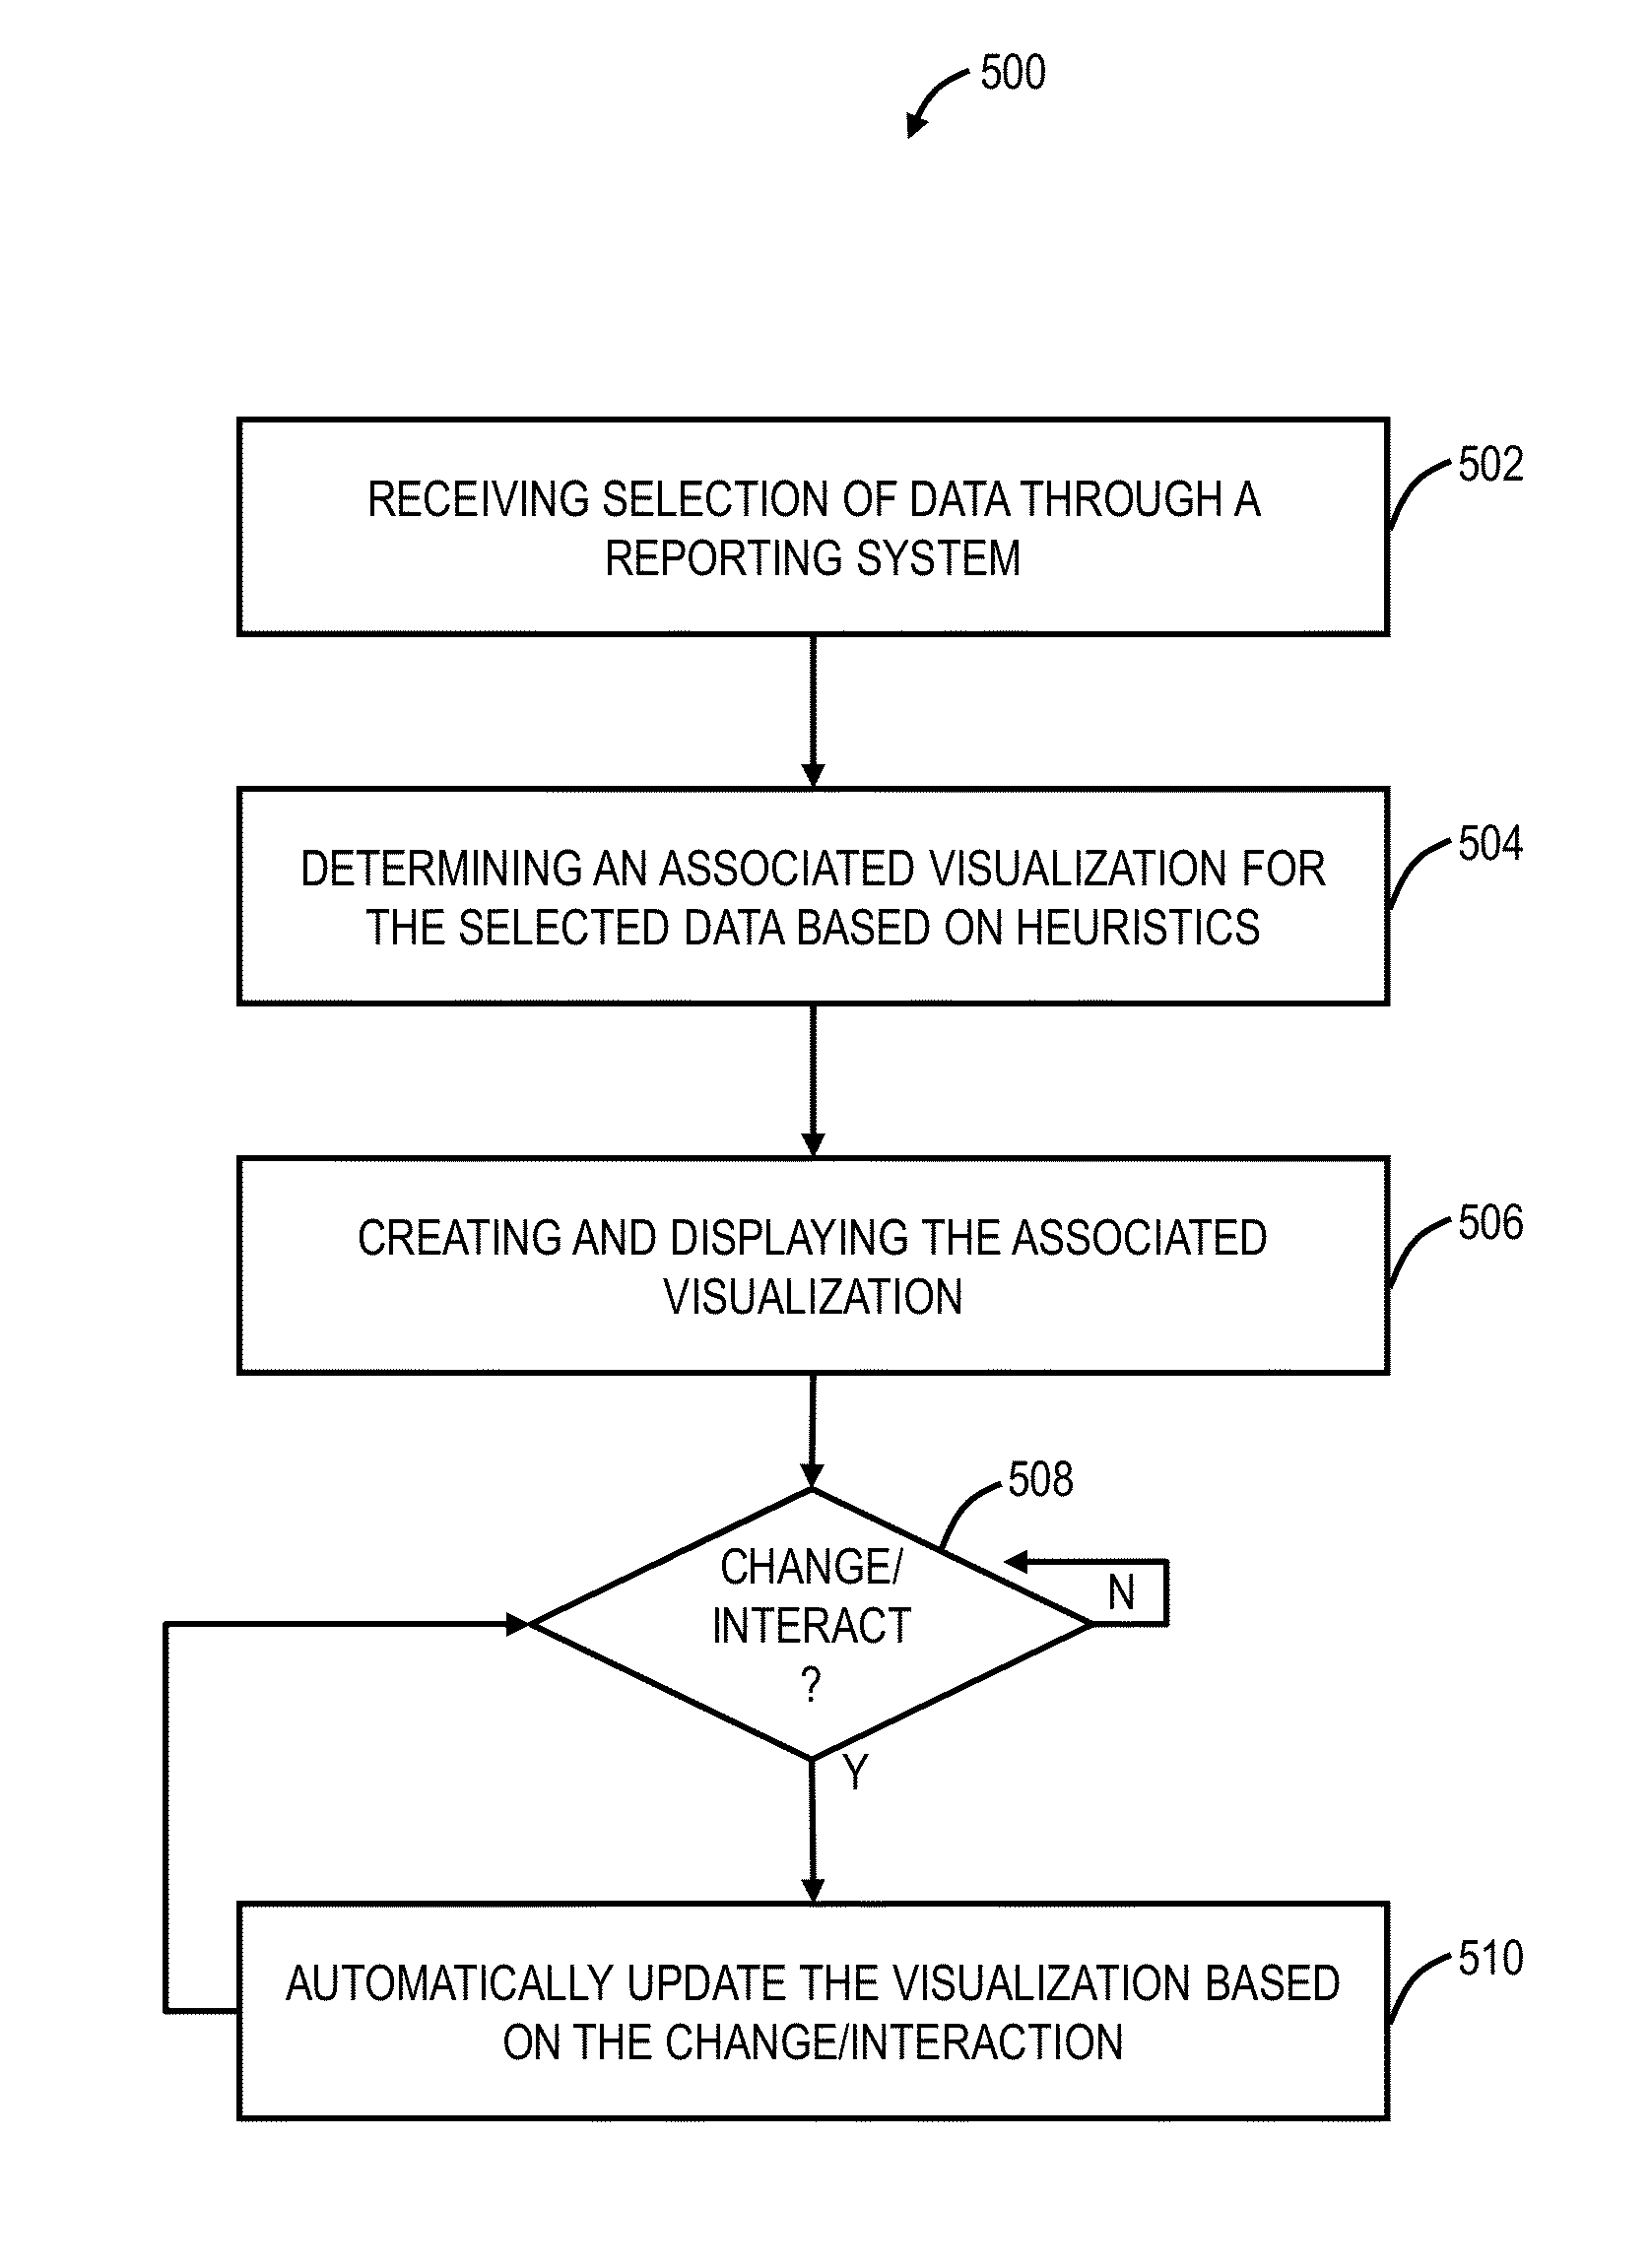
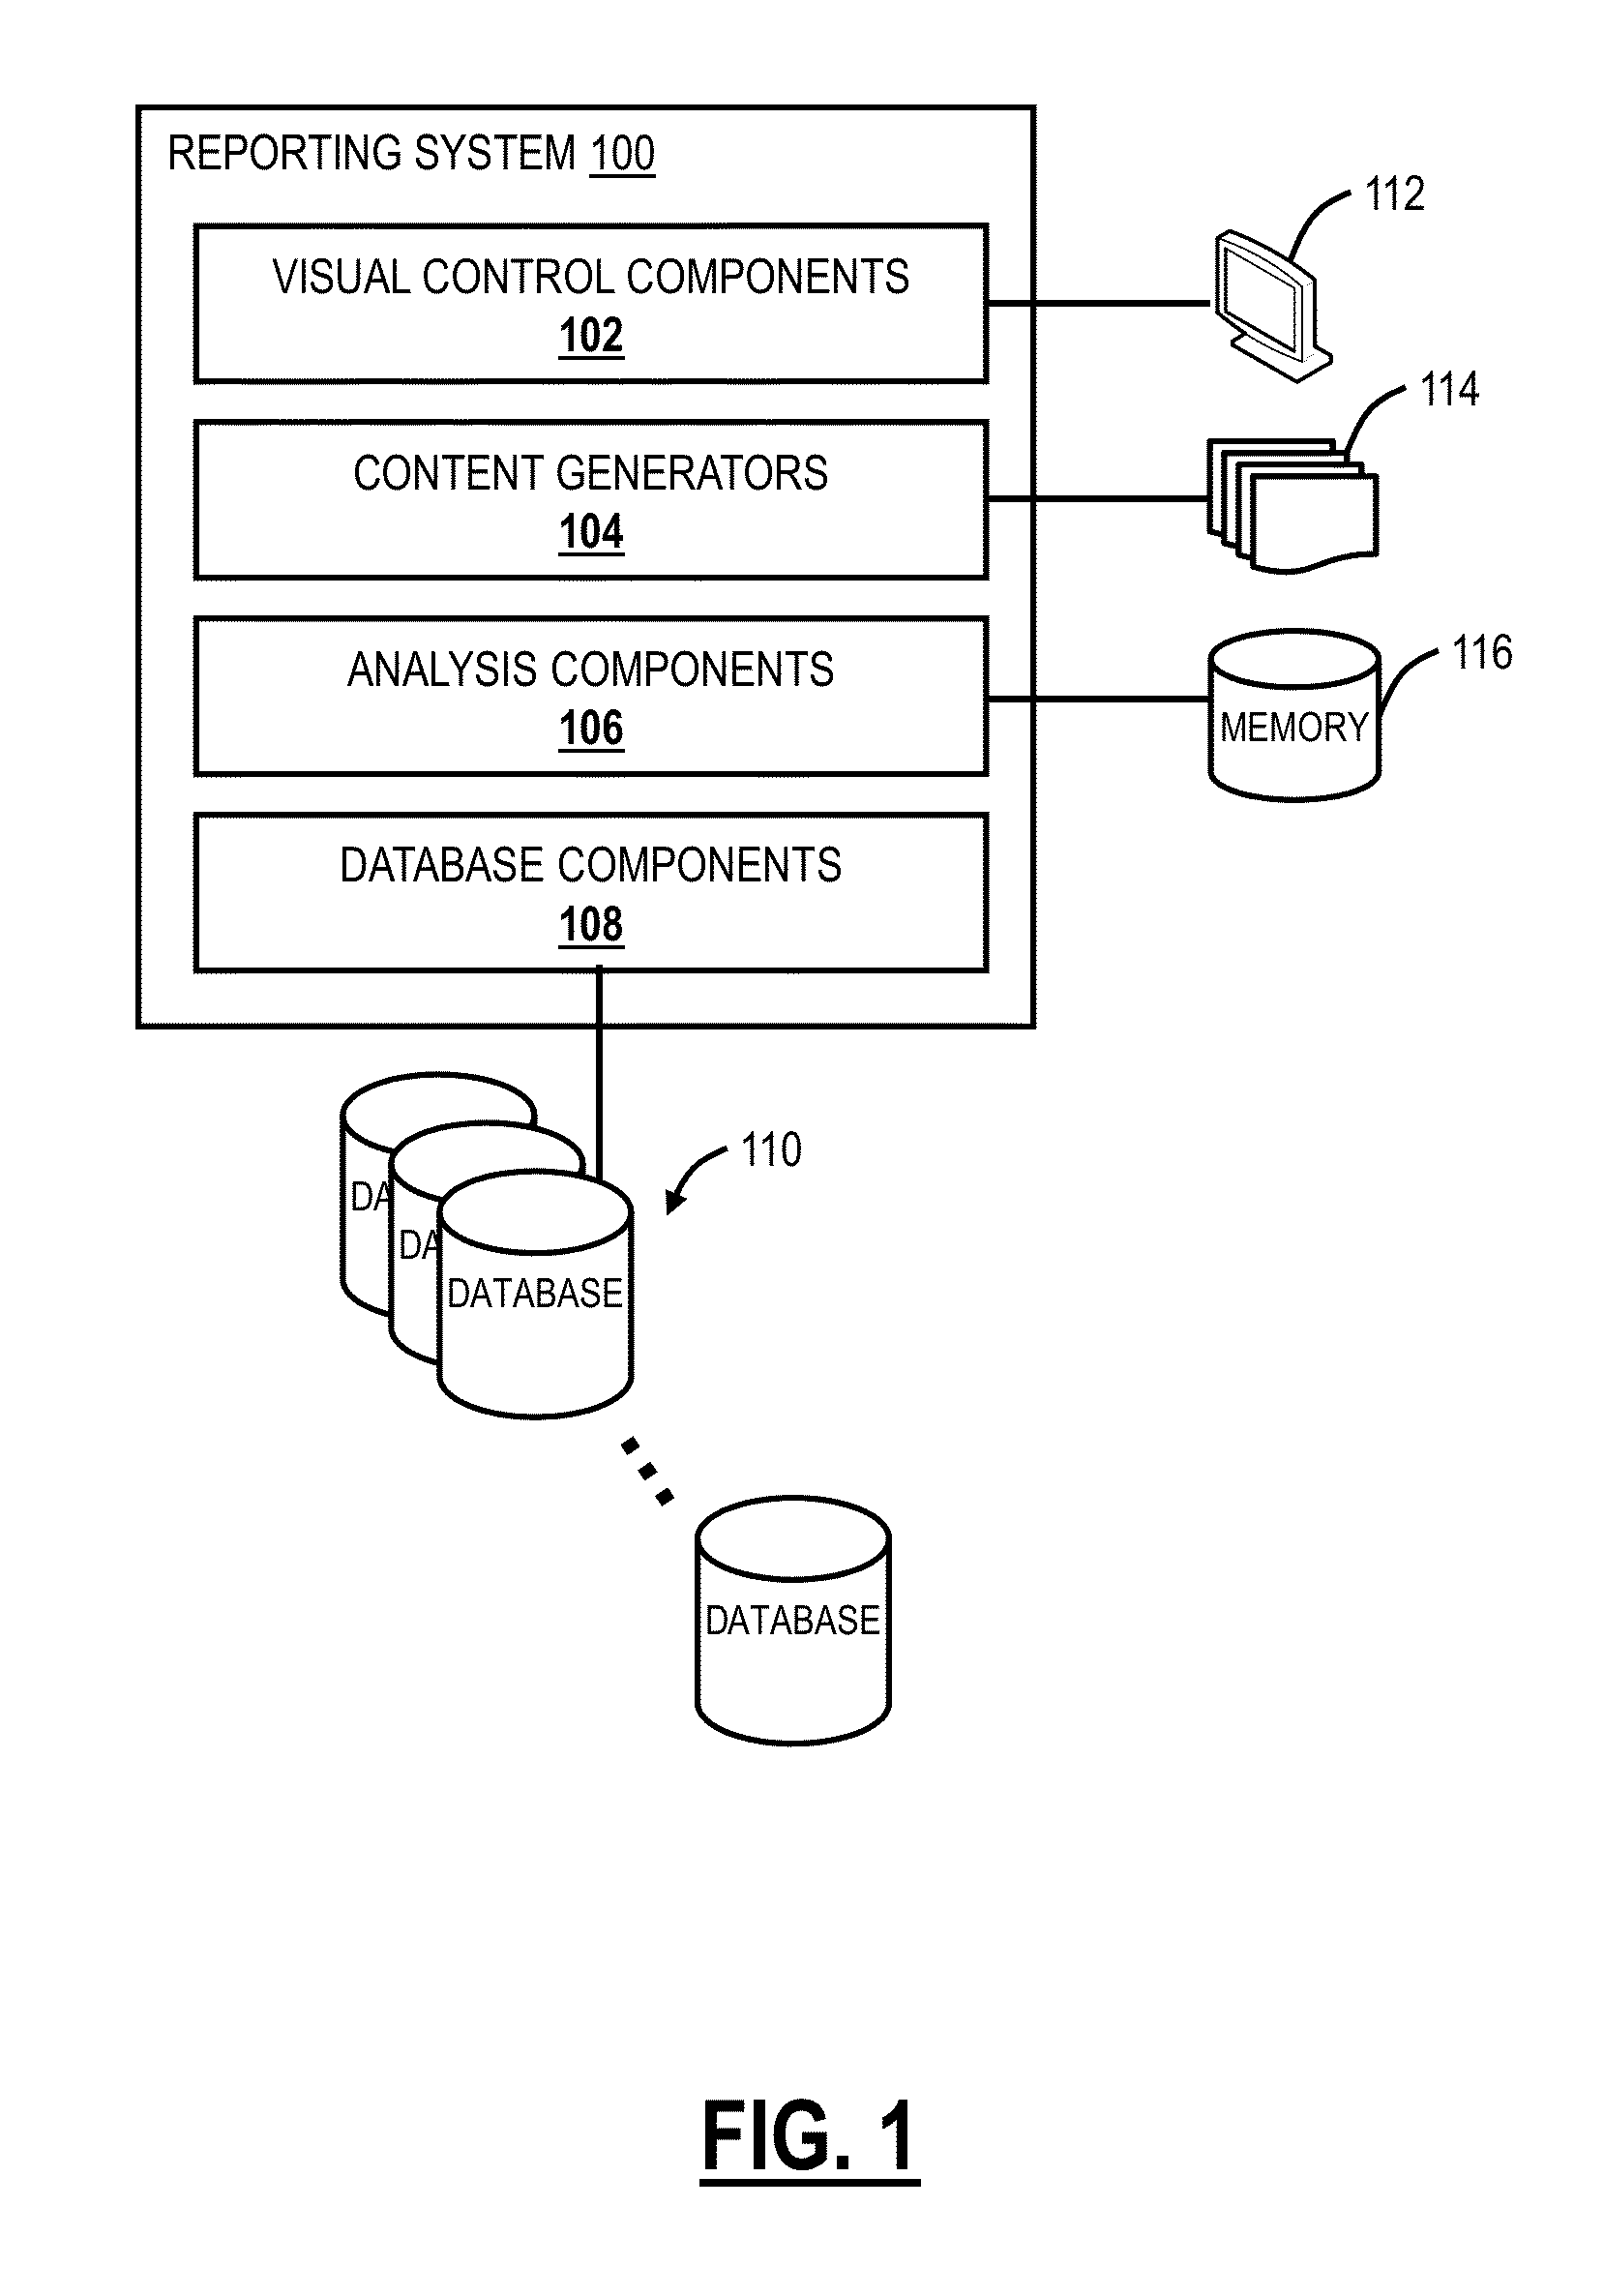
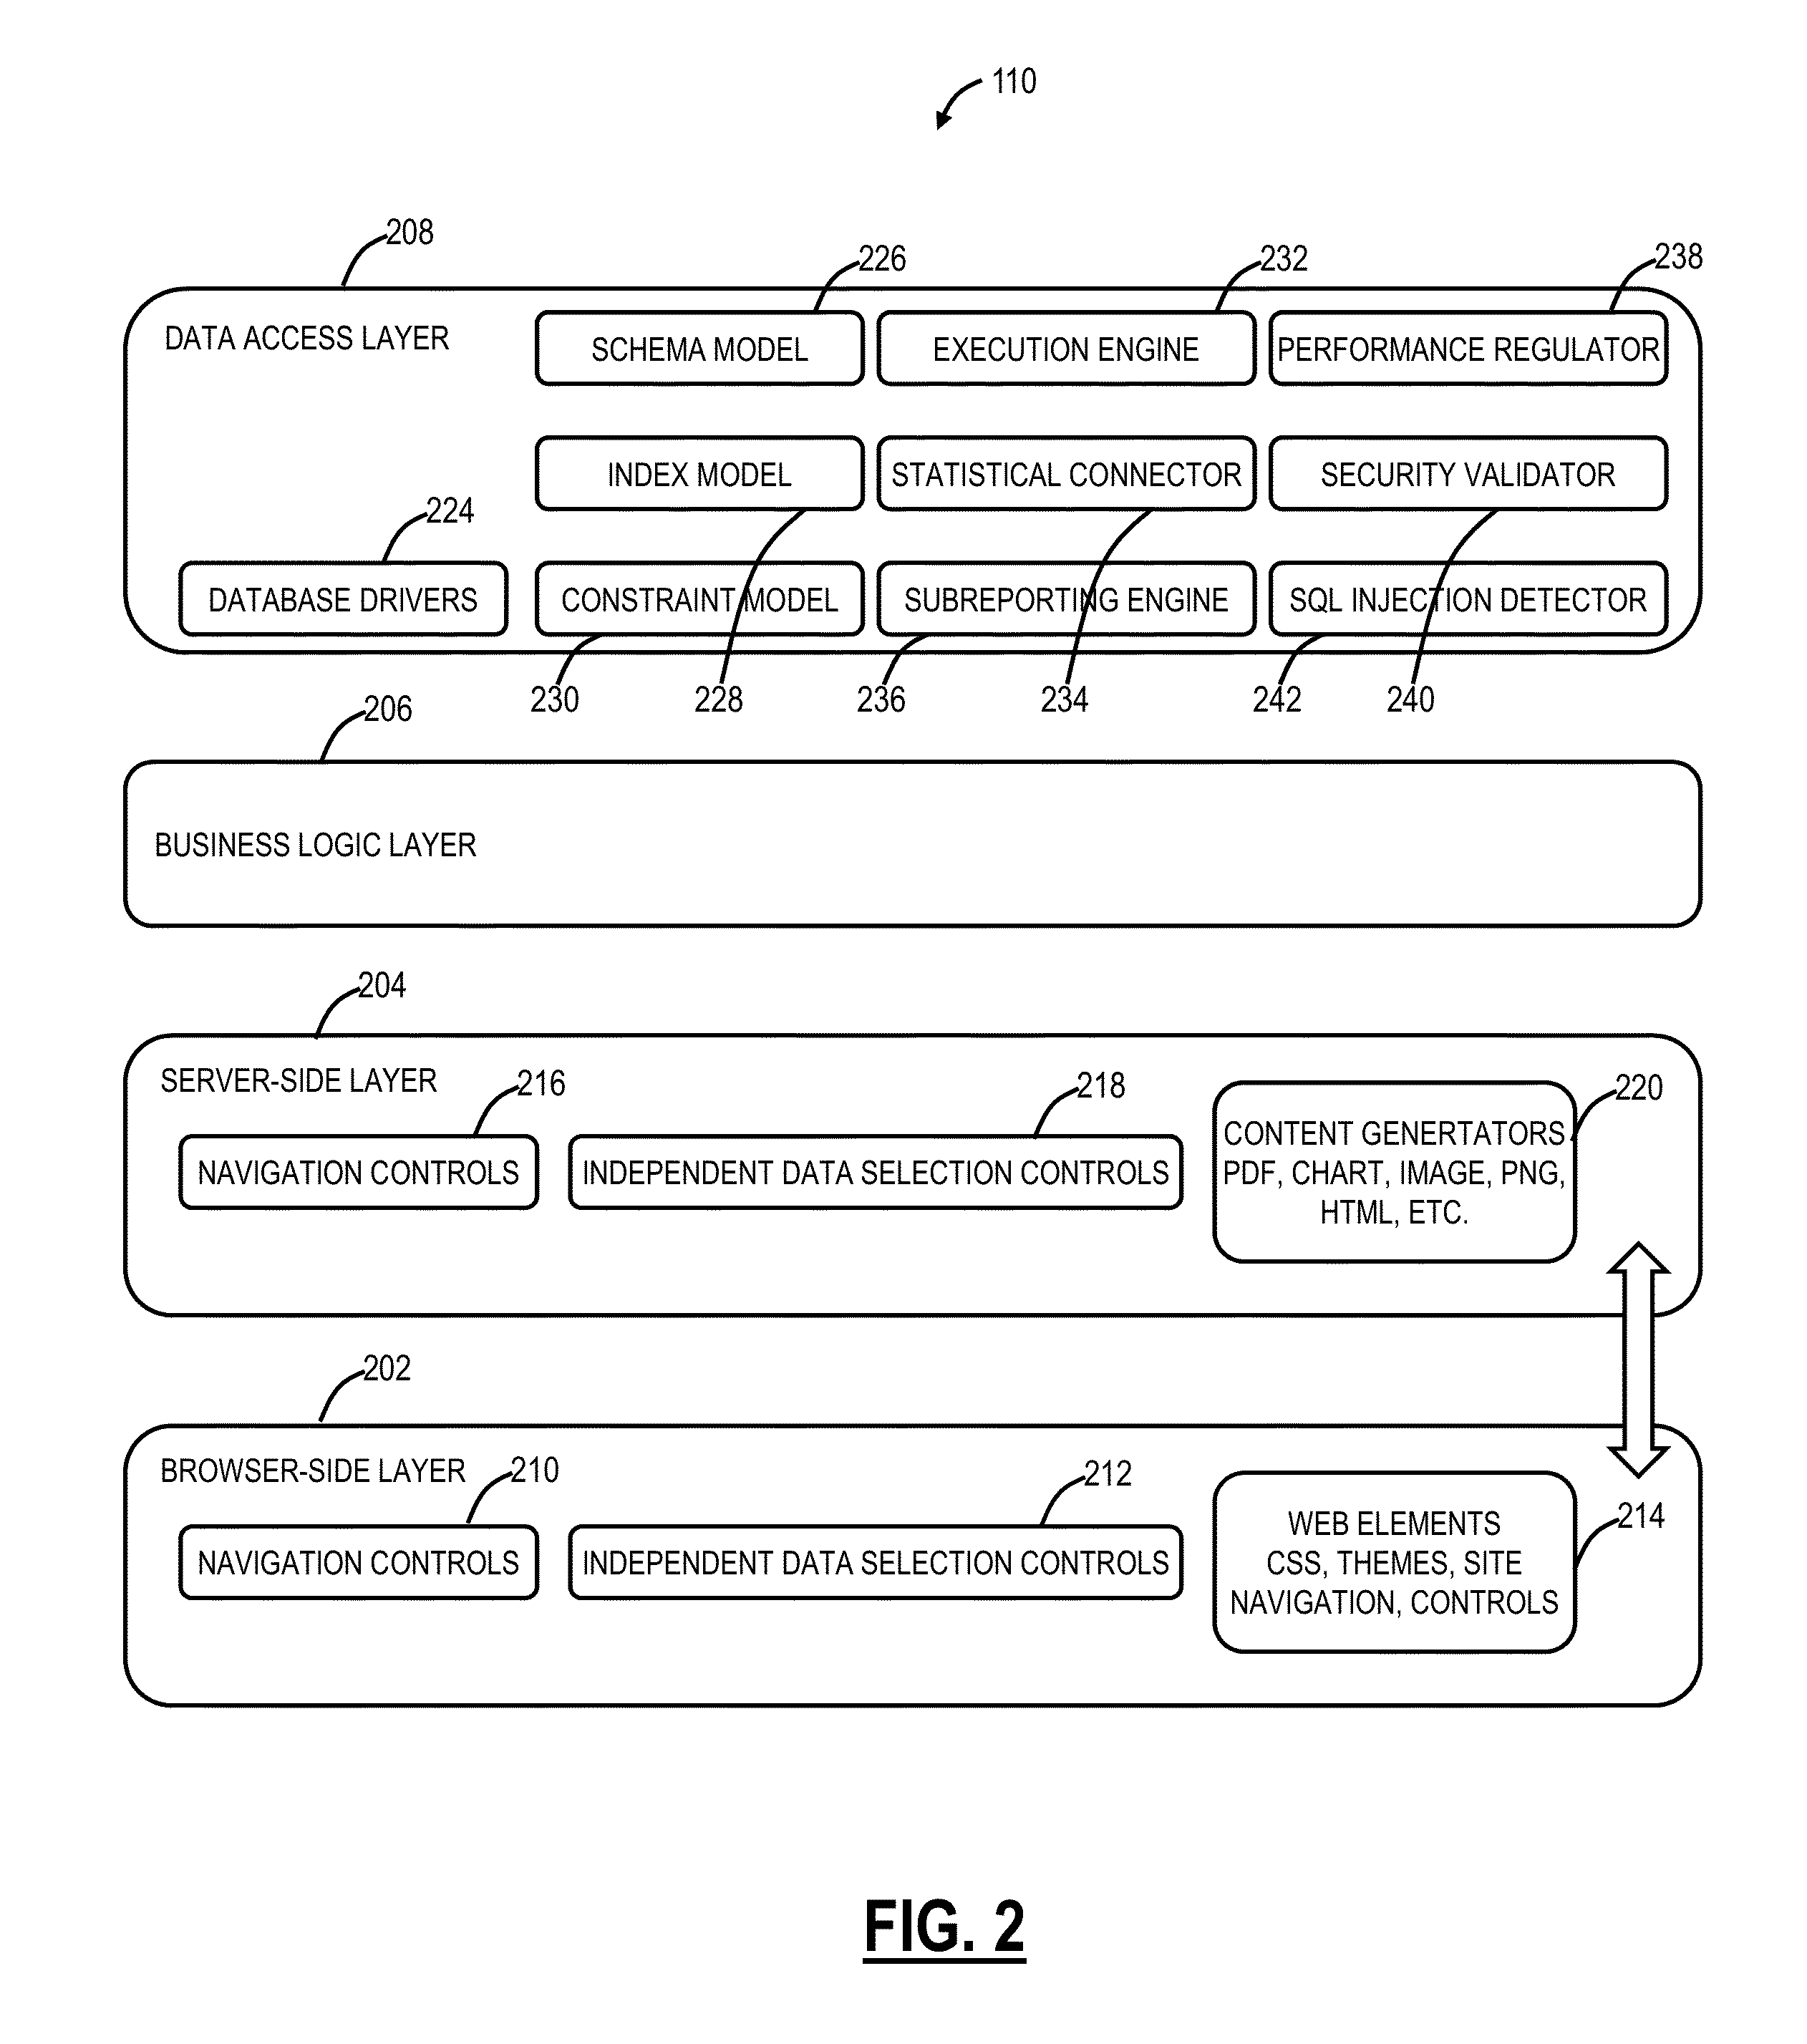
[0018]In various exemplary embodiments, the present disclosure relates to systems and methods for automatic interactive visualizations. Specifically, the systems and methods provide a “one-click” or even “no-click” automatic visualization of data, through a Web browser, for users with little or no IT expertise (versus, for example, spreadsheet programs which may provide visualizations, but only after a multitude of “clicks”). The systems and methods utilize various heuristics to make decisions, in real-time, for users on how to visualize a selected data set. The systems and methods contemplate user operation over a browser, with the systems and methods abstracting SQL, JavaScript Object Notation (JSON) schema, etc. Thus, output from the user's browser session, client-generated JSON can be provided to a backend for visualizations of the data set. The systems and methods allow a user, e.g., a business user, to generate detailed visualizations in short order, with an ability to modify ...


PUM


Abstract

Systems and methods for interactive visualizations include receiving a selection of data through the reporting system, wherein the data is contained in a database with the reporting system interfacing the database; determining an associated visualization for the selected data based on heuristics, wherein the heuristics are a set of rules used to determine the associated visualization in a manner that is most appropriate for visual analytics given the selected data; and creating and displaying the associated visualization.

Description

CROSS-REFERENCE TO RELATED APPLICATIONS[0001]The present non-provisional patent application is a continuation-in-part of U.S. patent application Ser. No. 12 / 907,184, filed Oct. 19, 2010, and entitled “SELF-SERVICE DATABASE REPORTING SYSTEMS AND METHODS,” the contents of which are incorporated by reference herein.FIELD OF THE DISCLOSURE[0002]The present disclosure relates generally to data reporting and analytic systems and methods. More particularly, the present disclosure relates to systems and methods for automatic interactive visualizations.BACKGROUND OF THE DISCLOSURE[0003]Data analytics is a process of inspecting, cleaning, transforming, and modeling data with the goal of discovering useful information, suggesting conclusions, and supporting decision-making Data analysis has multiple facets and approaches, encompassing diverse techniques under a variety of names, in different business, science, and social science domains. One aspect of data analytics is visualization or visual ...

Claims


Application Information

Patent Timeline
IPC IPC(8): G06T11/20G06Q40/00
CPCG06Q40/00G06T11/20G06F16/972G06F16/252
Inventor BHATIA, SANJAY
Owner IZENDA
Features
  • R&D
  • Intellectual Property
  • Life Sciences
  • Materials
  • Tech Scout
  • Unparalleled Data Quality
  • Higher Quality Content
  • 60% Fewer Hallucinations
Learn More