
System and method for monitoring multi-domain network using layered visualization

a multi-domain network and visualization technology, applied in the field of system and method for monitoring multi-domain networks, can solve the problems of not being able to isolate and identify the exact layer,

Active Publication Date: 2017-10-05
CANGO NETWORKS PVT LTD
View PDF0 Cites 8 Cited by
  • Summary
  • Abstract
  • Description
  • Claims
  • Application Information

AI Technical Summary

Benefits of technology

The patent describes how software can analyze different parts of a computer network to find out which part is slowing down the whole system. This helps to fix any problems that might arise.

Problems solved by technology

This patent describes a new way to monitor networks made up of many different parts called domains. These domains have their own functions and tasks within the overall network, but they communicate with each other regularly. When something goes wrong in the network, such as when someone tries to log into a server, the system detects this quickly and alerts users about it. One challenge is finding the actual source of the problem because all the different domains interact constantly. Another goal is reducing the amount of time needed to fix issues in order to maintain optimal network performance.

Method used


Image

  • System and method for monitoring multi-domain network using layered visualization
  • System and method for monitoring multi-domain network using layered visualization
  • System and method for monitoring multi-domain network using layered visualization

Examples


Embodiment Construction

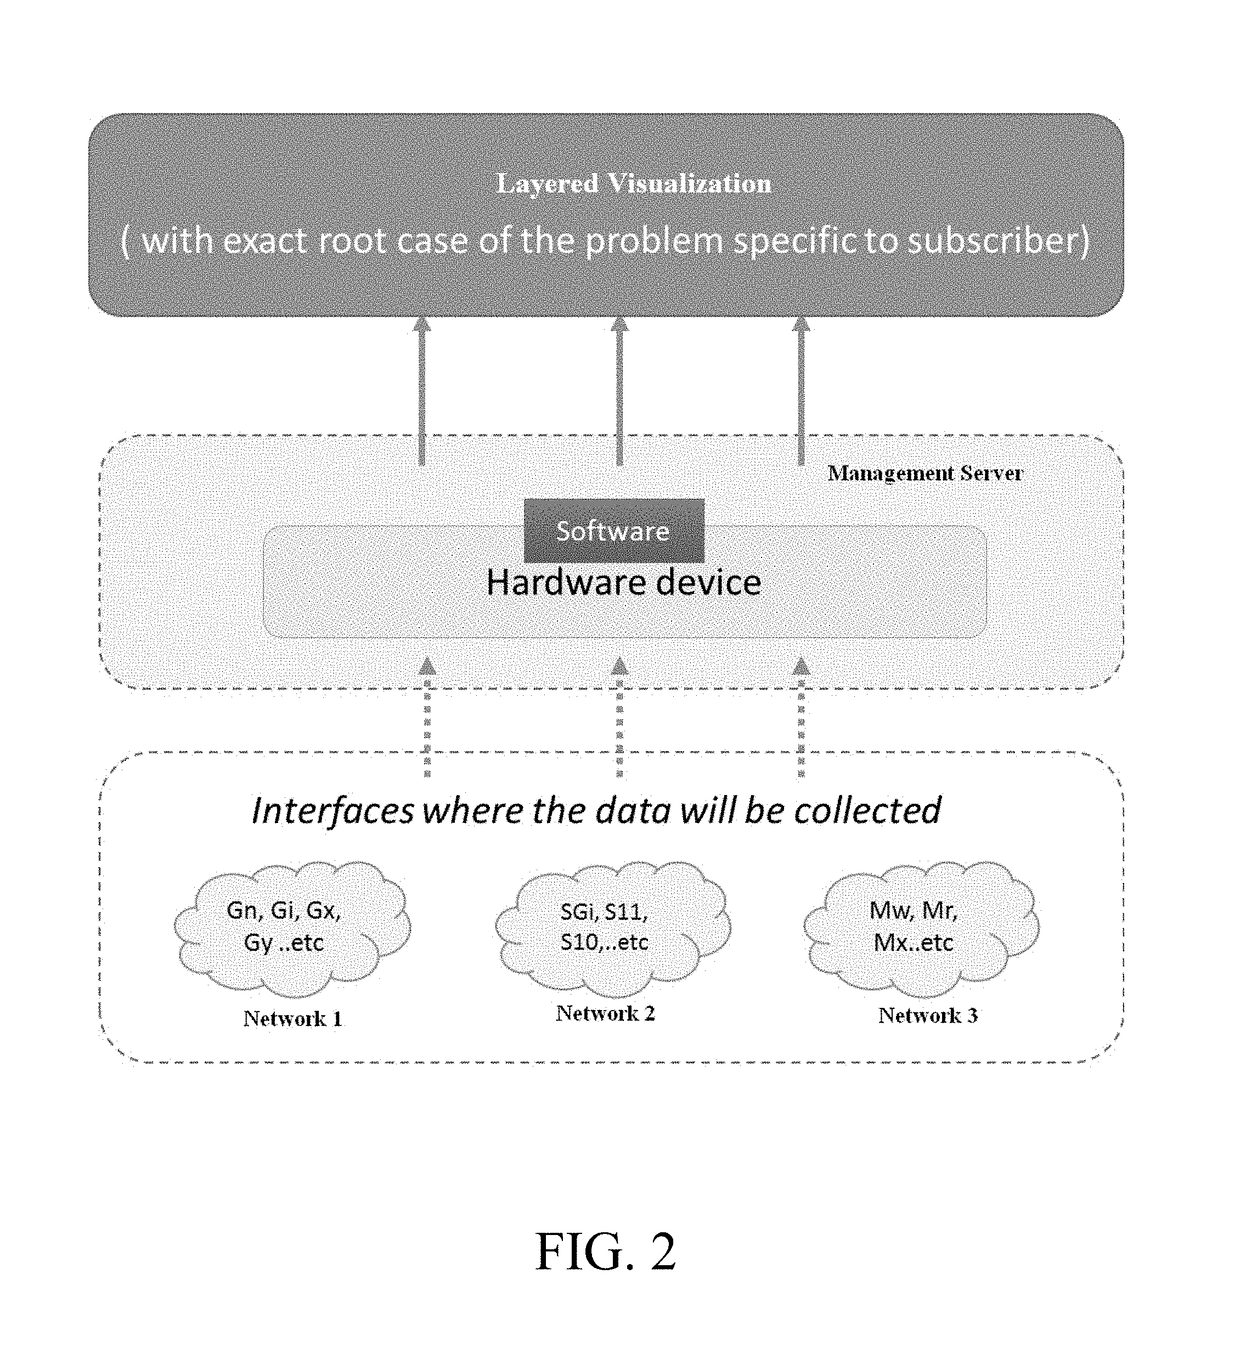
[0050]The present invention is thus directed to system and method for monitoring multi-domain network in real time, which generates end-to-end visualization identifying the exact root cause of network element causing degradation. Further, the present invention reduces Mean Time to Repair (MTTR) in case of outage in the network.

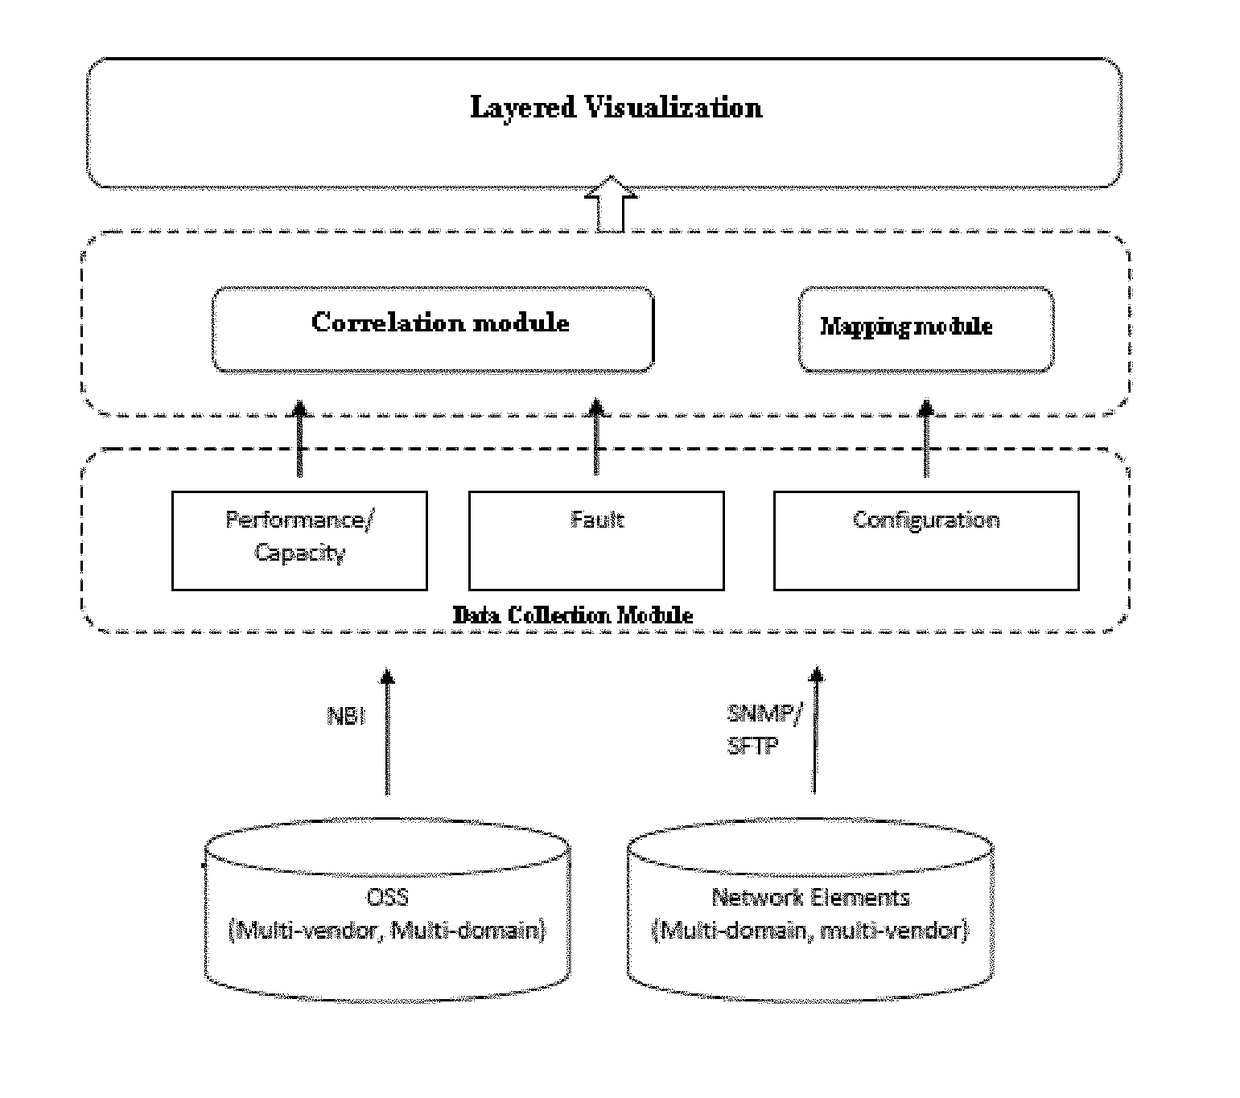
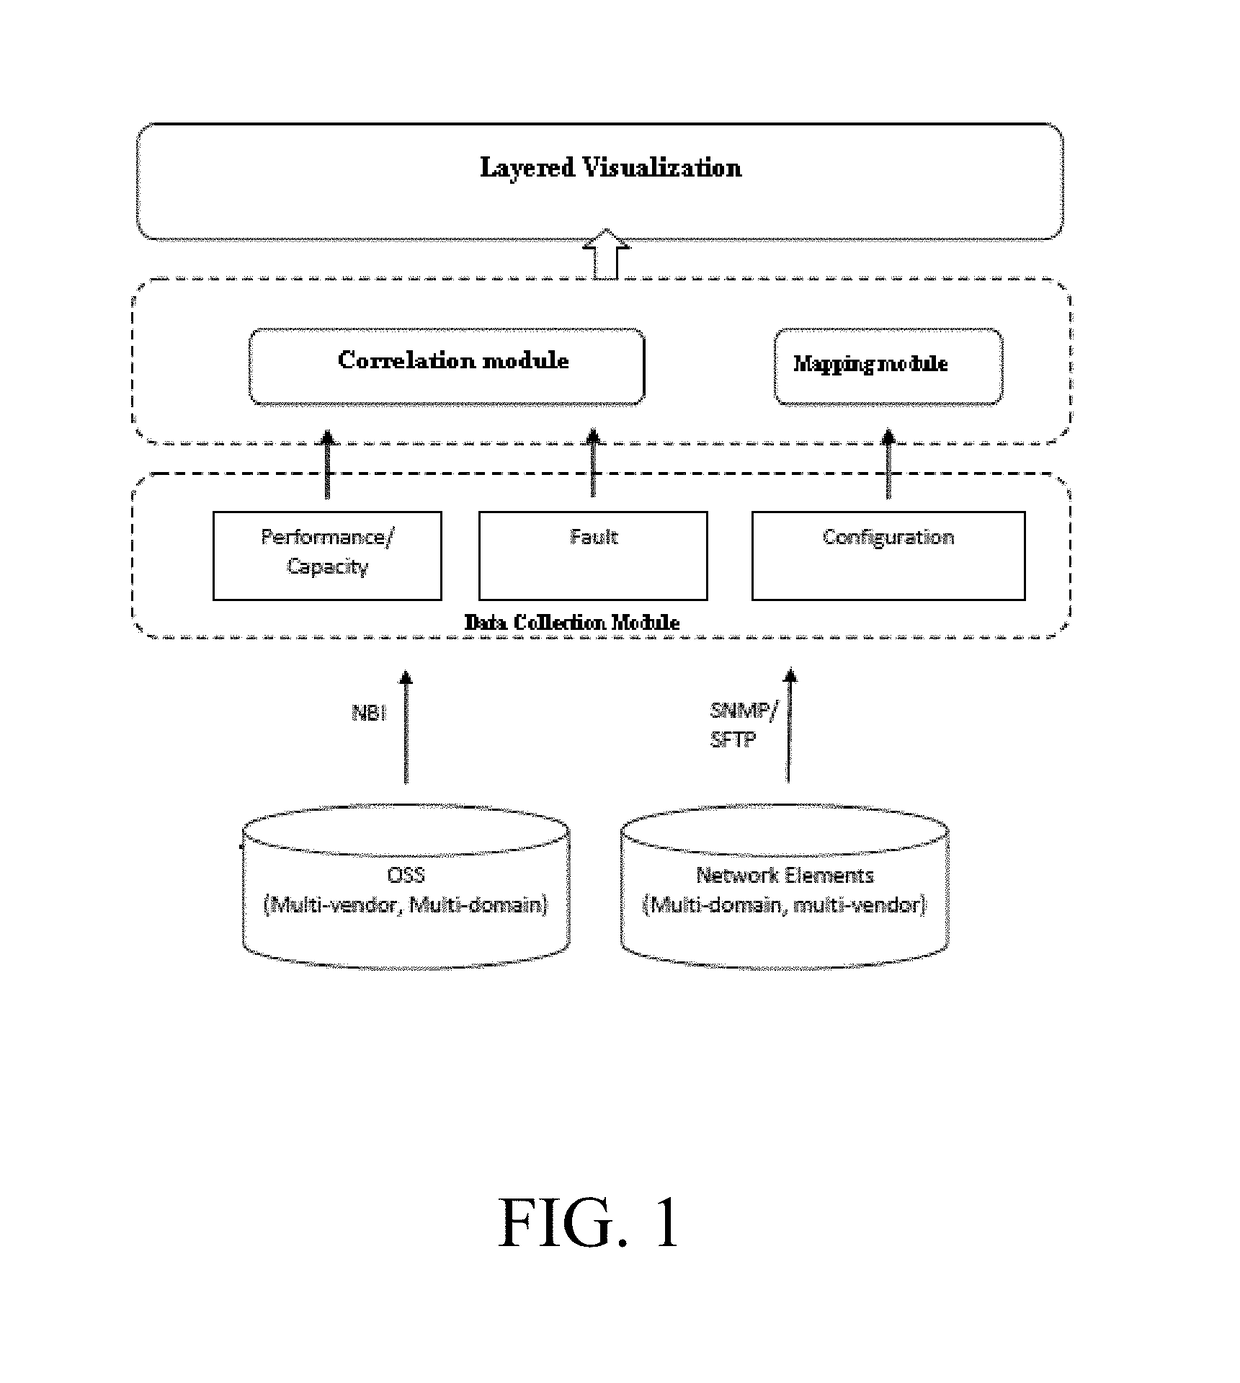
[0051]Referring to FIG. 1, a system for monitoring multi-domain network in real time using layered visualization comprises of data collection module; correlation module; mapping module; and management server. The data collection module collects performance data, alarm data and configuration logs from one or more network elements through the management server to draw connectivity across one or more layers from multiple vendors across multiple domains. The performance data includes measurements having statistical count on every action encountered in the network. The alarm data includes fault event occurrences within the network. The correlation module correlates...


PUM


Abstract

The present invention relates to a system and method for monitoring multi-domain network using end-to-end layered visualization to identify exact root cause of network element to prevent degradation in the network performance is disclosed. The system comprises of data collection module, correlation module, mapping module and management server. The data collection module collects performance data, alarm data, configuration logs and signalling traces from one or more network elements through the management server to draw connectivity across one or more layers. The correlation module correlates the collected performance data, alarm data and configuration logs at regular intervals in order to isolate the root cause of the issue identified. This correlated data of all the network elements are superimposed with layered visualization and mapped by the mapping module and thereby identify the exact root cause of network element causing degradation in the network performance.

Description


Claims


Application Information

Patent Timeline
Owner CANGO NETWORKS PVT LTD
Learn More