Methods and apparatus for an improved control parameter value indicator

a parameter value indicator and indicator technology, applied in the field of electronic instruments, can solve the problems of increasing display complexity, inability to achieve the goals of achieving the goals of achieving the goals of achieving the goals of achieving the goals of achieving the goals of achieving the goals of achieving the goals of achieving the goals of achieving the goals of achieving the goals of achieving the goals of achieving the goals of achieving the goals of achieving the goals of achieving the goals of achieving the goals o

Inactive Publication Date: 2000-09-12
HONEYWELL INC
View PDF11 Cites 78 Cited by
  • Summary
  • Abstract
  • Description
  • Claims
  • Application Information

AI Technical Summary

Problems solved by technology

One area in particular that has experienced an increase in display complexity is the field of electronic flight system instrumentation.
As instrument panel space is limited, achieving these goals can be quite difficult for designers faced with presenting a large amount of information within a relatively small space.
As a result of these and other challenges, present-day instrumentation systems are inadequate in many respects.
For example, it is often difficult for an operator to judge whether a control input is set to a desired reference value.
Not surprisingly, it is extremely

Method used


Image

  • Methods and apparatus for an improved control parameter value indicator
  • Methods and apparatus for an improved control parameter value indicator
  • Methods and apparatus for an improved control parameter value indicator

Examples


Embodiment Construction

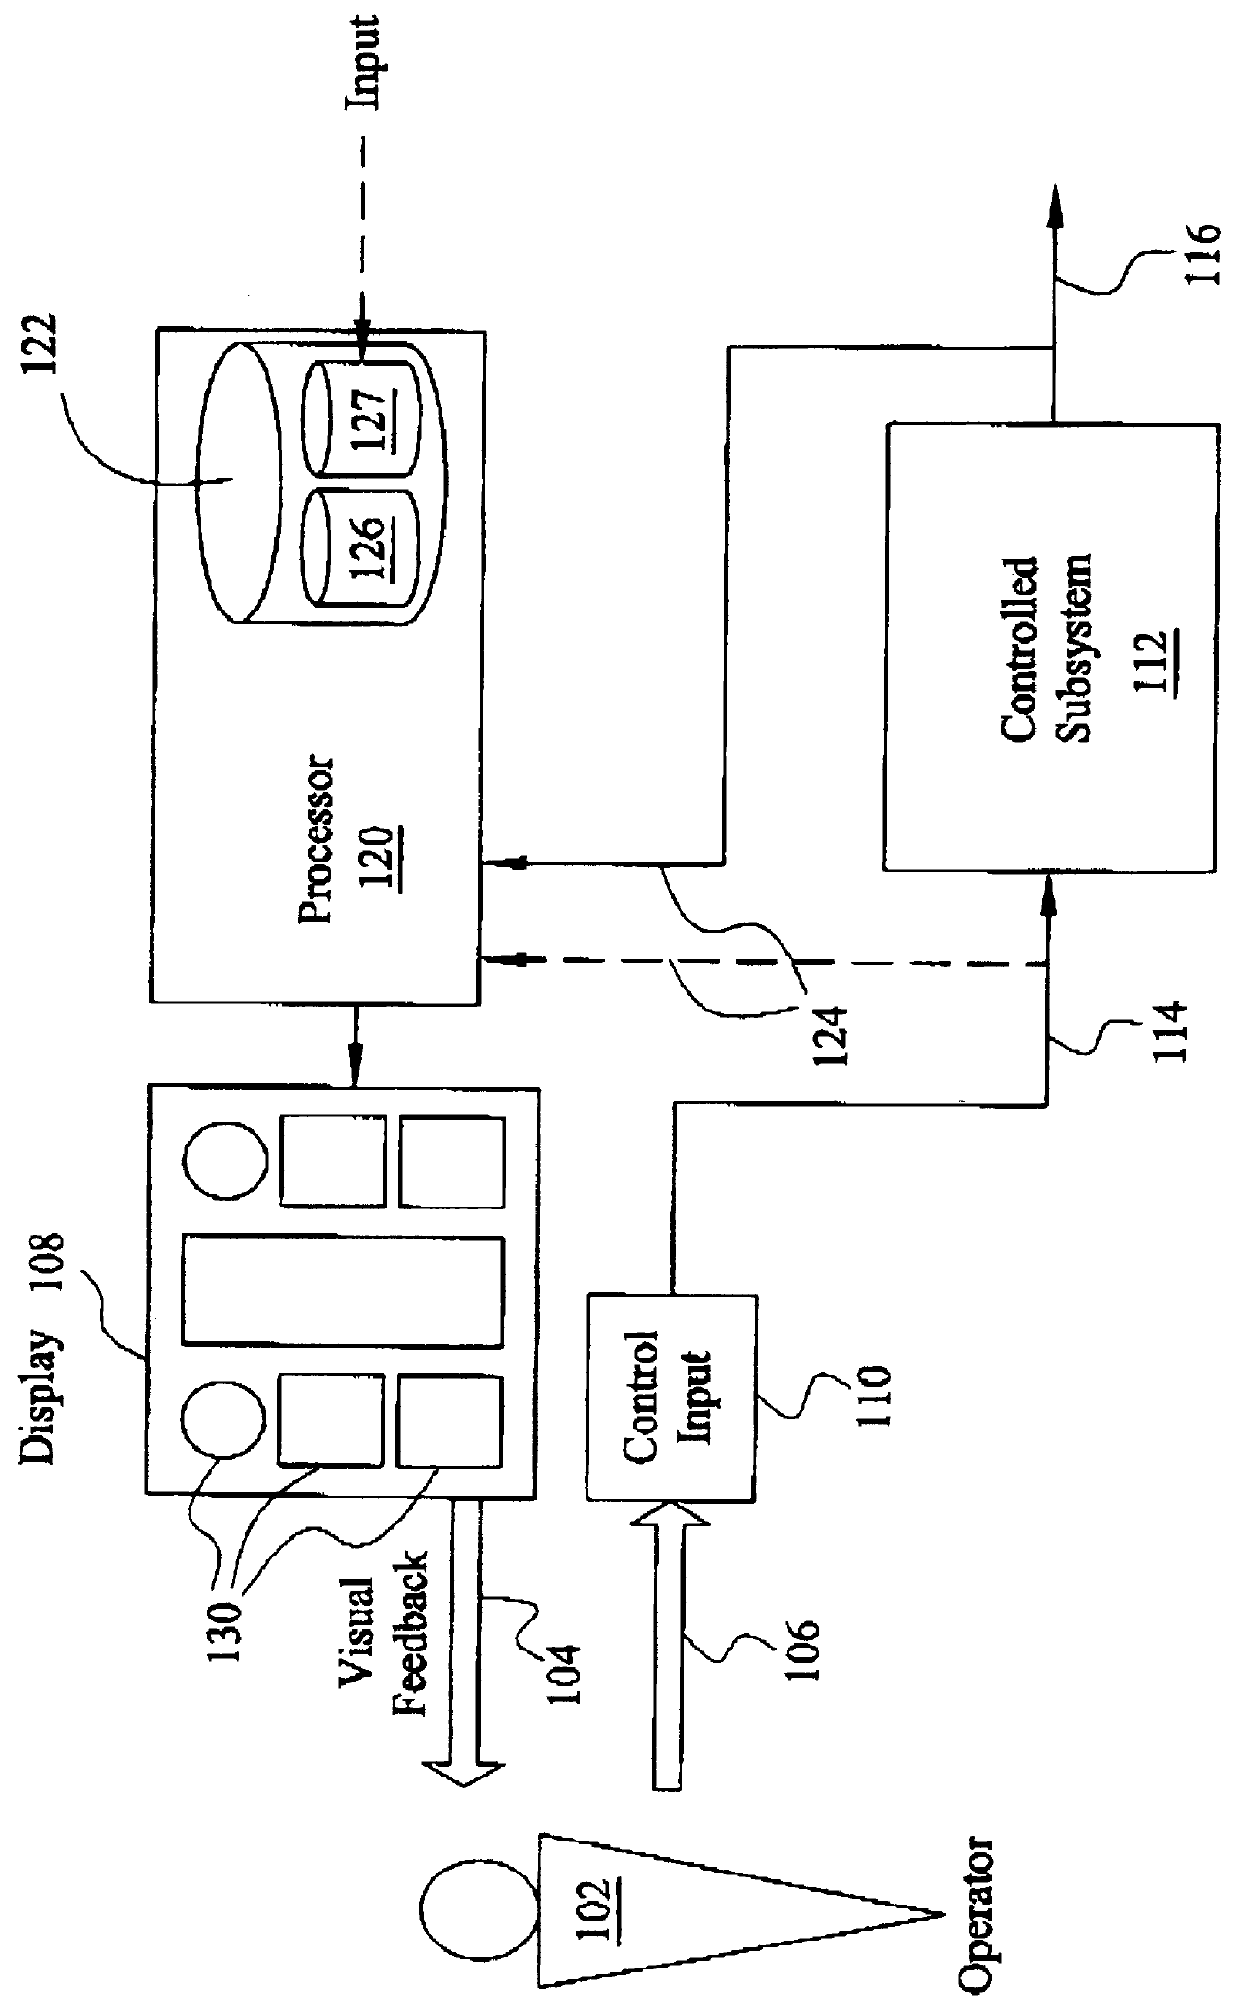
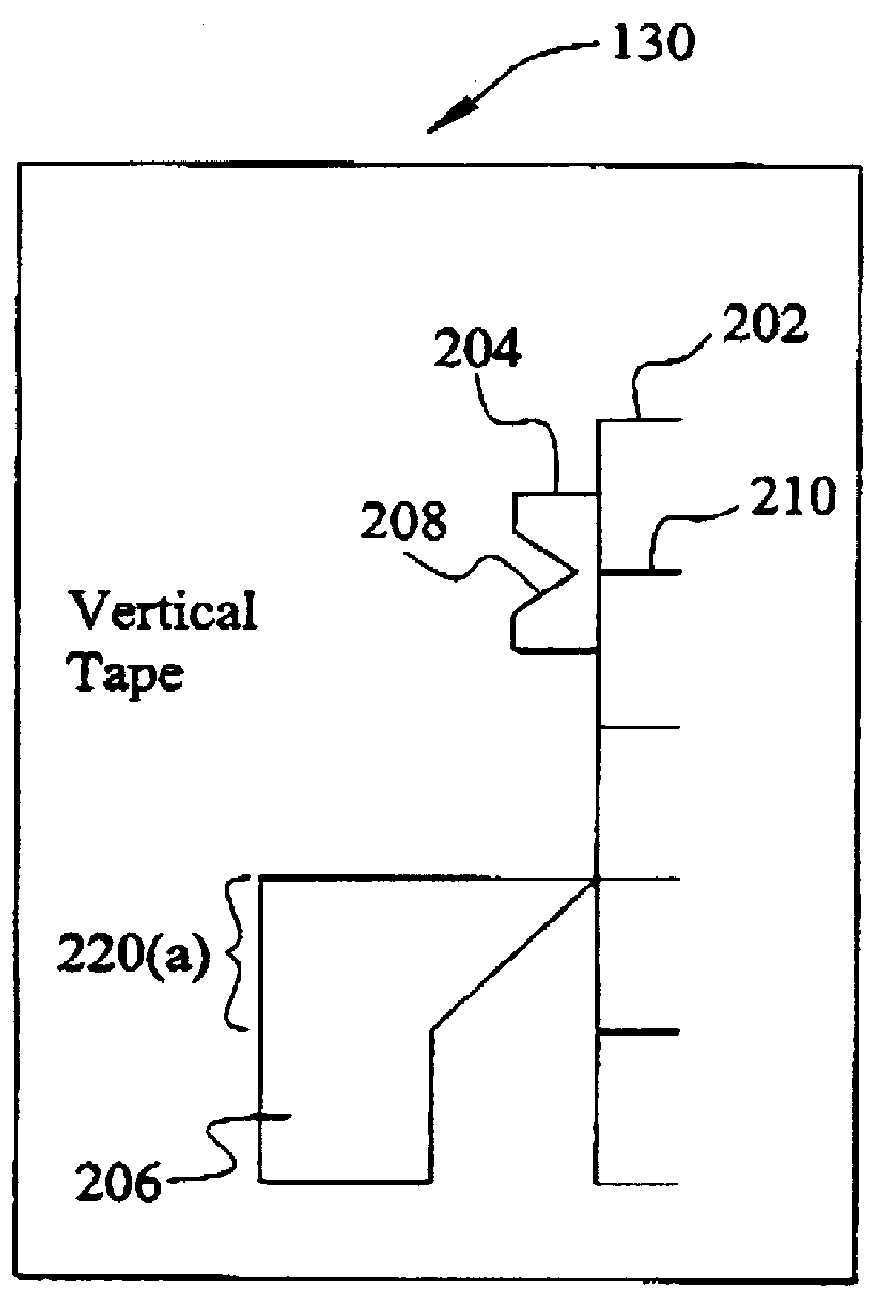
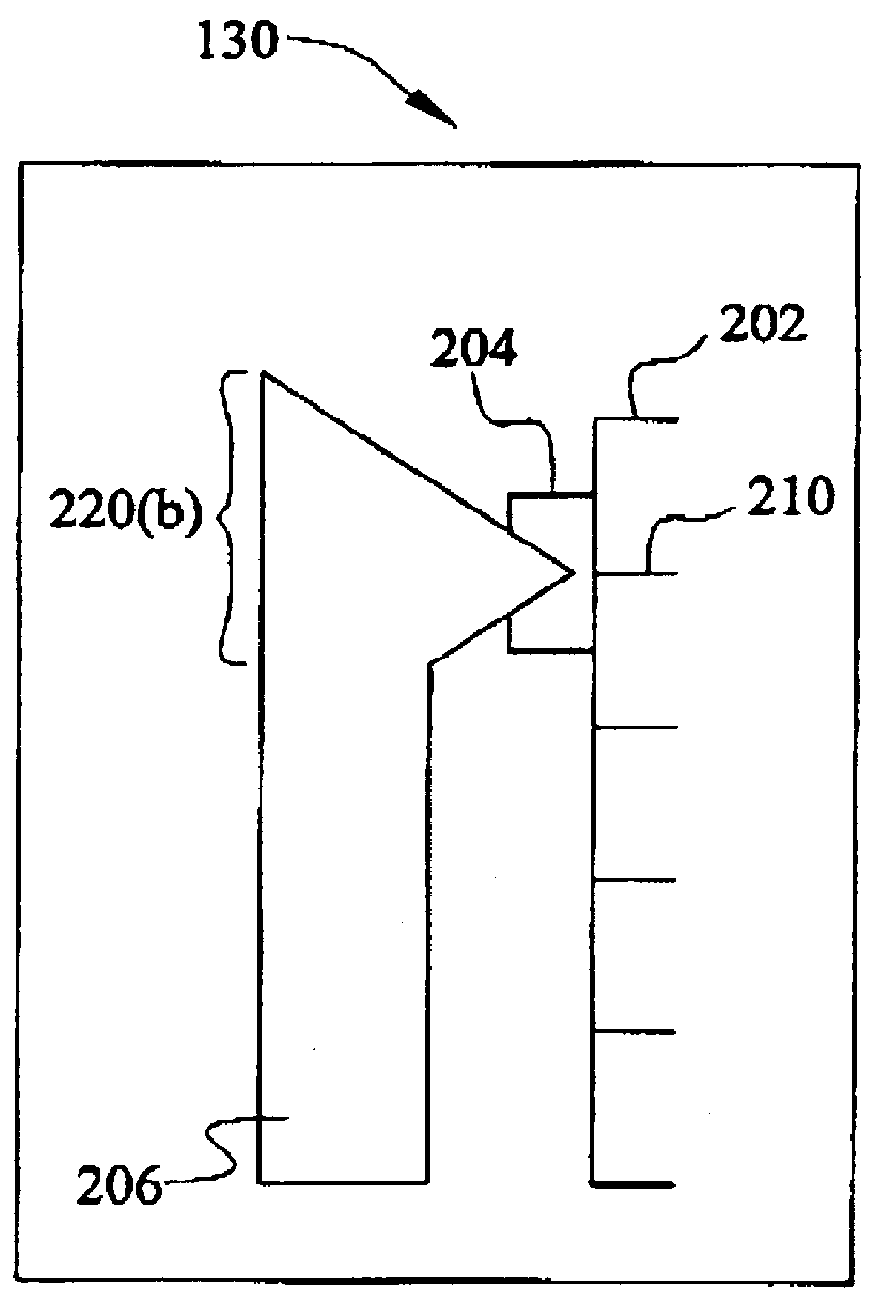
A display in accordance with various aspects of the present invention includes an indicator whose graphical configuration varies in accordance with whether the relevant control value is within a predetermined tolerance range of a set-point value. While many of the embodiments described below are set within the context of commercial flight systems and aviation instrumentation, the present invention may be advantageously employed in any other context where a human operator requires real-time visual feedback relating to a control input. For example, the disclosed methods may be employed for the control of automobiles, helicopters, submarines, and other modes of transportation, as well for the control (e.g., virtual control) of industrial equipment. Thus, the use of flight system examples and an aviation lexicon are not meant as limitations.

Referring now to FIG. 1, a display system illustrative of various aspects of the present invention interfaces with an operator 102 (e.g., a human op...


PUM


Abstract

Accurate, unambiguous, and space-efficient electronic display techniques are provided for presenting the operator with an indicator whose graphical configuration varies in accordance with whether the relevant control value is within a predetermined tolerance range of a set-point value. More particularly, a control value indicator includes a scale having an axis associated with the control value, a set-point marker placed at a first position along the scale for indicating the set-point value, and a pointer having a second position along the scale for indicating the control value. The pointer and/or the set-point marker exhibit a first graphical configuration corresponding to the case where the control value is not within the predetermined tolerance of the set-point value, and a second graphical configuration corresponding to the case where the control value is within the predetermined tolerance of the set-point value.

Description

1. Field of the InventionThe present invention relates, generally, to electronic instrumentation such as electronic flight control instrumentation and, more particularly, to displays incorporating improved visual cues for indicating to an operator that a manual control input has been set to a desired set-point value within a predetermined tolerance.2. Description of Related ArtElectronic instrumentation displays continue to advance in sophistication, achieving increasingly higher levels of information density and, consequently, presenting a greater amount of visual information to be perceived and understood by the operator. In many applications, it is critical that visual displays provide a proper cognitive mapping between what the operator is trying to achieve and the information available to accomplish the task. As a result, such systems increasingly utilize human-factor design principles in order to build instrumentation and controls that work cooperatively with human operators.O...

Claims


Application Information

Patent Timeline
IPC IPC(8): G01D7/04G01D7/02G01C23/00
CPCG01C23/00G01D7/04
Inventor LEARD, THOMAS M.GILMORE, JOHN P.
Owner HONEYWELL INC
Why Eureka
Try Eureka