
Automatic method for determining piecewise linear transformation from an image histogram

an image histogram and linear transformation technology, applied in image enhancement, instruments, computing, etc., can solve the problems of scanners affecting quality, scanners affecting quality, and quality affecting quality

Inactive Publication Date: 2001-05-22
XEROX CORP
View PDF4 Cites 96 Cited by
  • Summary
  • Abstract
  • Description
  • Claims
  • Application Information

AI Technical Summary

Benefits of technology

One advantage of the present invention is that a tone reproduction curve is automatically generated based on histogram data.
Another advantage of the present invention is that input segments are automatically generated based on an image histogram such that a piecewise linear transformation is obtained.

Problems solved by technology

For example, the scanning station can impact the quality if the optical path of the scanning station is not properly aligned.
Also, the development station can impact the quality if a photoreceptor is not properly cleaned.
For example, the scanner can impact the quality if the scanner is not properly calibrated.
Also, the output (printing) device can impact the quality if a printhead is clogged or a photoreceptor is not properly cleaned.

Method used


Image

  • Automatic method for determining piecewise linear transformation from an image histogram
  • Automatic method for determining piecewise linear transformation from an image histogram
  • Automatic method for determining piecewise linear transformation from an image histogram

Examples


Embodiment Construction

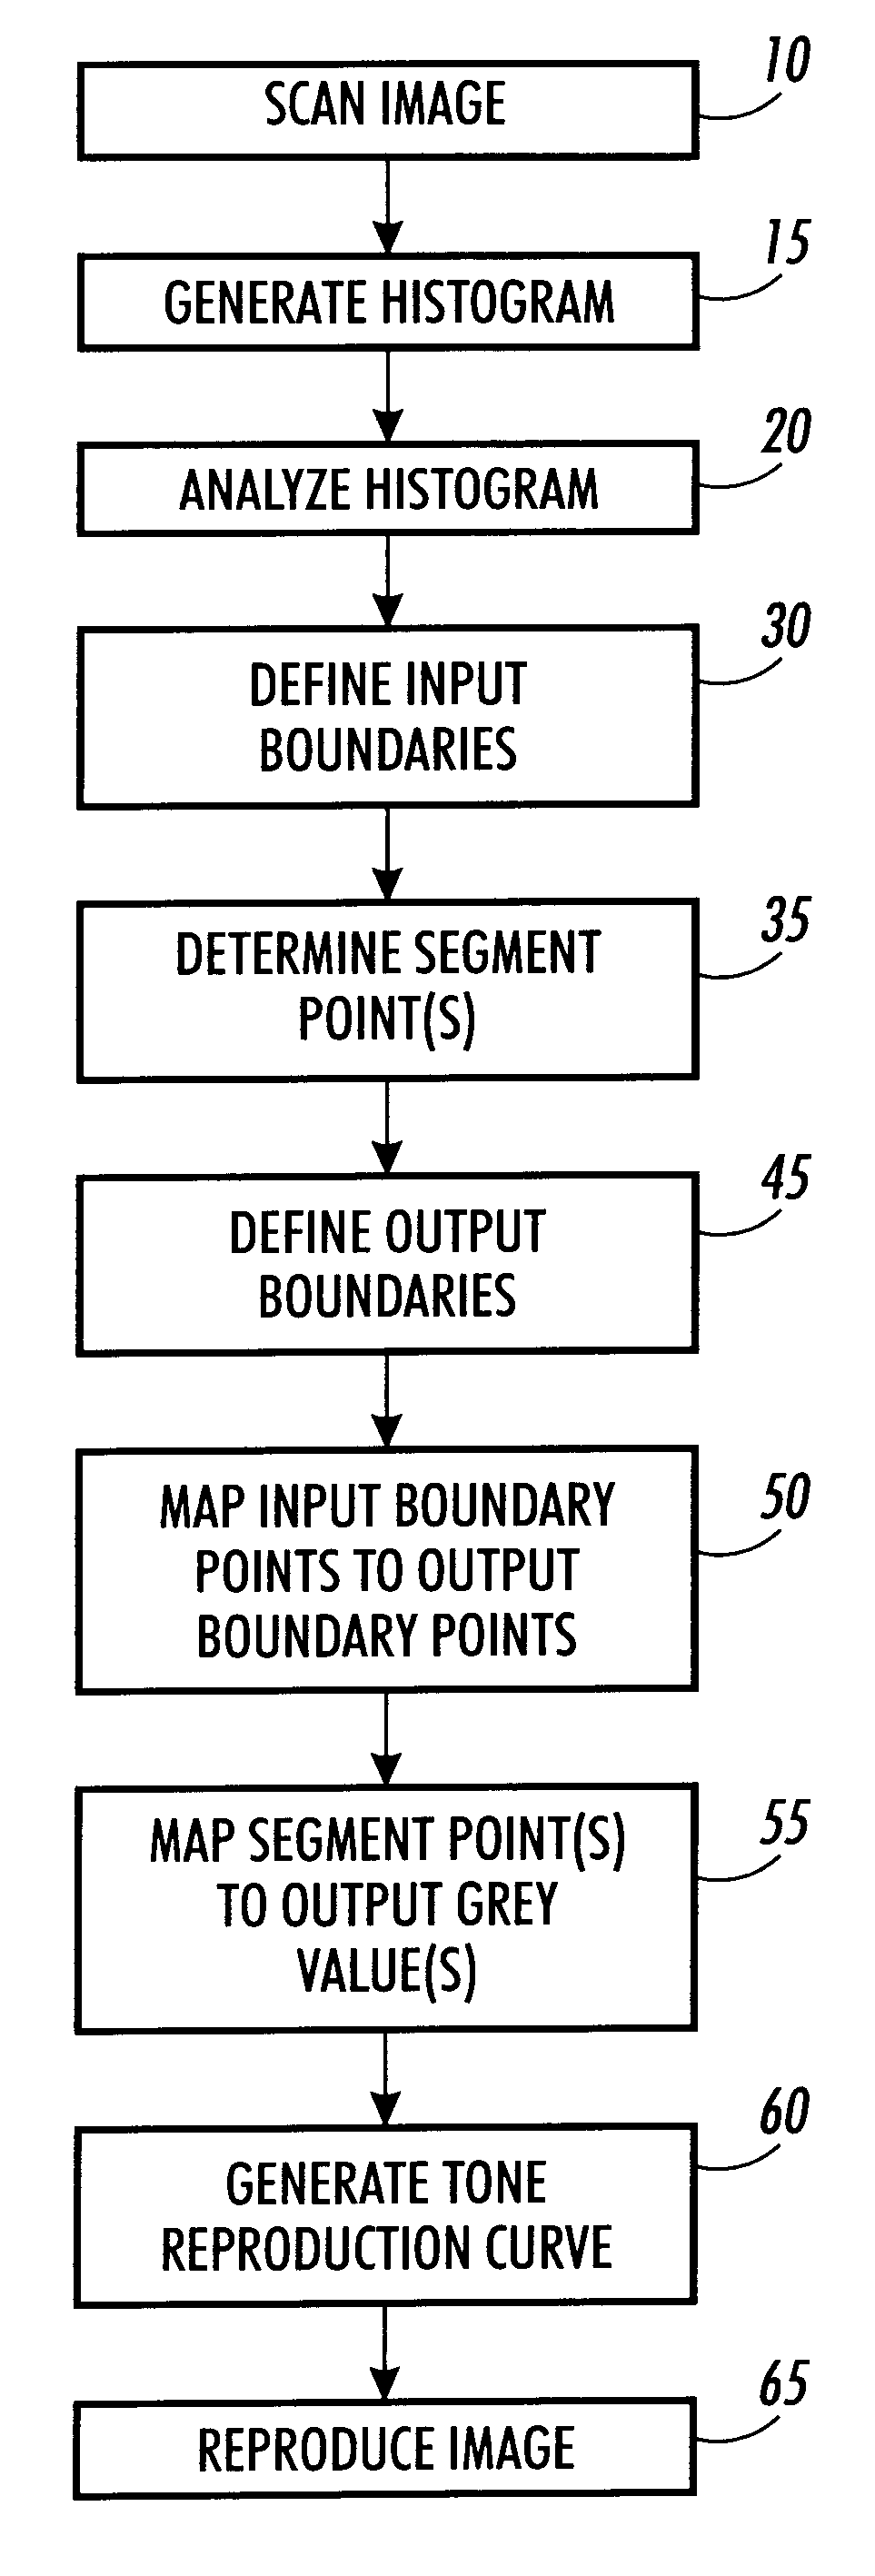
With reference to FIG. 1, an image or document to be reproduced is scanned 10. Video pixel grey values are determined from the scanned image and a histogram distribution is generated 15 representing a frequency of each grey value. The histogram is analyzed 20 to determine characteristic features of the scanned image which will affect the manner in which the image grey values will be mapped to output grey values. Analysis of histograms are described, for example, in U.S. Pat. No. 5,751,848 entitled "A System and Method for Generating and Utilizing Histogram Data From a Scanned Image" which is assigned to the present assignee and is incorporated herein by reference. A tone reproduction curve is generated automatically from the histogram data which maps the input grey values to output grey values.

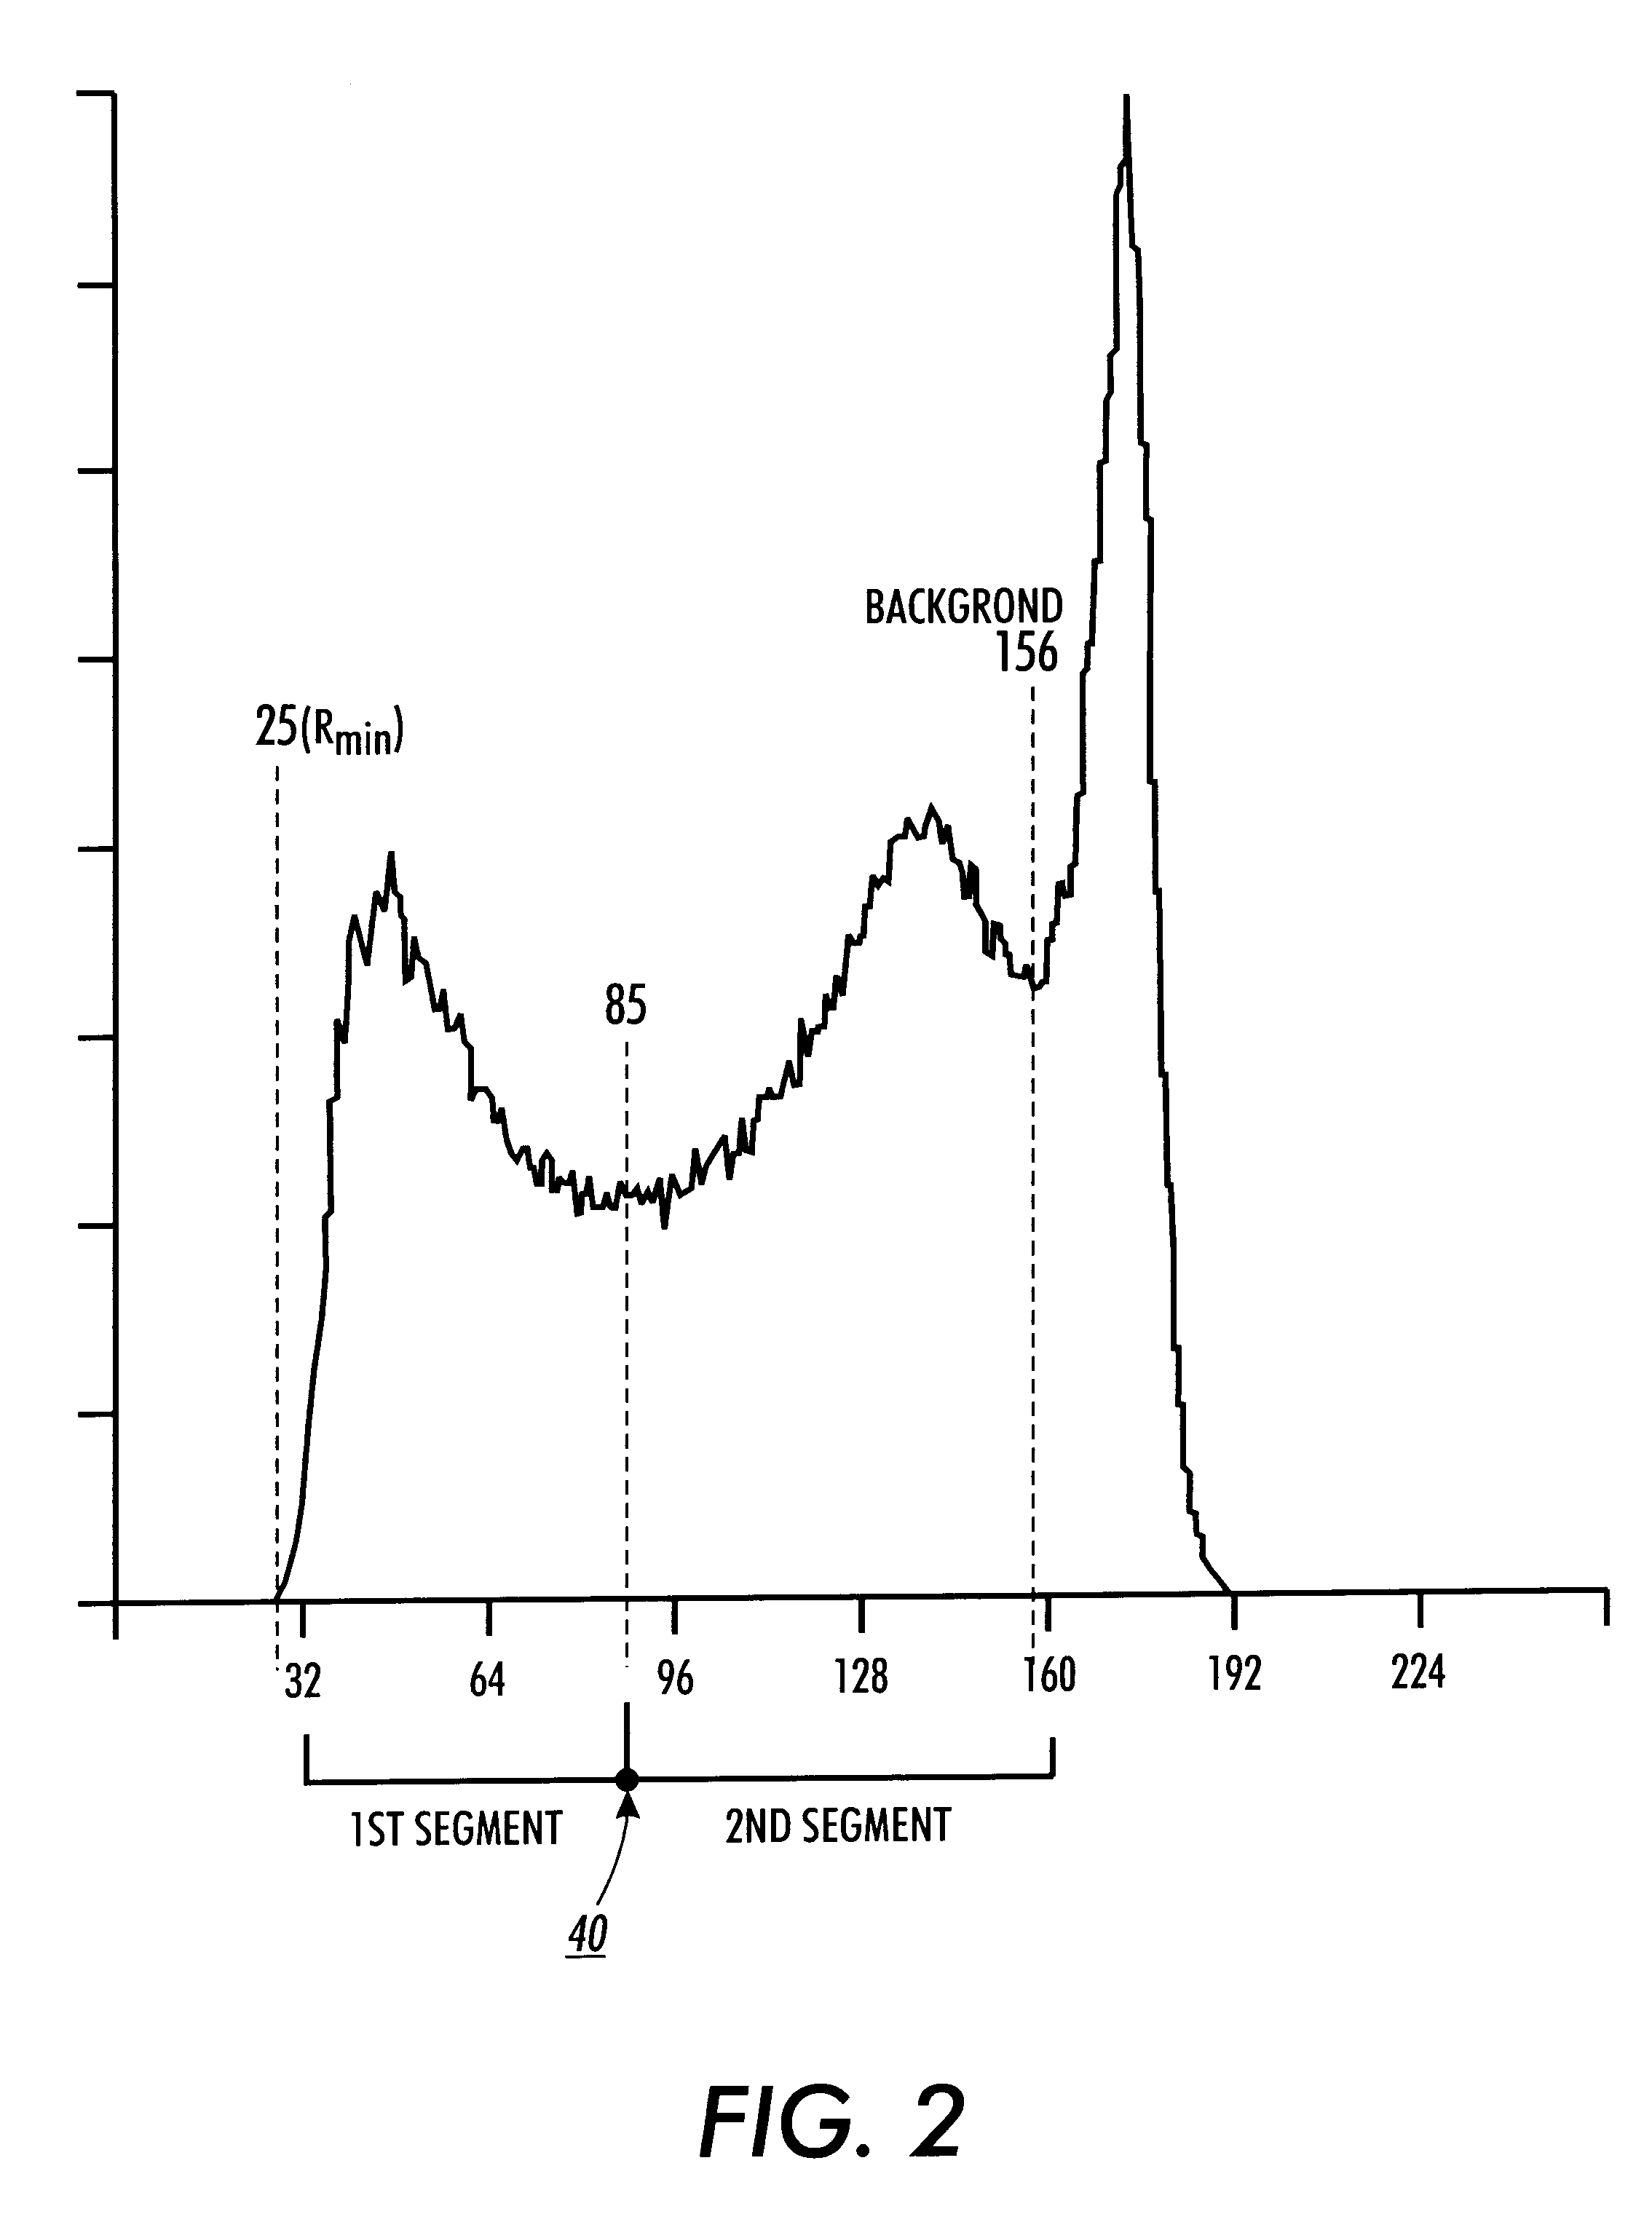
FIG. 2 illustrates an exemplary histogram 25 as generated from a scanned image. The input grey values of the image appear on the x-axis and their frequency of occurrence appears on the y-axis....


PUM


Abstract

An image desired to be reproduced is scanned to determine its video pixel grey values. A histogram generator generates a histogram distribution representing a frequency of the grey values. The histogram distribution is analyzed to determine a minimum and maximum input grey values which define input boundaries. A segment point is computed between the input boundaries based on the histogram data. The segment point defines a plurality of input segments between the input boundaries. A dynamic output range is selected. Each input segment is mapped to an output segment based on a linear transformation for the corresponding segment. In this manner, a tone reproduction curve map having a piecewise linear transformation is automatically generated from the image histogram data.

Description

FIELD OF THE PRESENT INVENTIONThe present invention is directed to the digital imaging arts. It finds particular application to a system and method of automatically generating a tone reproduction curve defining a piecewise linear transformation based on an image histogram and will be described with particular reference thereto.BACKGROUND OF THE PRESENT INVENTIONIn a conventional reproduction machine, a document (image) is scanned so that light reflected from the document causes a latent image of electrical charges to form on a photoreceptor. This latent image is then developed with toner, and the toner is transferred to a recording medium to produce a copy of the scanned document. These systems are commonly referred to as light-lens or non-digital copying systems.The quality of a light-lens reproduction machine is a function of how well the copy matches the original. As is well know, various factors can impact this quality. For example, the scanning station can impact the quality if...

Claims


Application Information

Patent Timeline
IPC IPC(8): G06T5/40H04N1/407G06T1/00G06T5/00
CPCG06T5/40H04N1/4074G06T5/009G06T5/92
Inventor FARRELL, BARBARA L.
Owner XEROX CORP
Learn More