Drug compositions to prevent desensitization of cellular receptors

a technology of desensitization and drug composition, applied in the direction of biocide, instruments, animal husbandry, etc., can solve the problems of inability to accurately predict the response of receptors, the receptor theory fails to describe the observed response, and the phenomenon of rapid desensitization is difficult to model

Inactive Publication Date: 2004-01-06
ENHANCED PHARMA
View PDF6 Cites 11 Cited by
  • Summary
  • Abstract
  • Description
  • Claims
  • Application Information

AI Technical Summary

Problems solved by technology

There have been several modifications and criticisms of receptor theory (see, for example Keen, M.; Testing Models of agonist for G-Protein Coupled Receptors: Trends Pharmacol. Sci. 12, 371-374, 1991), but none of these treatments examined the discrete change induced by ligand binding to two equilibrium states of a receptor and, consequently, no one has developed the instant (and exacting) method for determining actual drug compositions / formulations which effectively prevent desensitization of cellular receptors that are normally and incipiently responsive to a host of agonists.
Careful experimental investigations of several different receptor systems have revealed that receptor theory fails to describe the observed responses in a number of cases.
Also, the phenomenon of rapid desensitization has been difficult to model by modern receptor theories.
The present theories are inadequate for at least two fundamental reasons; first, they fail to describe experimental observations except for limited cases and second, they offer only a "black box" description instead of a physicochemical explanation for receptor response.
Until most recently, no theory has been able to adequately explain how the behavior observed by Geoffrey et al. occurs; and, the utility of mixing competitive antagonists (or partial agonists) with agonists accurately and, therefore, efficiently to prevent receptor desensitization has been all but overlooked.
No quantification methodology is suggested for arriving at proper dosages of the antagonist for consistently achieving this reversal, however.

Method used


Image

  • Drug compositions to prevent desensitization of cellular receptors
  • Drug compositions to prevent desensitization of cellular receptors
  • Drug compositions to prevent desensitization of cellular receptors

Examples


example 1

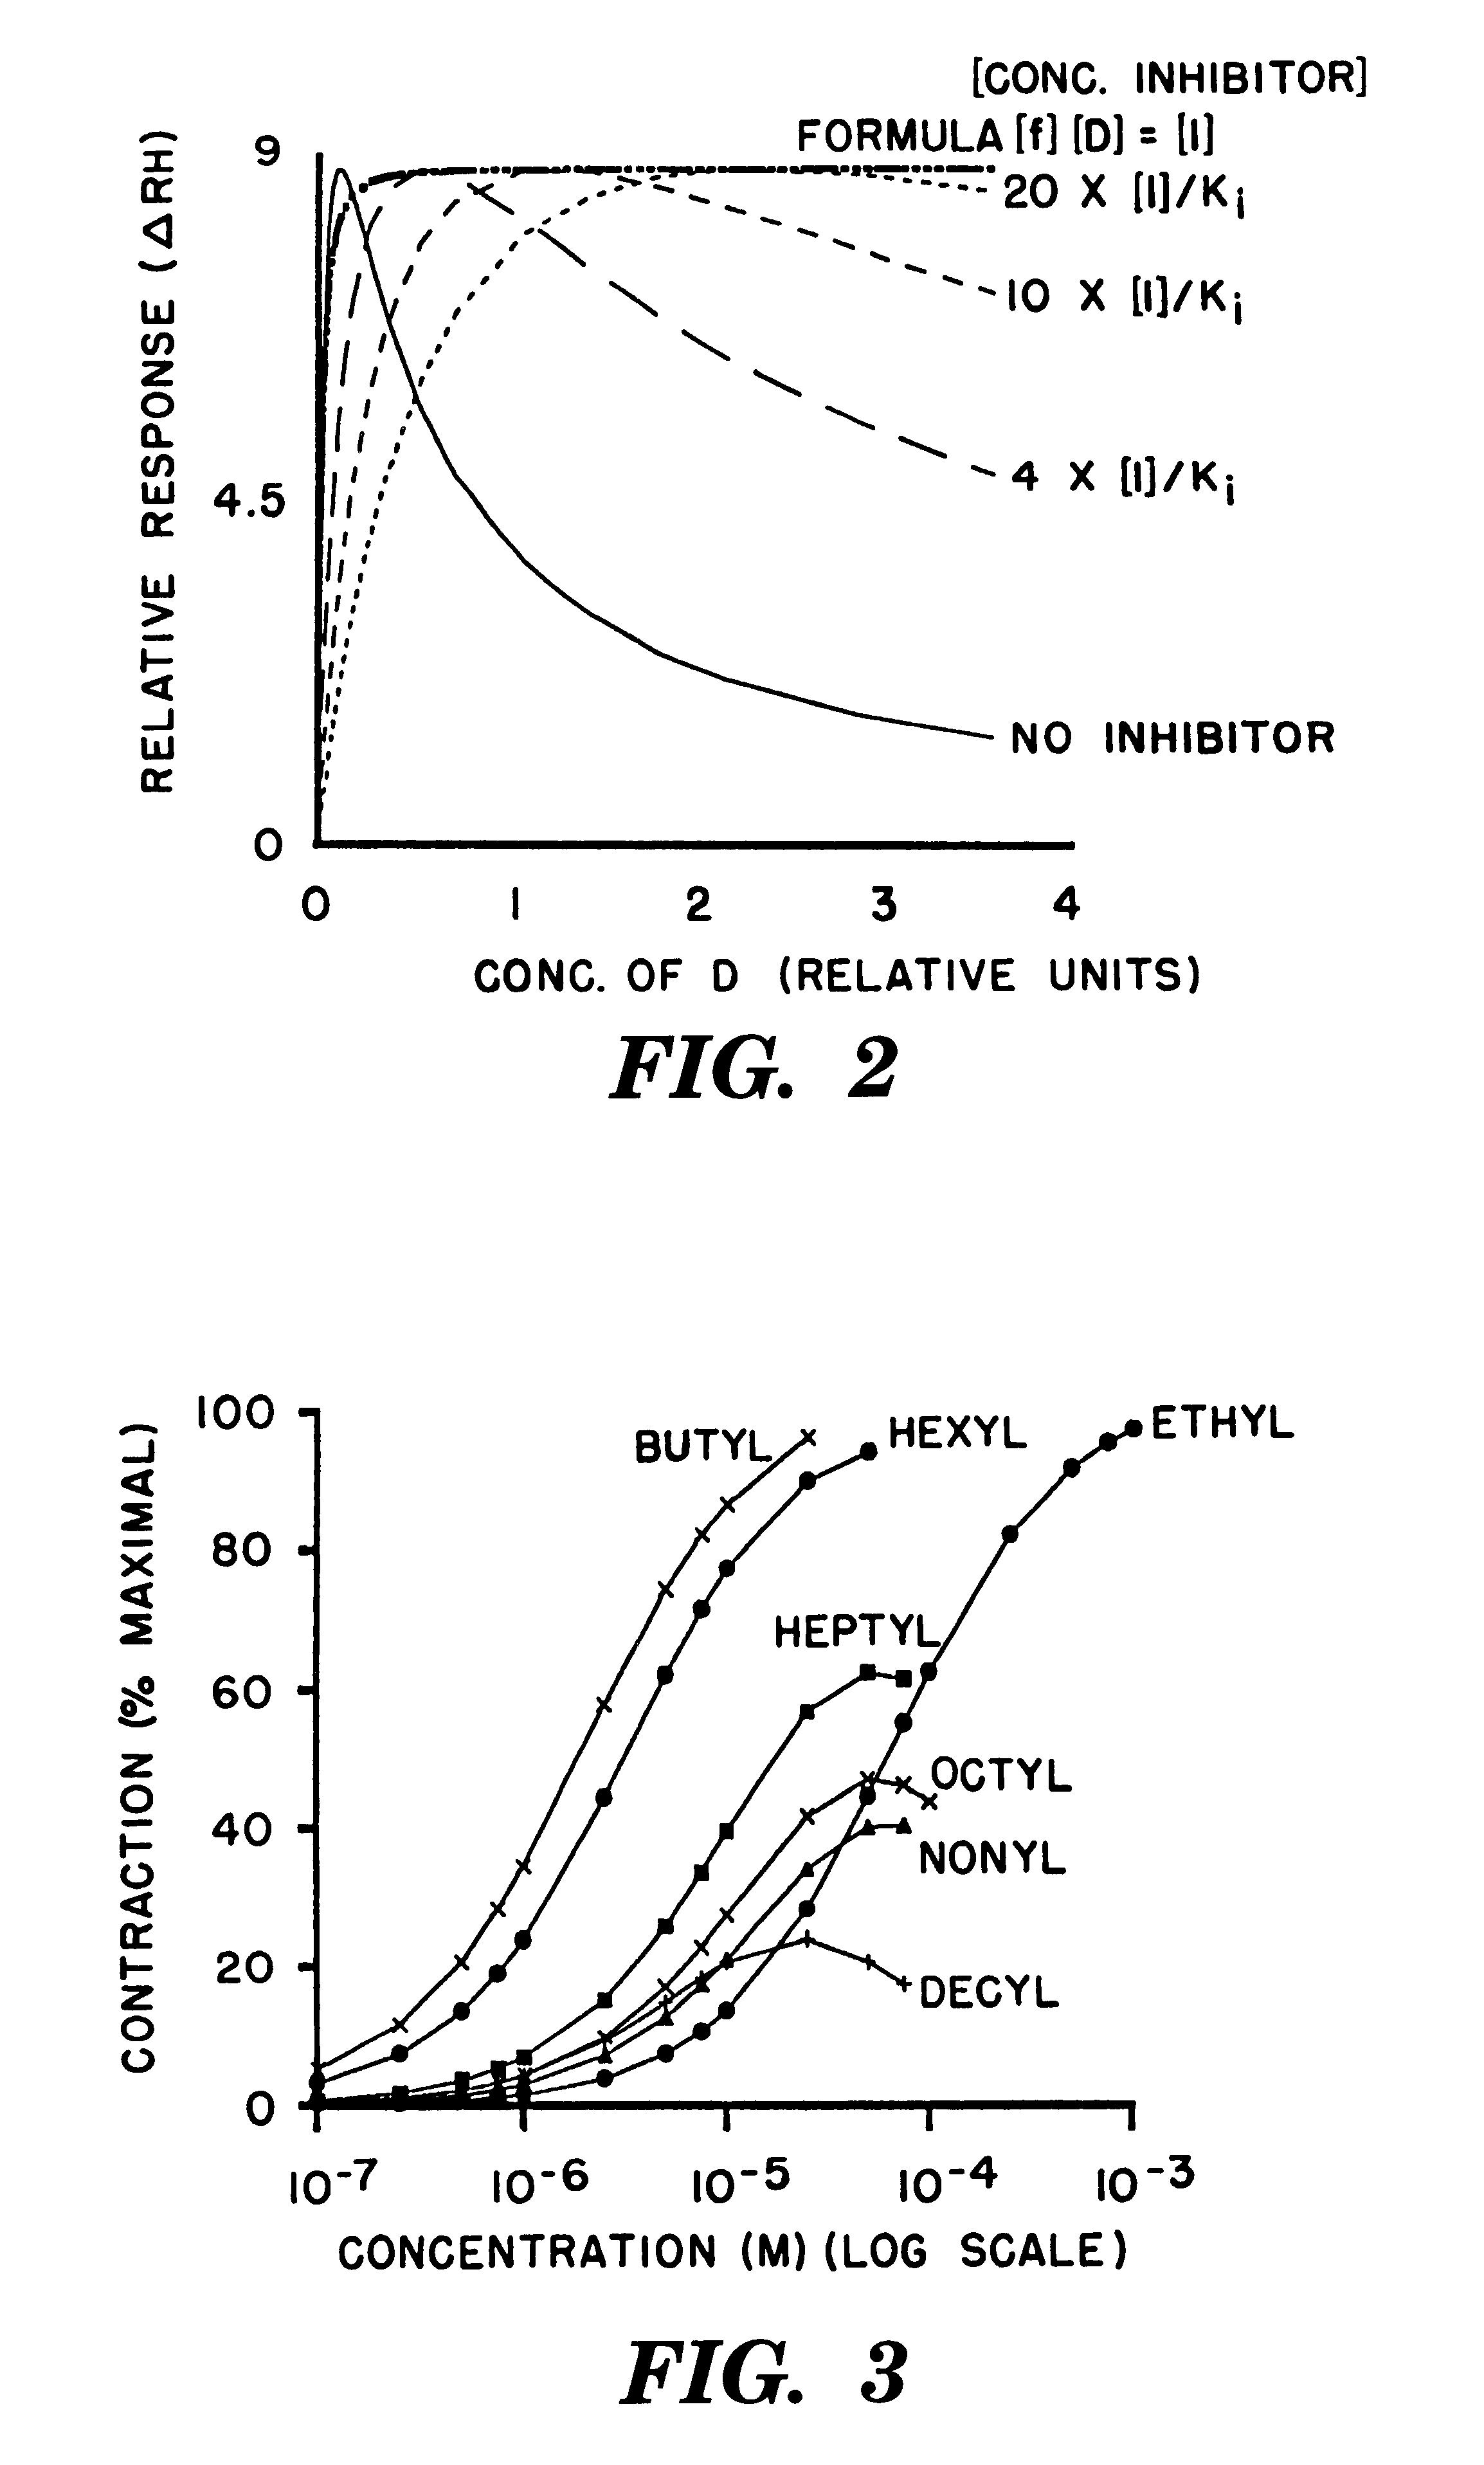
Stephenson's data (Stephenson, R. P., British. J. Pharmacol. 11, 379-393 (1956)) are presented in FIG. 3. The points on these curves were generated by equation [6]. The value for both of the R.sub.H and R.sub.L terms was 50 and the values of the pairs of K.sub.DH and K.sub.DL terms were as follows: Butyl (3.times.10.sup.-6, 8.times.10.sup.-2); Hexyl (5.times.10.sup.-6, 2.times.10.sup.-3); Ethyl (1.times.10.sup.-4, 1.times.10.sup.1); Heptyl (2.times.10.sup.-5, 3.times.10.sup.-4); Octyl (3.times.10.sup.-5, 2.times.10.sup.-4); Nonyl (4.times.10.sup.-5, 2.times.10.sup.-4); and Decyl (3.times.10.sup.-5, 2.times.10.sup.-4). The concentration of drug [D] is represented on the abscissa in a molar log scale.

The reader will note that equation [6] can represent the experimental data from Stephenson with meaningful physicochemical parameters (i.e. the two dissociation constants of the drugs for the two receptor states).

example 2

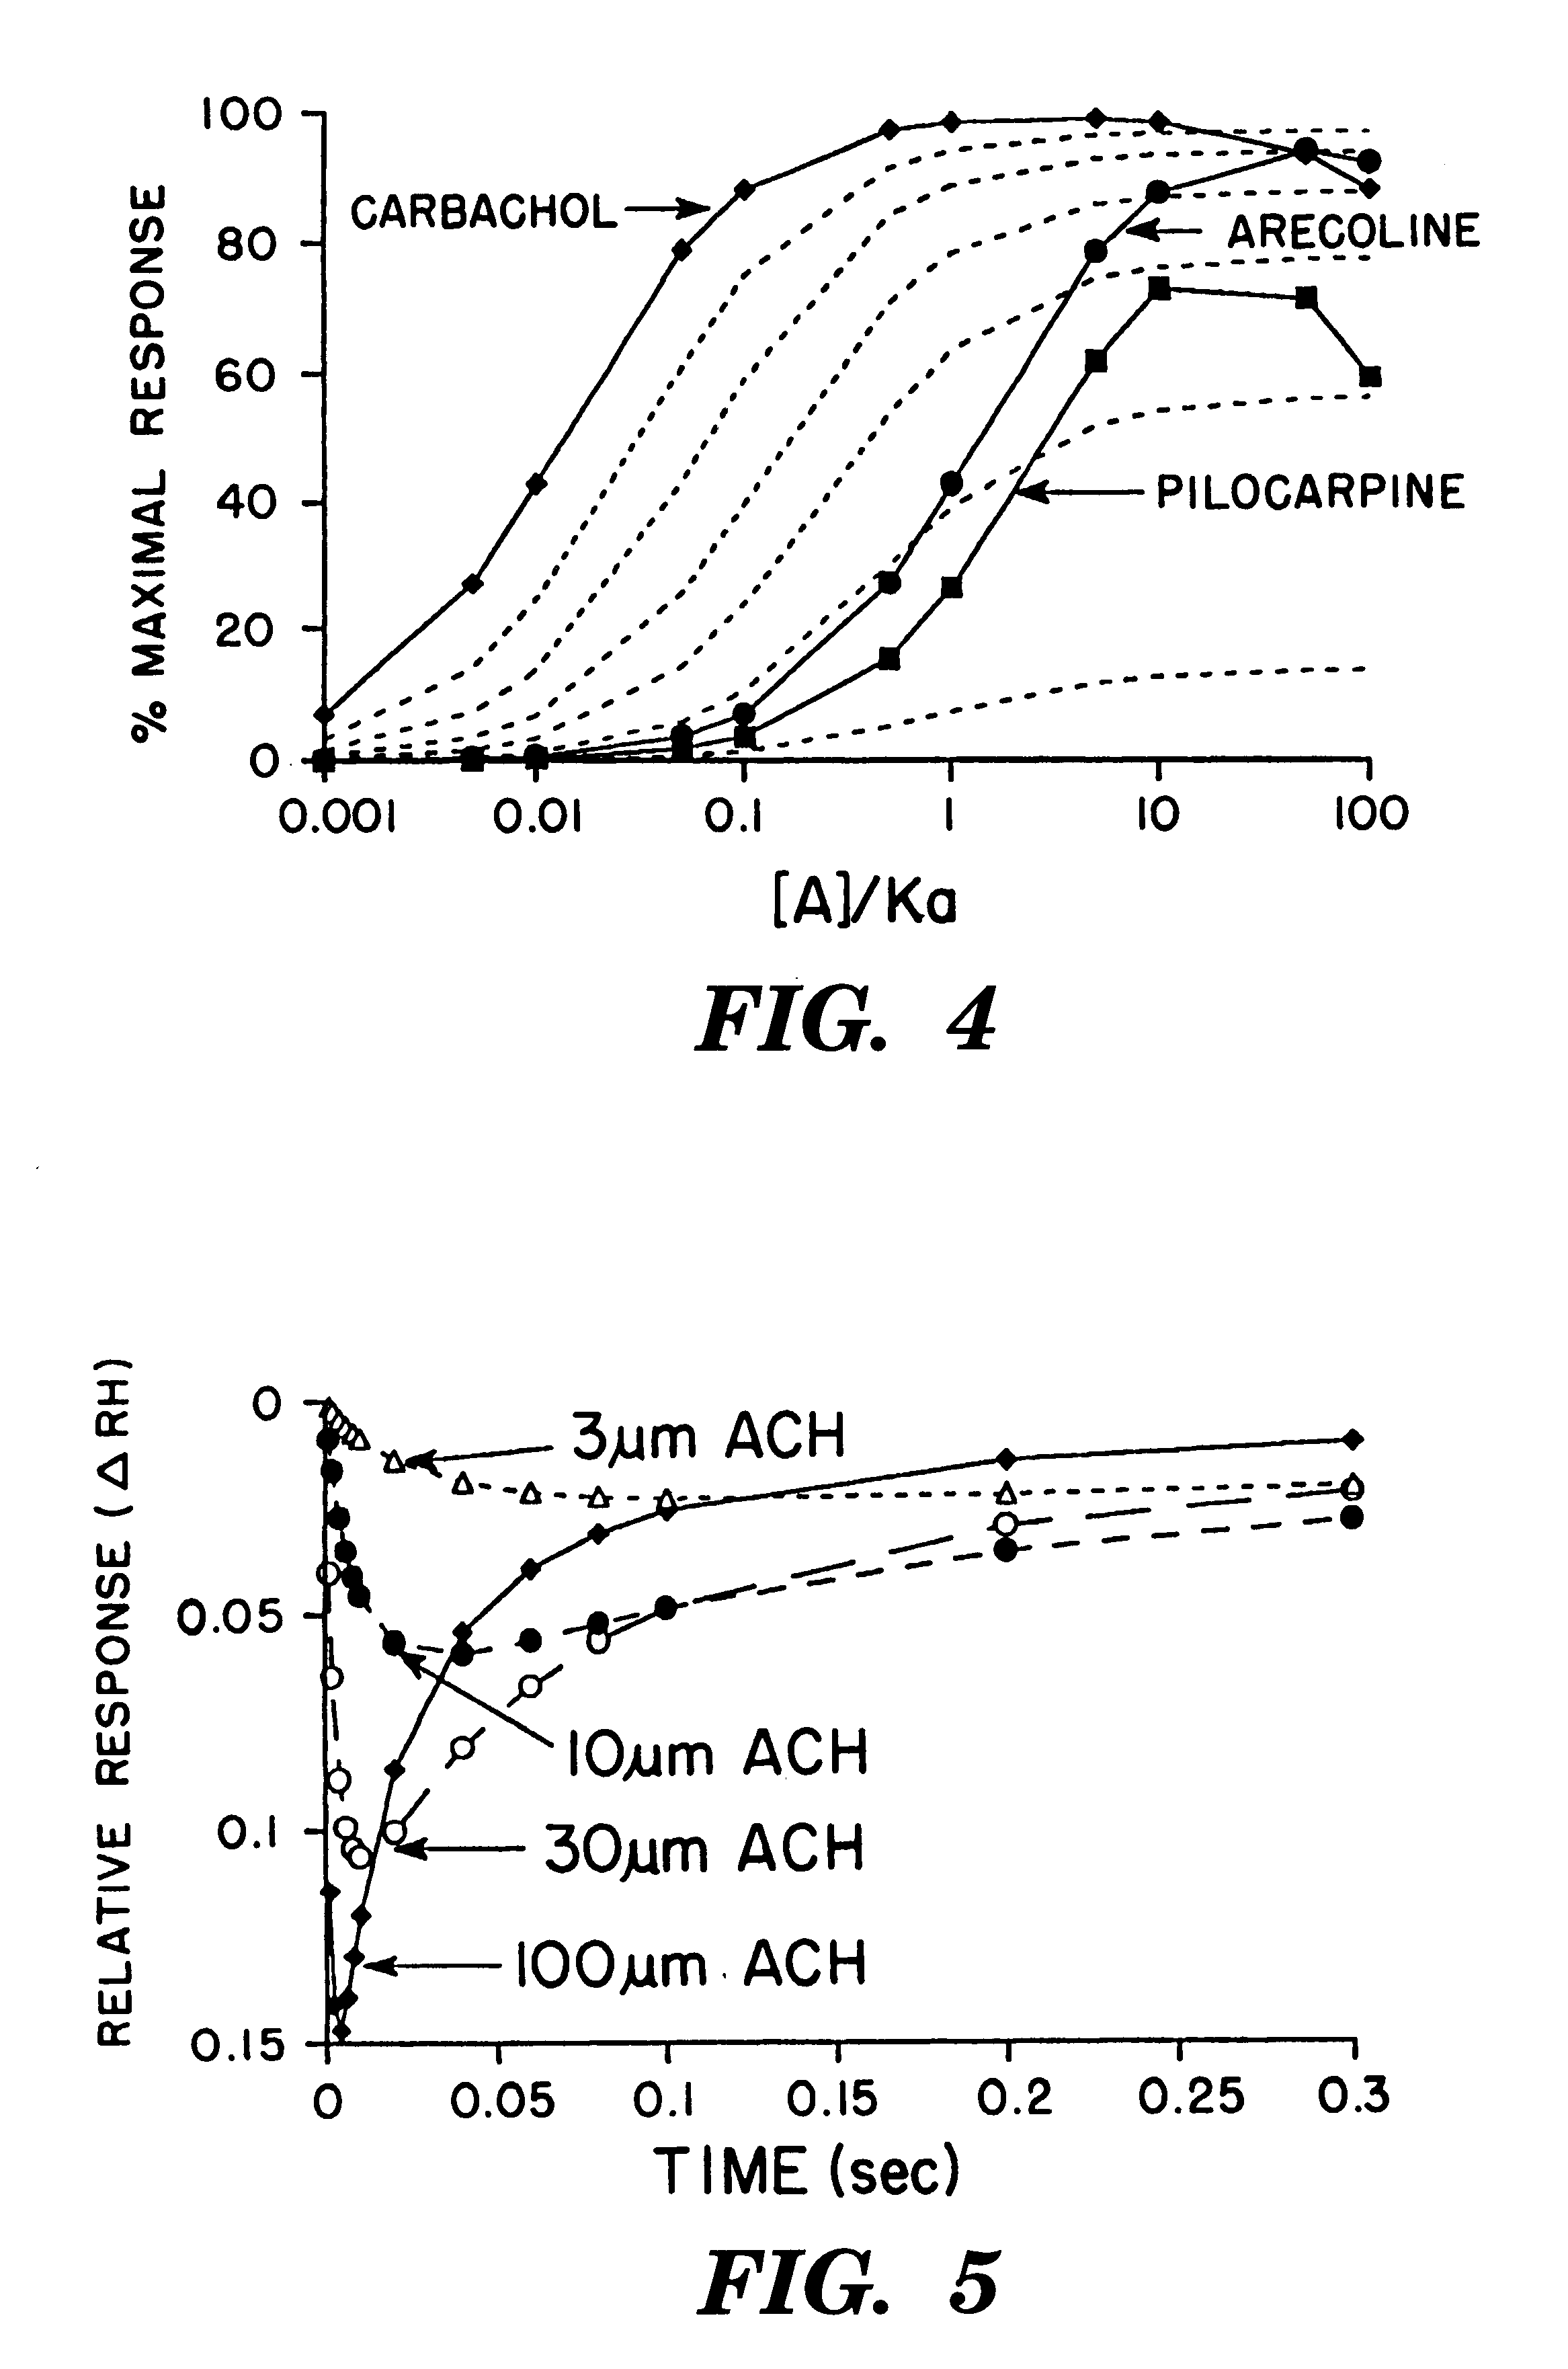
Referring once again to FIG. 4, the plots of .DELTA.RH (equation [6]--solid lines) for the data of Keen (Keen, 1991) are presented for arecoline, pilocarpine and carbachol as well as the plots of the operational model (broken lines). .DELTA.RH was calculated with 300 as the value for the R.sub.H and R.sub.L terms to scale the curves appropriately. The K.sub.DH and K.sub.DL terms were varied in order to model the experimental curves. The K.sub.DH and K.sub.DL values for arecoline were 2 and 2000 respectively; similarly, the values for pilocarpine were 4 and 220; and the values for carbachol were 0.02 and 1000.

The Equation to Calculate the Curves for the Operational Model: ##EQU8##

where A represents agonist parameters and R receptor and ([R.sub.o ] / K.sub.AR)=16, 7.3, 3.5, 1.3 and 0.116 with .alpha.=100% (plotted as the broken lines in the graph). K.sub.A is the overall dissociation constant for the binding of the agonist to the receptor as defined in the operational model.

Experimental...

example 3

As depicted in FIG. 5, the response curves of Dilger and Brett are modeled by .DELTA.RH with a diffusion equation, [D].sub.t, to represent the change in concentration with time and a recruitment function, R.sub.F, to describe the diffusional recruitment of receptors. The diffusion coefficient used for acetylcholine (ACH) is 6.times.10.sup.-10 m.sup.2 s.sup.-1, which is a generally accepted value. The values for the R.sub.H and R.sub.L terms are one for this graph. the apparent affinity constant for the diffusional recruitment of receptors, K.sub.F, is 20 .mu.M as determined by the half maximal change in the peak heights of the experimental curves. Where "t" is the time in seconds and "900.times.10.sup.-12 " is the square of the distance (30.times.10.sup.-6 m). The K.sub.DH and K.sub.DL values of acetylcholine are 0.01 and 0.1 respectively.

The series of equations to calculate .DELTA.RH are: ##EQU11##

where the last four equations are operationally equivalent to equation [6] for .DELTA...


PUM

PropertyMeasurementUnit
diffusion distanceaaaaaaaaaa
affinityaaaaaaaaaa
dissociation constantsaaaaaaaaaa

Abstract

Drug compositions combining antagonists with agonists to prevent desensitization of cellular receptors. An agonist is a substance or drug that produces a maximal or nearly maximal response, whereas an antagonist is a substance or molecule that produces no response, but can block the action of the agonist/drug. A partial agonist produces a moderate response and can also block the response of the receptor to the agonist/drug. The instant invention solves the problem of determining the optimal concentration of an antagonist or inhibitor which is necessary to prevent desensitization, without causing unnecessary and unwanted inhibition, by providing a formulative method detailing how a competitive antagonist of the receptor should be combined with an agonist in a specific proportion to maximize and maintain receptor response throughout drug therapy/administration. Use of the "optimal ratio method" to determine a specific agonist/antagonist composition to prevent .beta..sup.2 receptor desensitization is experimentally verified and validated.

Description

BACKGROUND OF THE INVENTION1. Field of the InventionThis invention relates generally to drug compositions or formulations which have the capability of eliciting specific responses from cellular receptors and, specifically, to those optional compositions / formulations which prevent desensitization of such receptors.2. Discussion of Relevant ArtThroughout this disclosure, I shall use terms with their generally accepted meanings and, on occasion, supplement those meanings as indicated in order to clarify a particular facet of my invention by concentrating on a specific relationship or agenda that is normally generalized by use of the term.An agonist is a substance / drug that has affinity for and stimulates physiologic activity at cell receptors that are normally stimulated by naturally occurring substances. As used throughout, an agonist is such a substance / drug that produces a maximal or nearly maximal response, whereas an antagonist is a substance or molecule that produces no response,...

Claims


Application Information

Patent Timeline
Patent Type & Authority Patents(United States)
IPC IPC(8): A61K45/00A61K49/00A61K45/06
CPCA61K45/06A61K49/0004
Inventor LANZARA, RICHARD G.
Owner ENHANCED PHARMA
Why Eureka
Try Eureka