View composition system for synthesizing multiple visual representations of multiple data sets

a composition system and data set technology, applied in the direction of editing/combining figures or texts, static indicating devices, instruments, etc., can solve the problems of not being able to provide a method for incorporating all the graphs that can ordinarily be used, and not being able to provide a user with a systematic means

Inactive Publication Date: 2005-03-15
IBM CORP
View PDF31 Cites 105 Cited by
  • Summary
  • Abstract
  • Description
  • Claims
  • Application Information

AI Technical Summary

Benefits of technology

[0013]It is another object of the present invention to provide a system for combining a plurality of analysis methods and visualization methods to better assure the integrity of the analysis results, and for obtaining new information from phenomena that at a glance do not seem to be related to each other.

Problems solved by technology

However, even when a sophisticated independent analysis method and its visualization process are employed, there is no systematic means available to comply with a request that a plurality of analysis methods and visual representations be combined to search for elements that are not readily assessable when a single analysis method is used, or to assure that adequate analysis results will be provided.
No means is now available whereby a user can make a decision by visualizing data without a visual query.
As a result, no method is provided for incorporating all the graphs that can ordinarily be used, or for calculating an available composition or a neighboring representation using a set of data that are the source for the graphic representation.

Method used


Image

  • View composition system for synthesizing multiple visual representations of multiple data sets
  • View composition system for synthesizing multiple visual representations of multiple data sets
  • View composition system for synthesizing multiple visual representations of multiple data sets

Examples


first embodiment

[0036

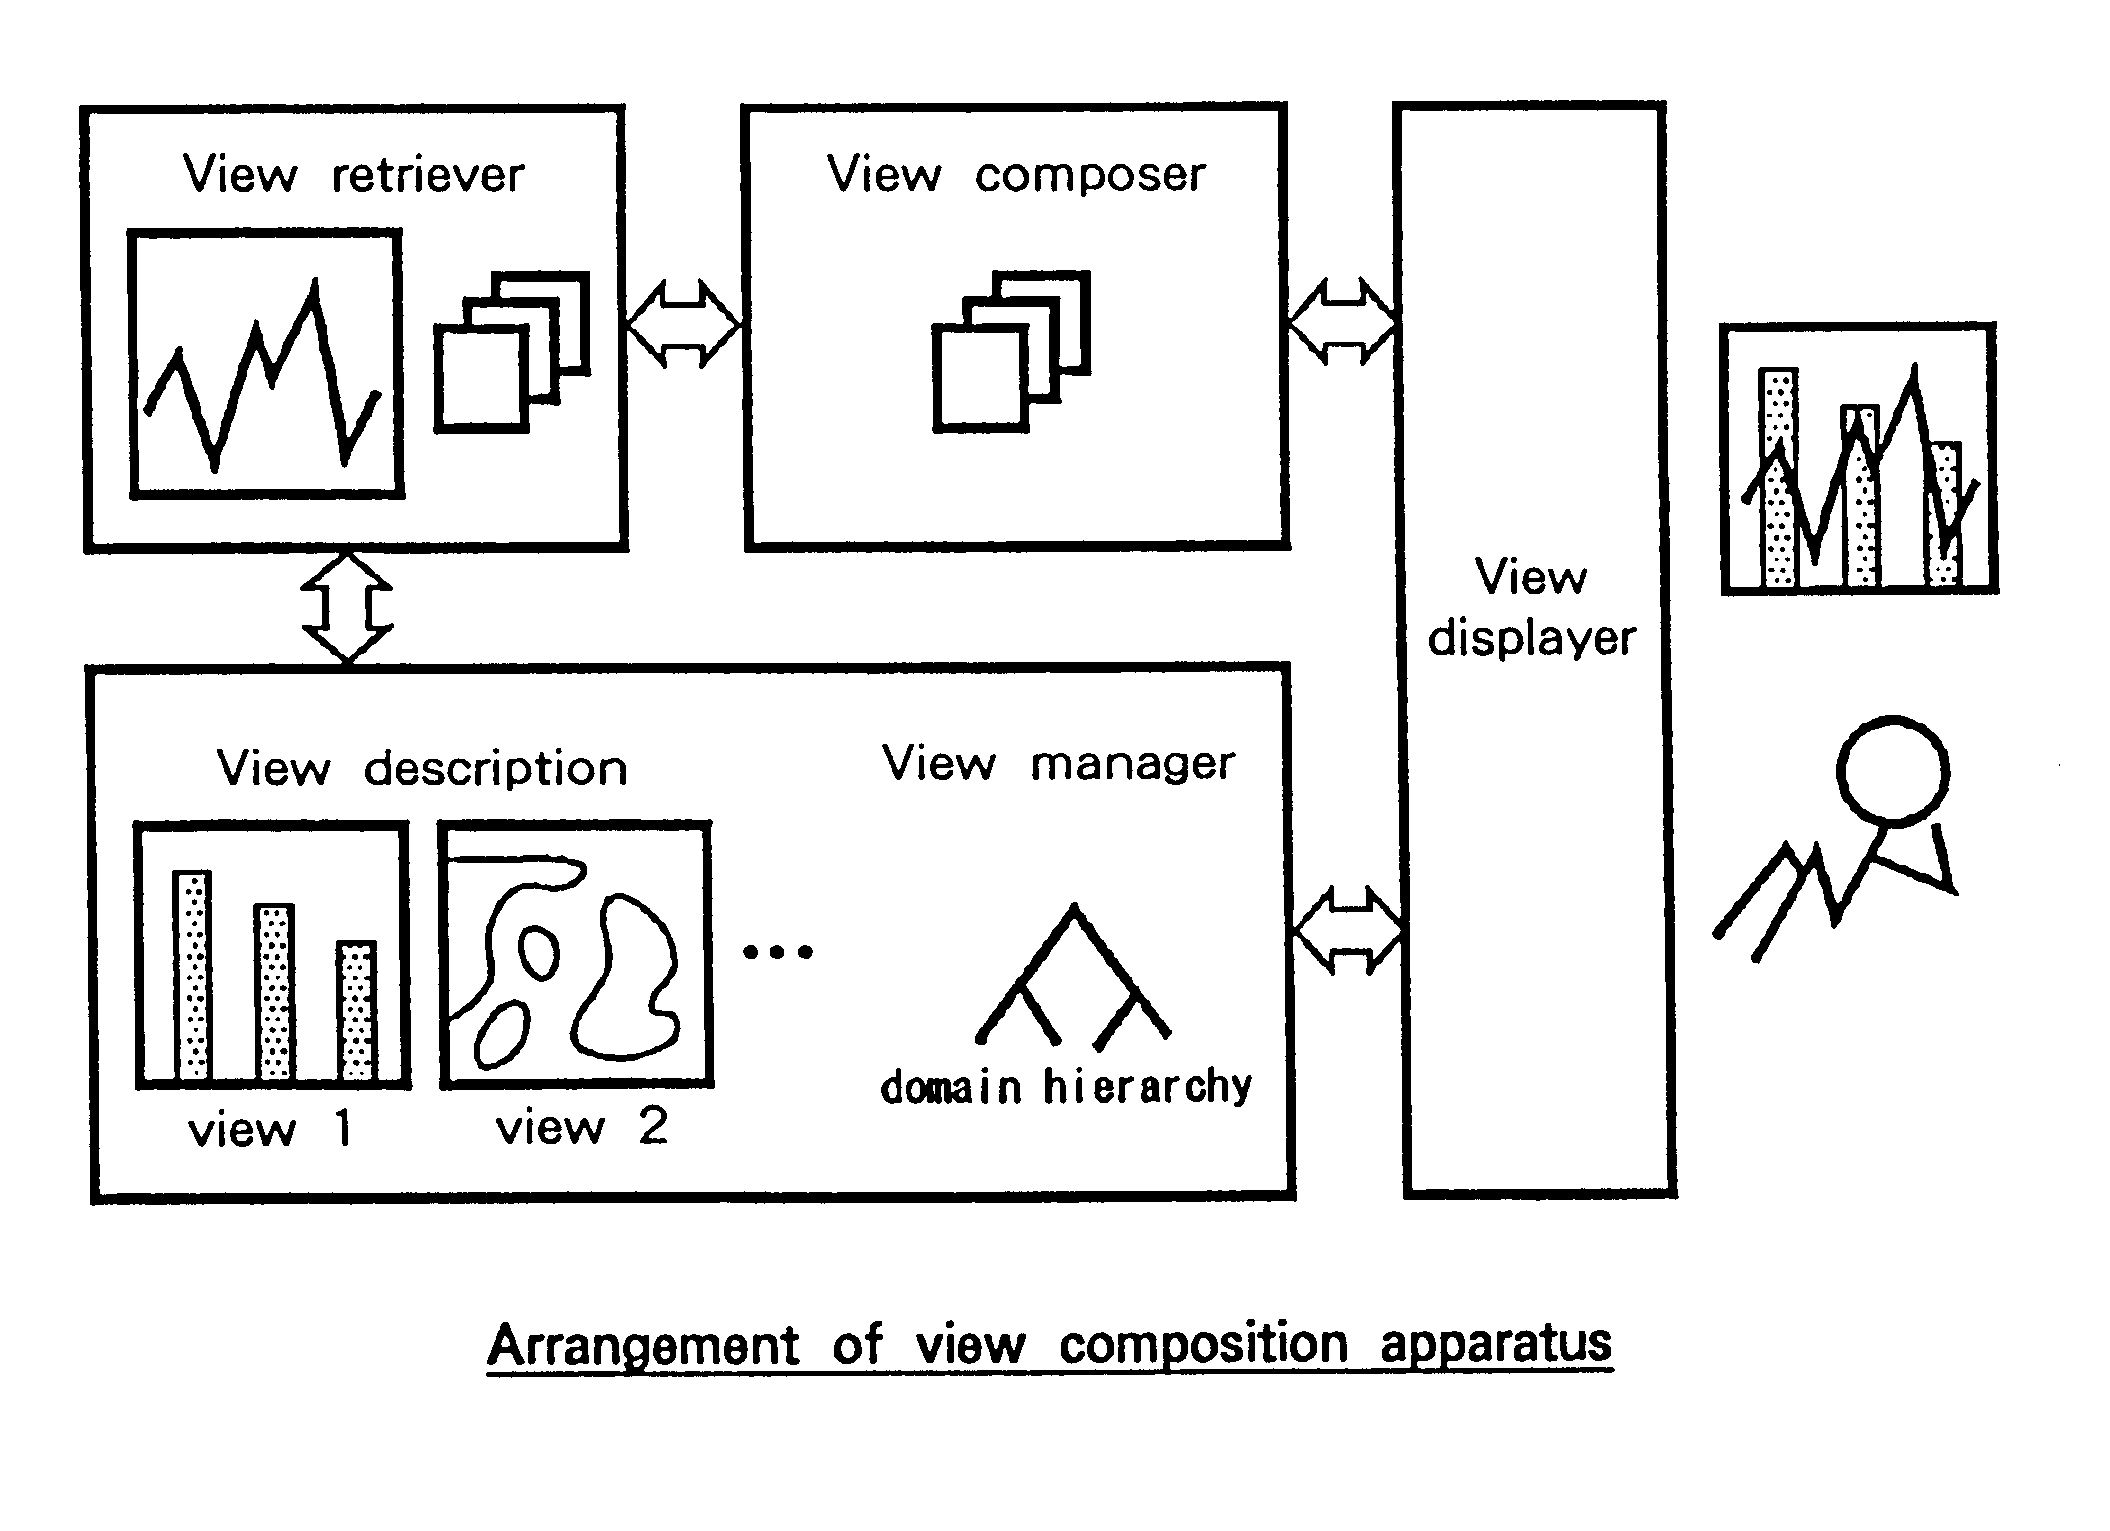
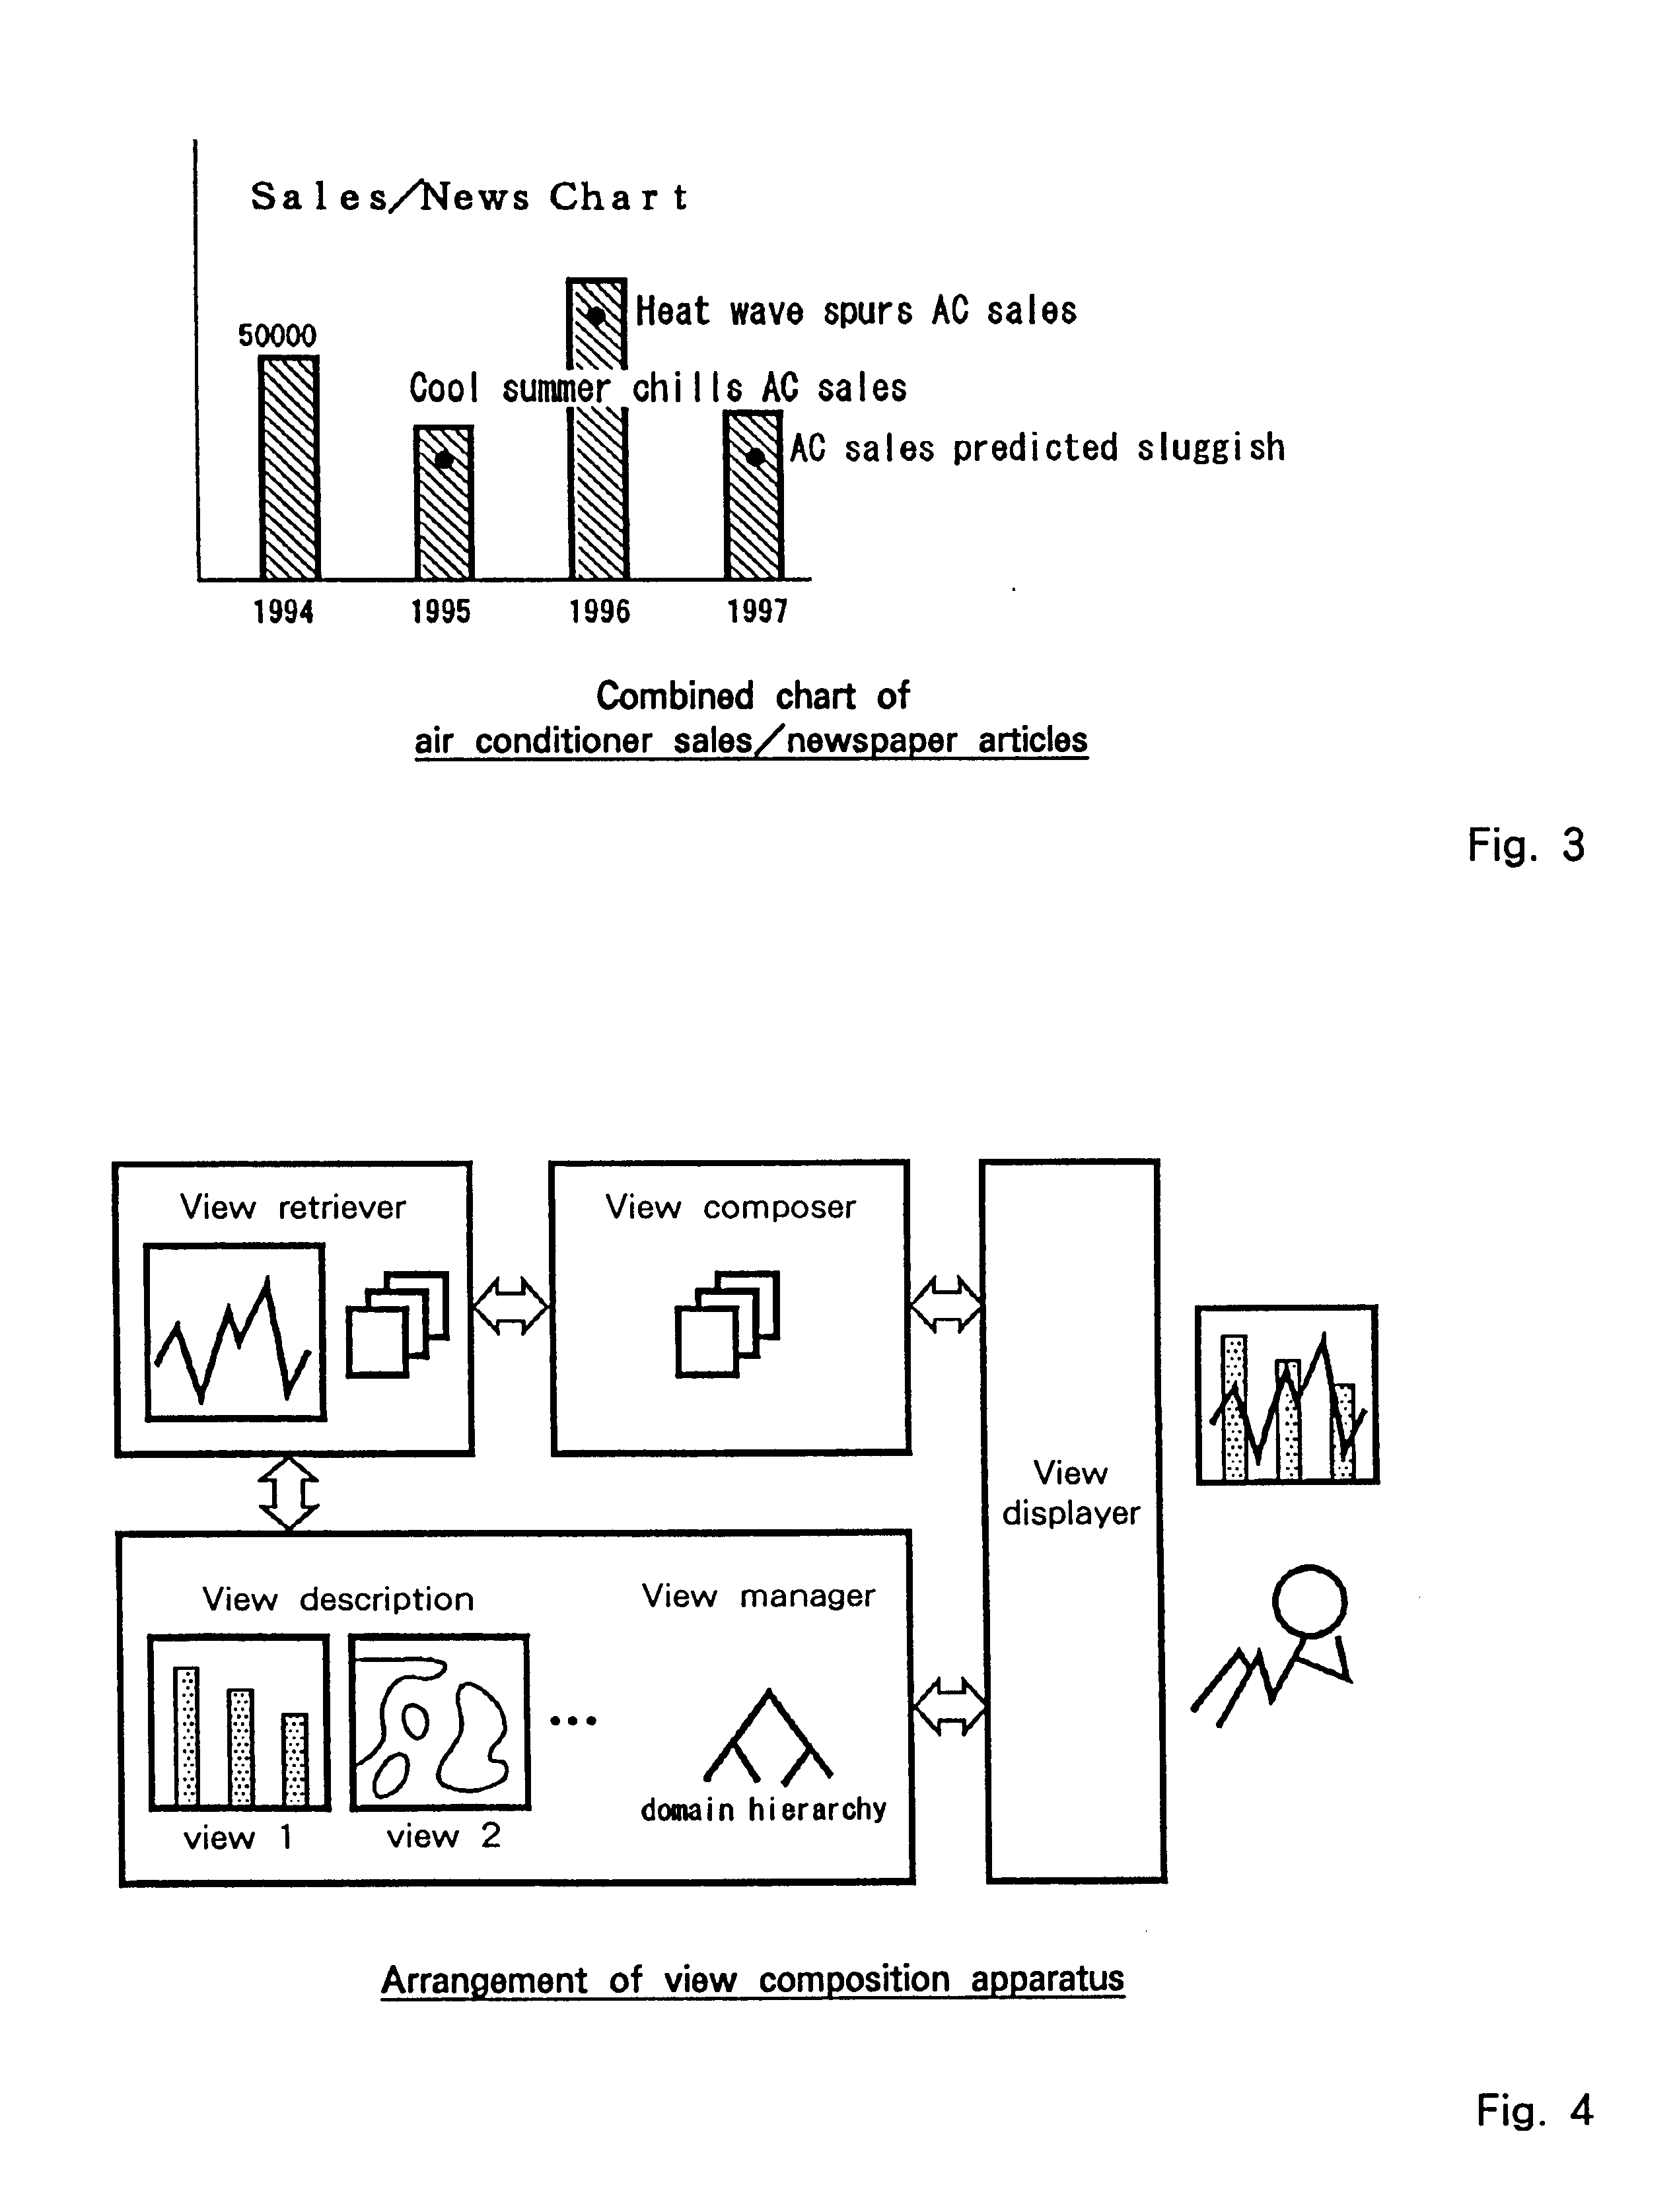
[0037]In a first embodiment, FIG. 4 illustrates a block diagram of a view composition system. As is shown in FIG. 4, this system comprises four blocks which are a view manager, a view retriever, a view composer, and a view displayer. In FIG. 8 there is shown a sample hardware arrangement for a system operated by the blocks in FIG. 4.

[0038]A system 100 comprises a central processing apparatus (CPU) 1 and a memory 4. The CPU 1 and the memory 4 are connected by a bus 2 and an IDE controller 25 to a hard disk drive 13 (or to a storage medium drive, such as an MO, a CD-ROM 26 or a DVD 32), which is an auxiliary storage device. Similarly, the CPU 1 and the memory 4 are connected by the bus 2 and a SCSI controller 27 to a hard disk drive 30 (or to a storage medium drive, such as an MO 28, a CD-ROM 29 or a DVD 31), which is an auxiliary storage device. A floppy disk drive 20 is connected to the bus 2 via a floppy disk controller 19.

[0039]It is preferable that a view description, such a...

second embodiment

[0099

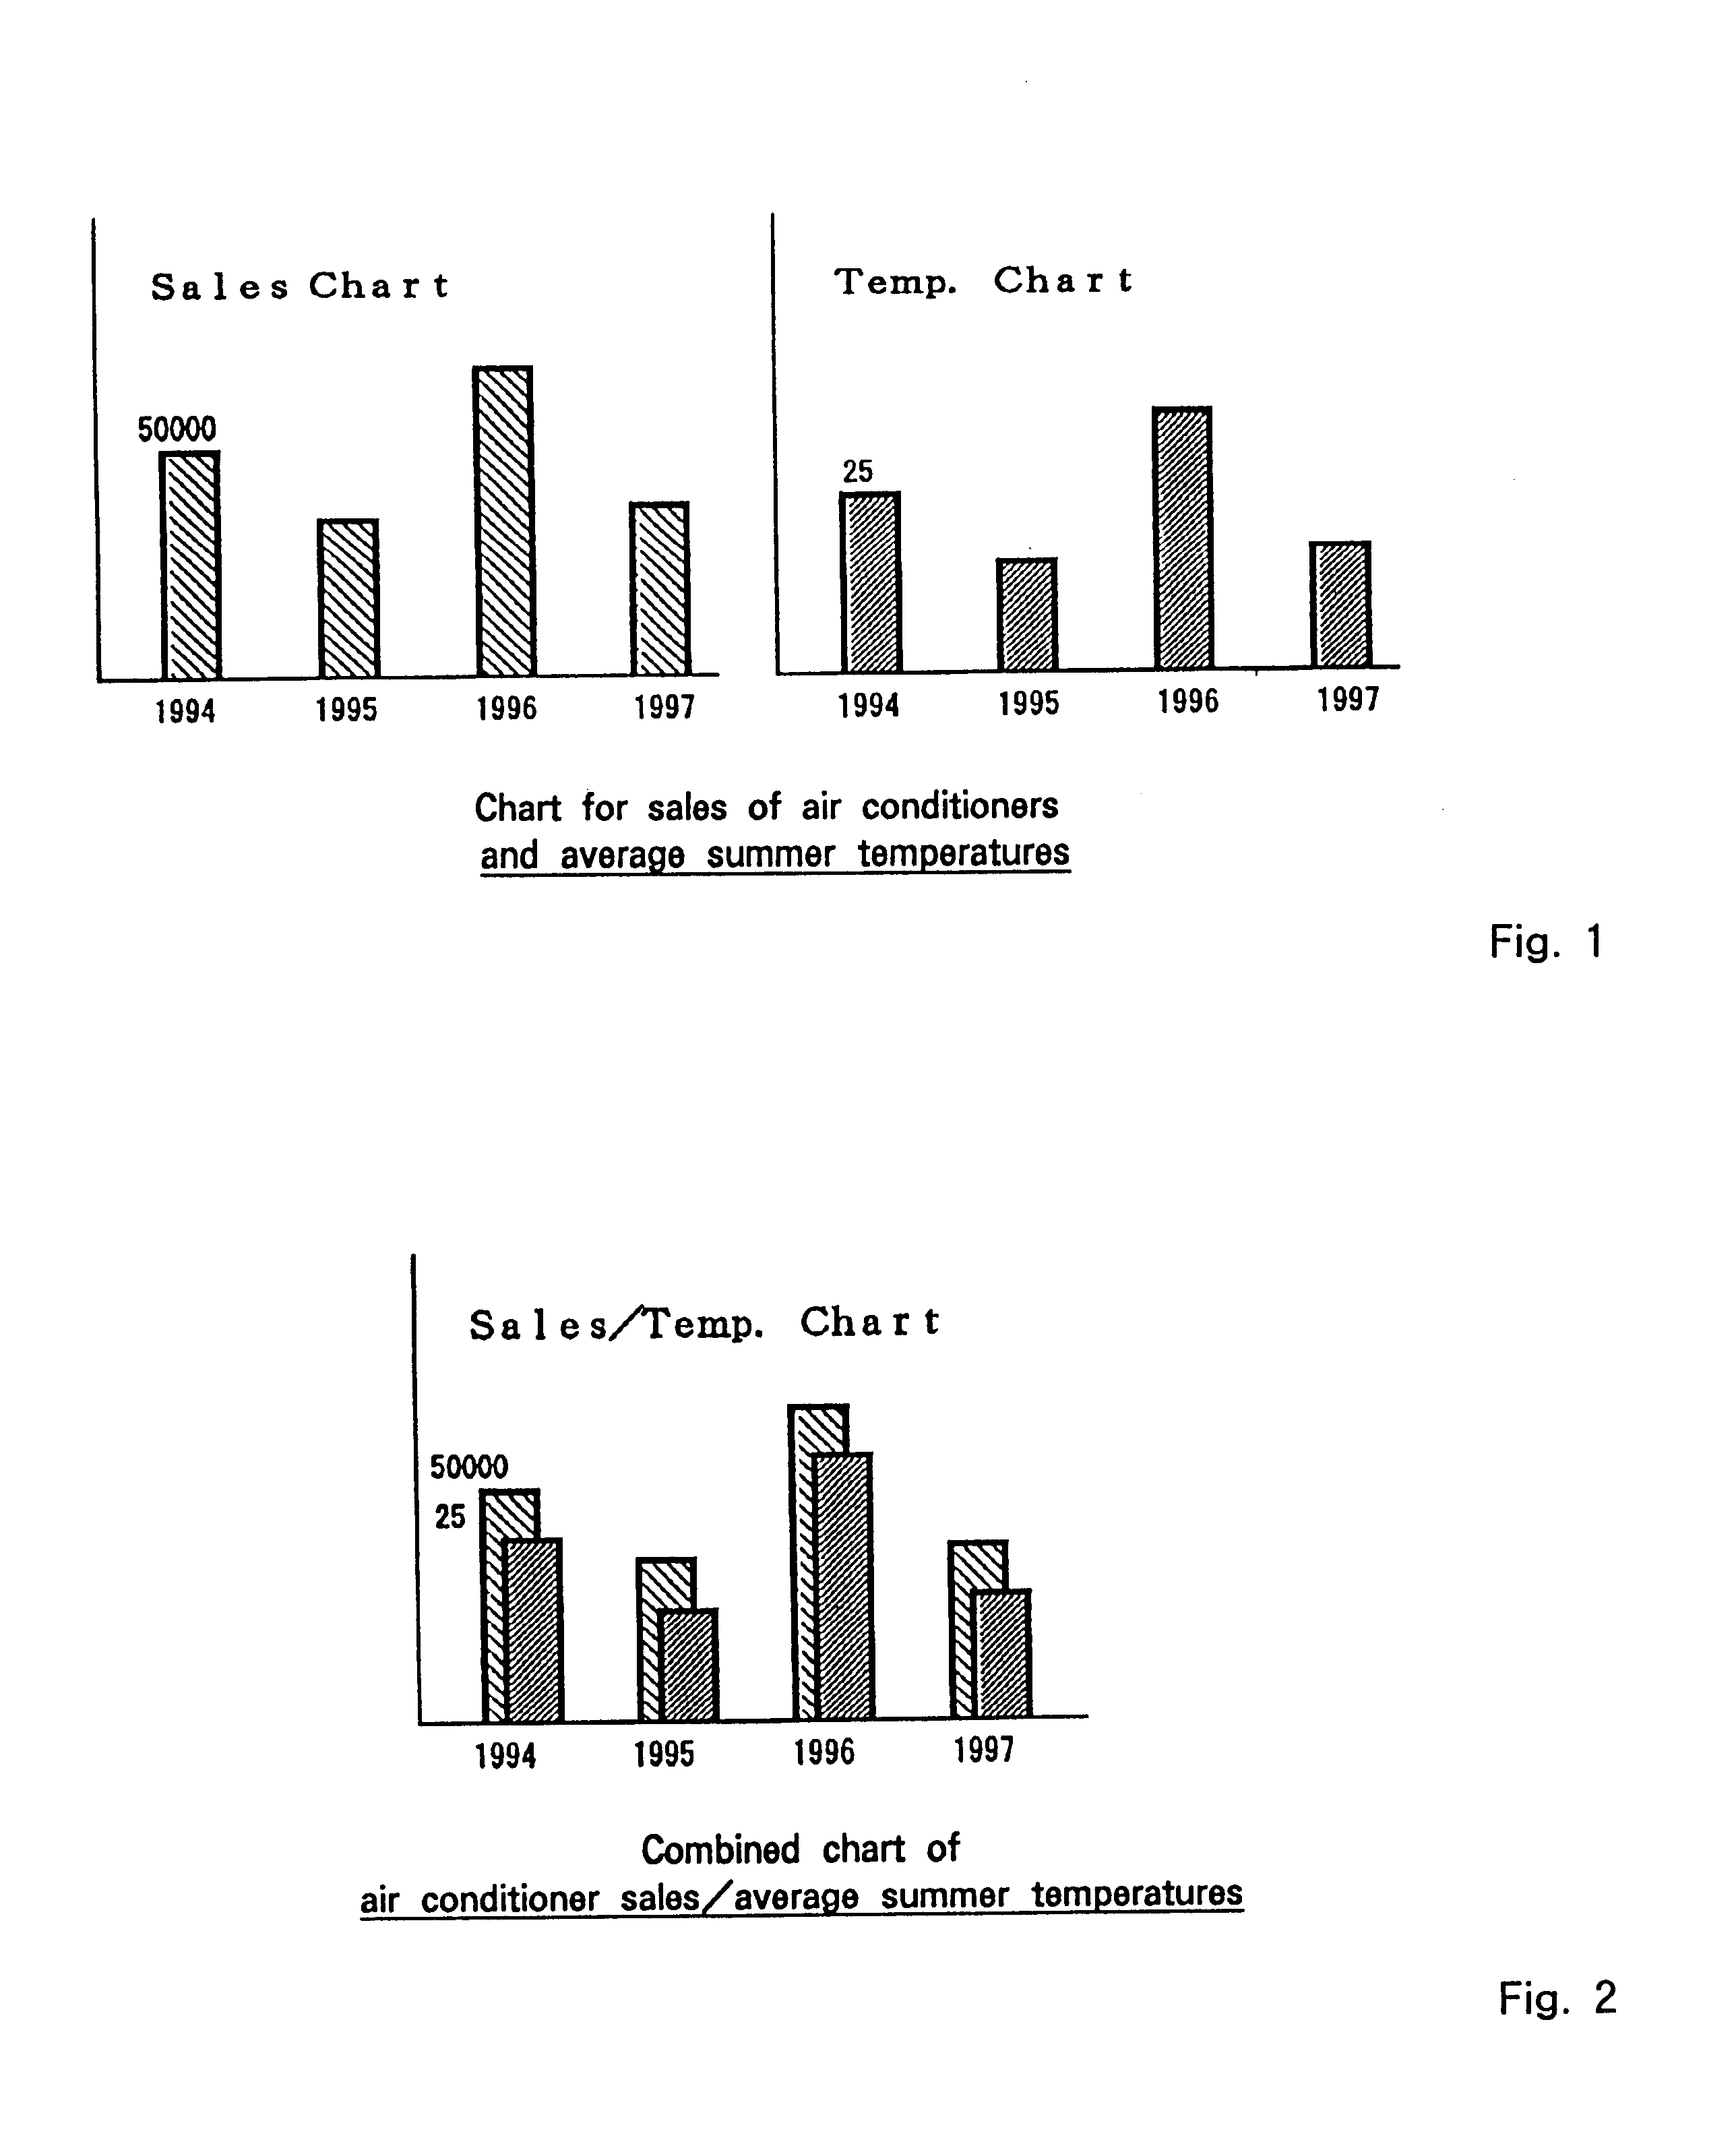
[0100]In a second embodiment, view composition of branch / sales increase data and general manager / service term data are requested. Two-dimensional bar chart views are employed for both data, and they have the respective attributes (e.g., branch name, %) and (e.g., general manager name, service years). The branch names and the general manager names have a one-to-one correspondence, the domain for % is −1000 to 1000, and the domain for the service year is 0 to 40. At this time, both views can be combined into a view (e.g., branch / general manager name, sales increase rate / service term). For the numerical attribute, the upper and lower limits need only be adjusted to provide a scale of, for example, 10% or 0.2 year.

[0101]According to the present invention, a plurality of analysis methods and visual representations are combined in order to improve the employment of conventional data retrieval or the OLAP method. In addition, since visualization obtained through data search or at an e...


PUM


Abstract

To provide a more flexible and higher level visualization technique for combining a plurality of analysis methods and visual representations, a view composition system, for combining a plurality of visual representations, includes a view manager for managing as a view a set of data for individual visual representation, a view retriever for retrieving from a plurality of views those views that can be combined, and a view composer for combining the views obtained by the view retriever. Optionally, a view displayer, displays the view produced by the view composer. The view composition system can combine a plurality of views using the superimposition of views and neighboring dimensions that have compatible domains.

Description

BACKGROUND OF THE INVENTION[0002]1. Field of the Invention[0003]The present invention relates to a technique for employing various analysis and visualization methods for a large database containing both text and numerical data.[0004]In particular, the present invention pertains to a method and a system for producing a viable combination of means, selected from a a plurality of analysis methods and their visualization methods, for locating an item of information that is difficult to find using a single visualization method, and to improve the reliability of a result obtained by analysis.[0005]2. Description of the Related Art[0006]In the data retrieval or data warehousing (storage) field, it is very important that data be analyzed from various perspectives and that the data be presented visually in order for features, obscured in large amounts of data, to be detected, and for new facts to be revealed. For the conventional data retrieval or data analyses methods for which on-line anal...

Claims


Application Information

Patent Timeline
Patent Type & Authority Patents(United States)
IPC IPC(8): G06F17/30G06F19/00G06Q10/10G06T11/60
CPCG06T11/60G06F17/30554G06F16/248
Inventor TAKEDA, KOICHI
Owner IBM CORP
Why Eureka
Try Eureka