Method for the analysis of sensory perception

a technology for sensory perception and analysis, applied in the field of sensory perception analysis, can solve the problems of not being able to accurately calculate the rating, the average consumer may be confused, and the accuracy of the data may be difficult and confusing for the average consumer,

Inactive Publication Date: 2005-12-20
INTERNATIONAL FLAVORS & FRAGRANCES
View PDF12 Cites 13 Cited by
  • Summary
  • Abstract
  • Description
  • Claims
  • Application Information

AI Technical Summary

Benefits of technology

[0010]The present invention can be used to measure the relative contribution of various qualities or attributes to a total perception in all the sensory modalities: taste, smell, color, touch, hearing, as well as perception of emotion. The method can be used to measure two or more attributes perceived a

Problems solved by technology

However, intensity ratings are not the most sensitive way of capturing more subtle but real differences between products that vary along only one, but very important dimension, or groups of people who may vary in their sensitivity to a pa

Method used


Image

  • Method for the analysis of sensory perception
  • Method for the analysis of sensory perception
  • Method for the analysis of sensory perception

Examples


example 1

[0032]Thirty-four women panelists participated in a test to evaluate a commercially marketed toothpaste that contained baking soda and peroxide. The women were classified into 2 groups based on genetic variation of taste phenotype. Eighteen panelists were classified into group 1 (40-±3 years old), and 16 into group 2 (40±4 years old).

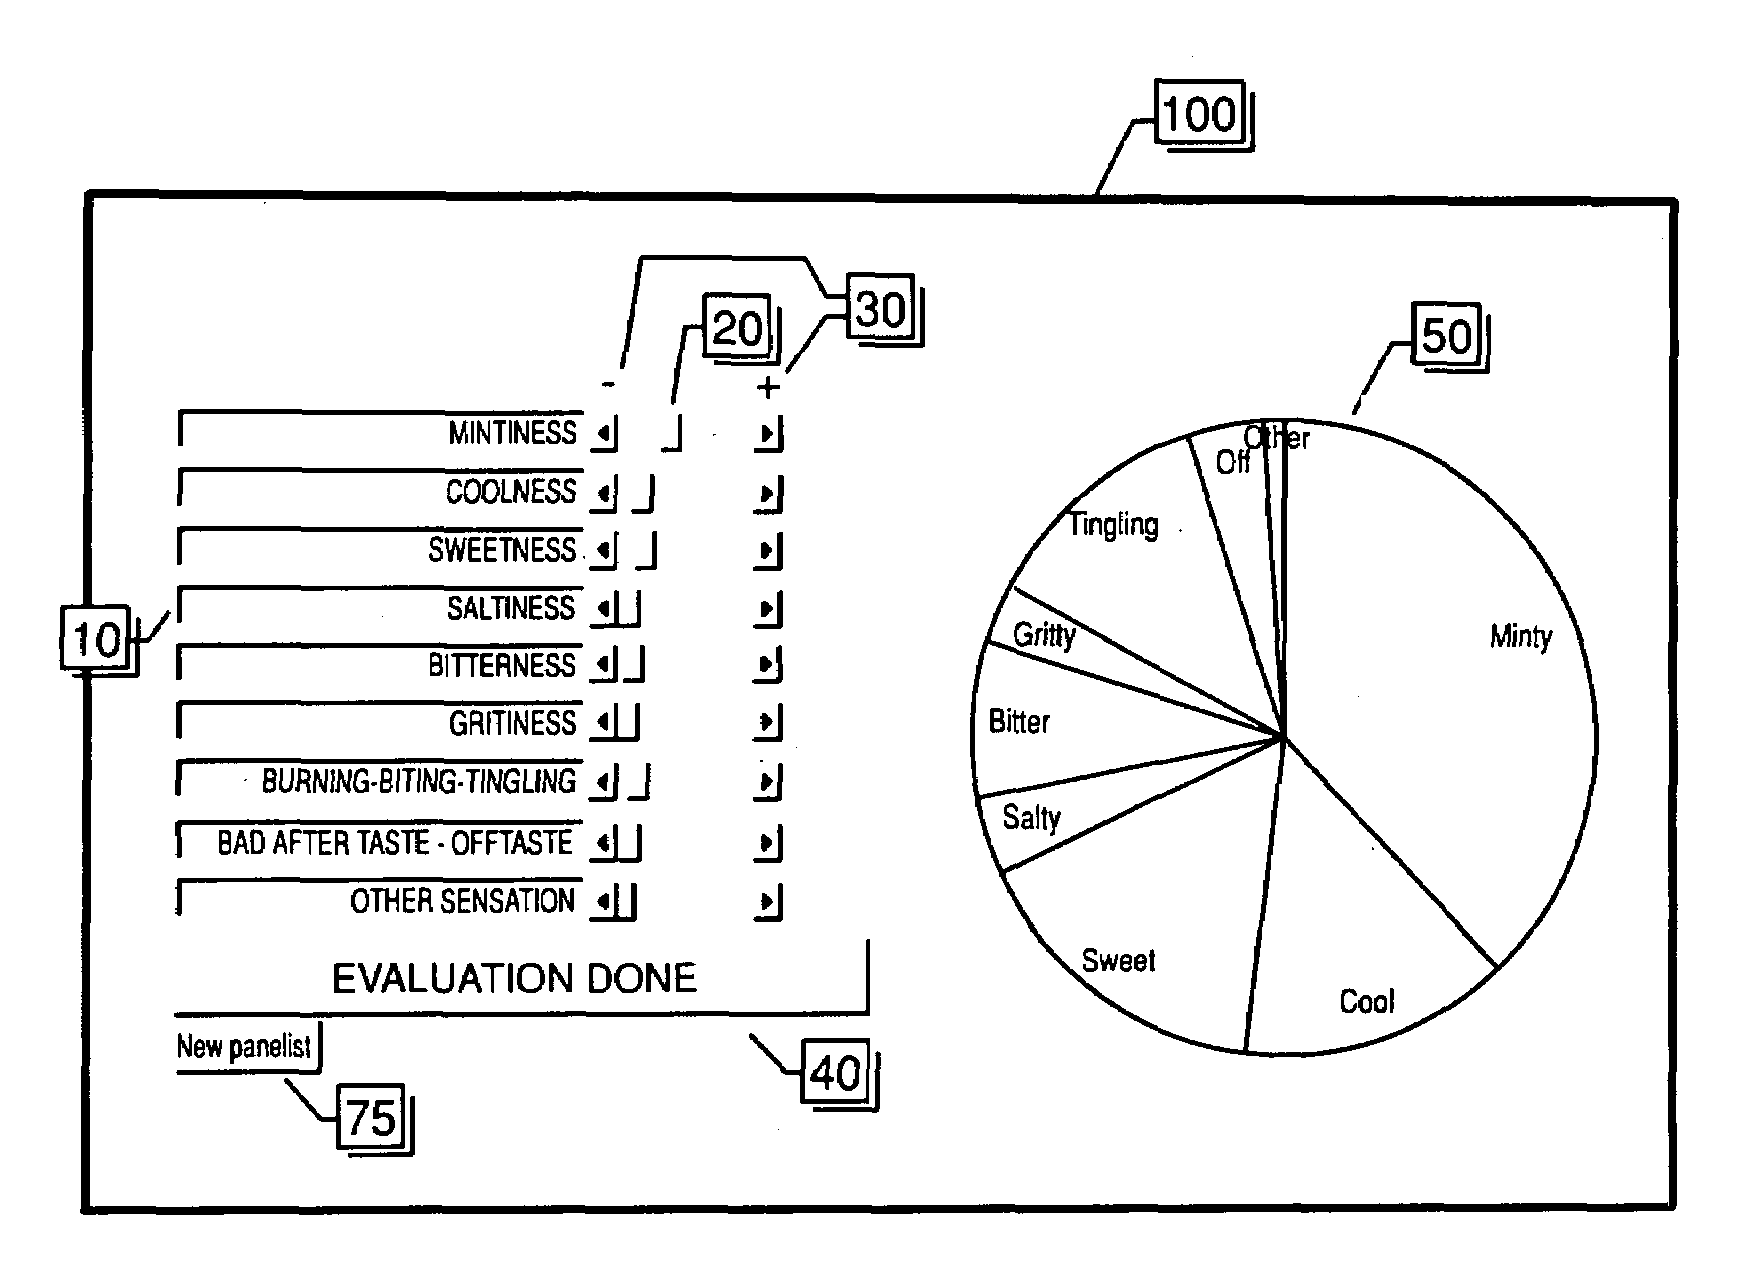
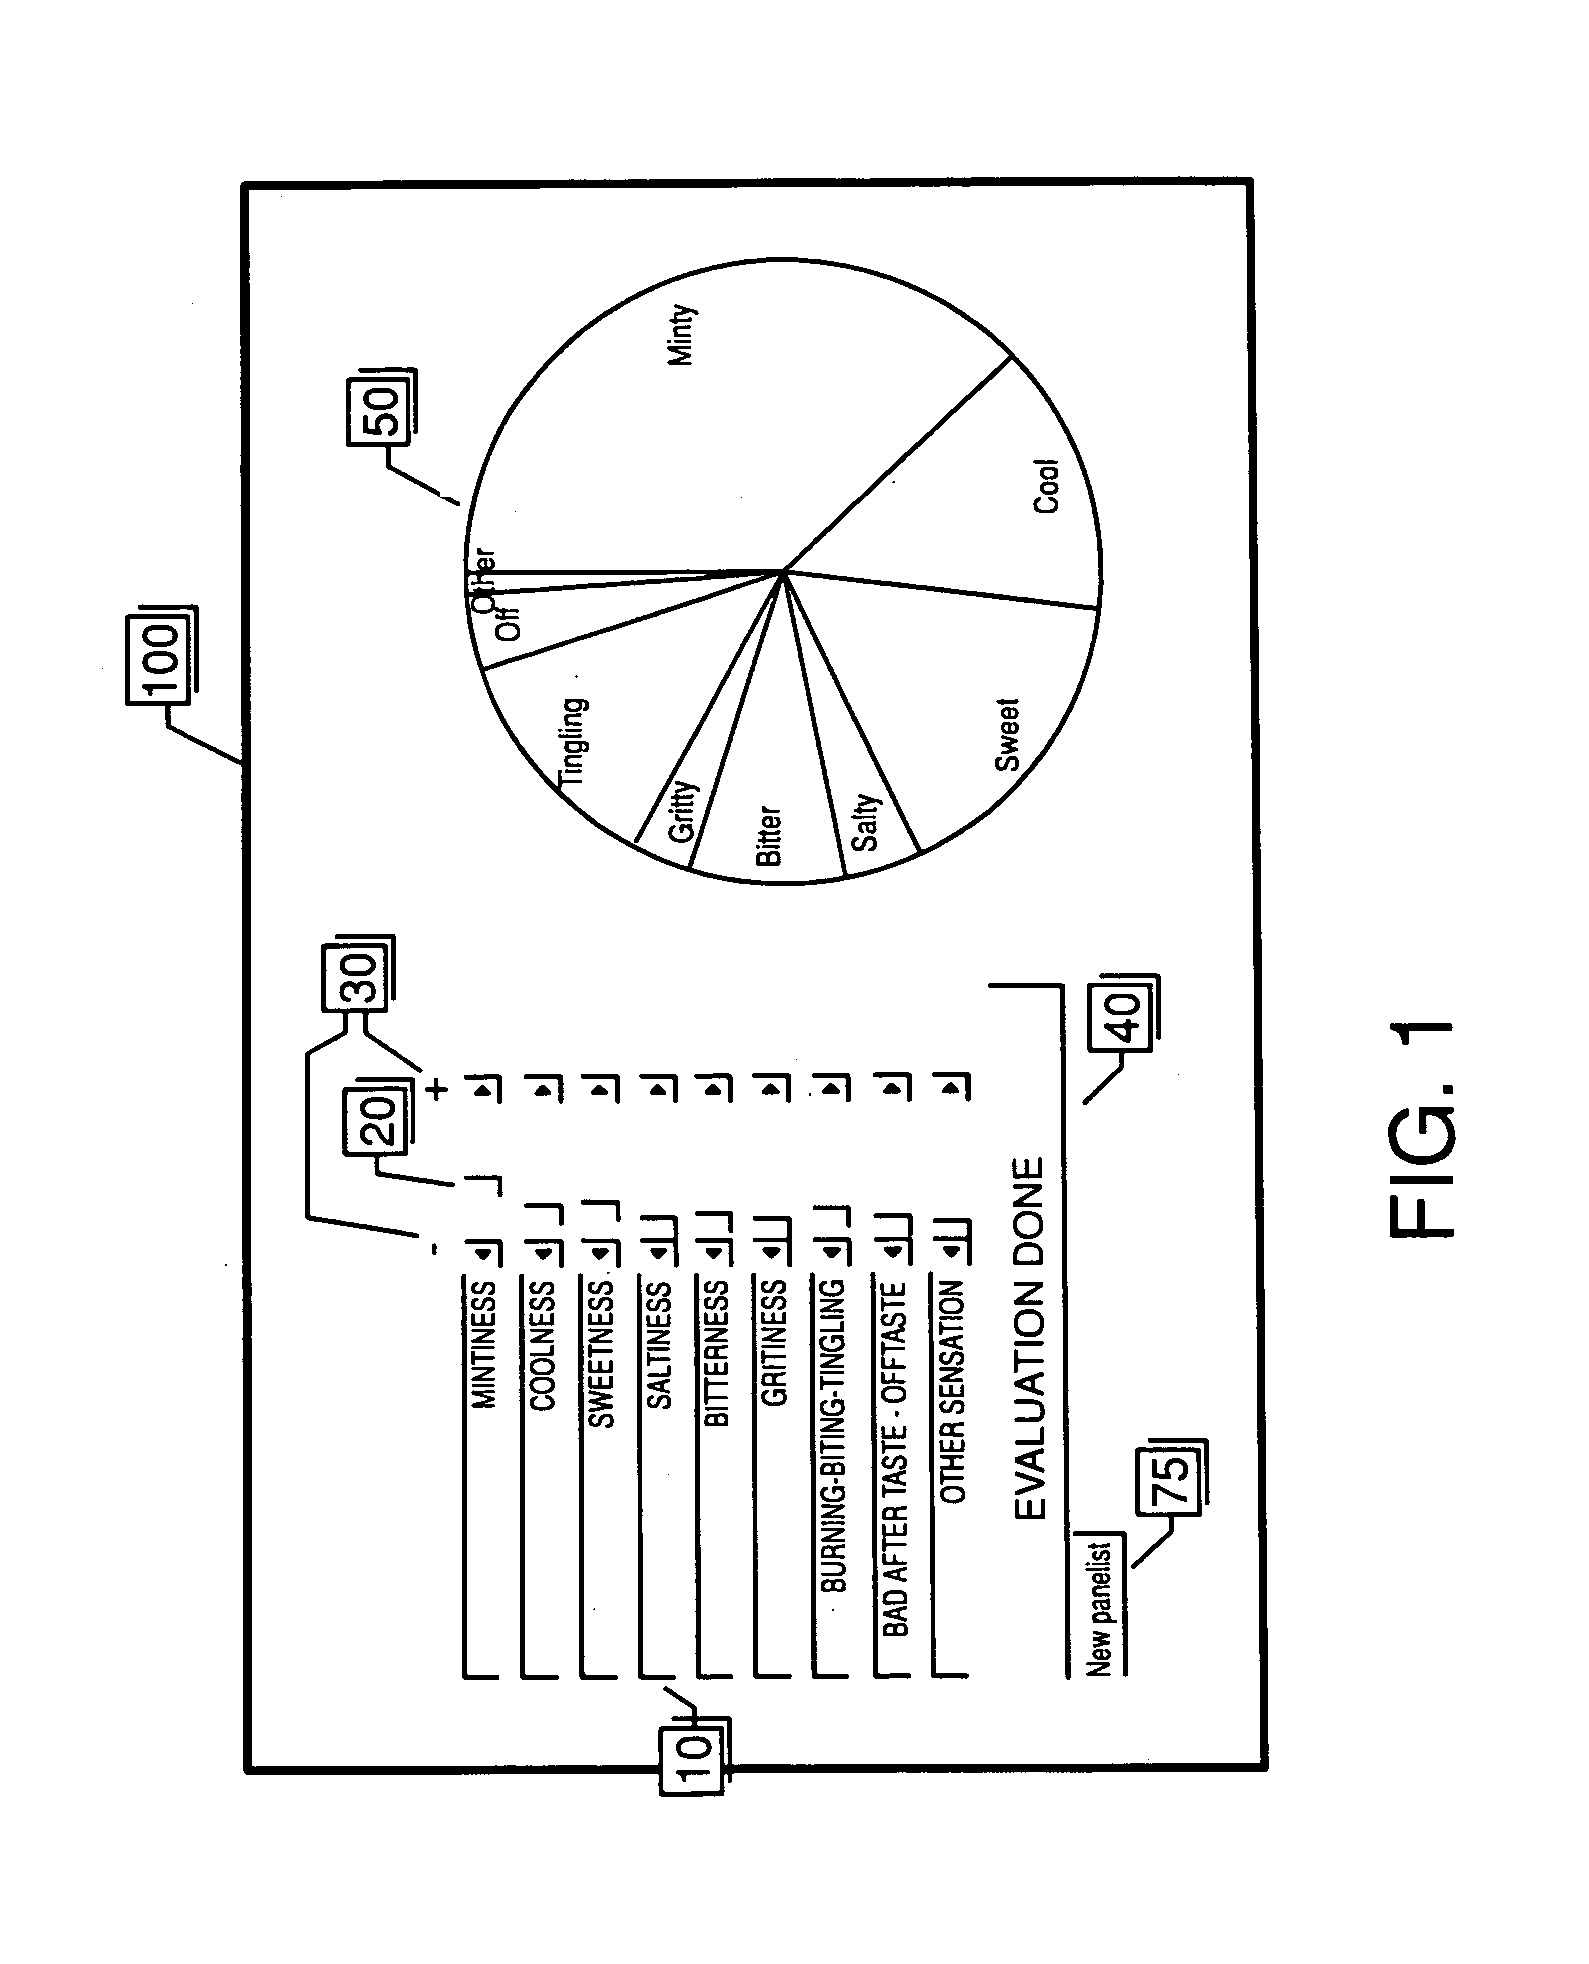
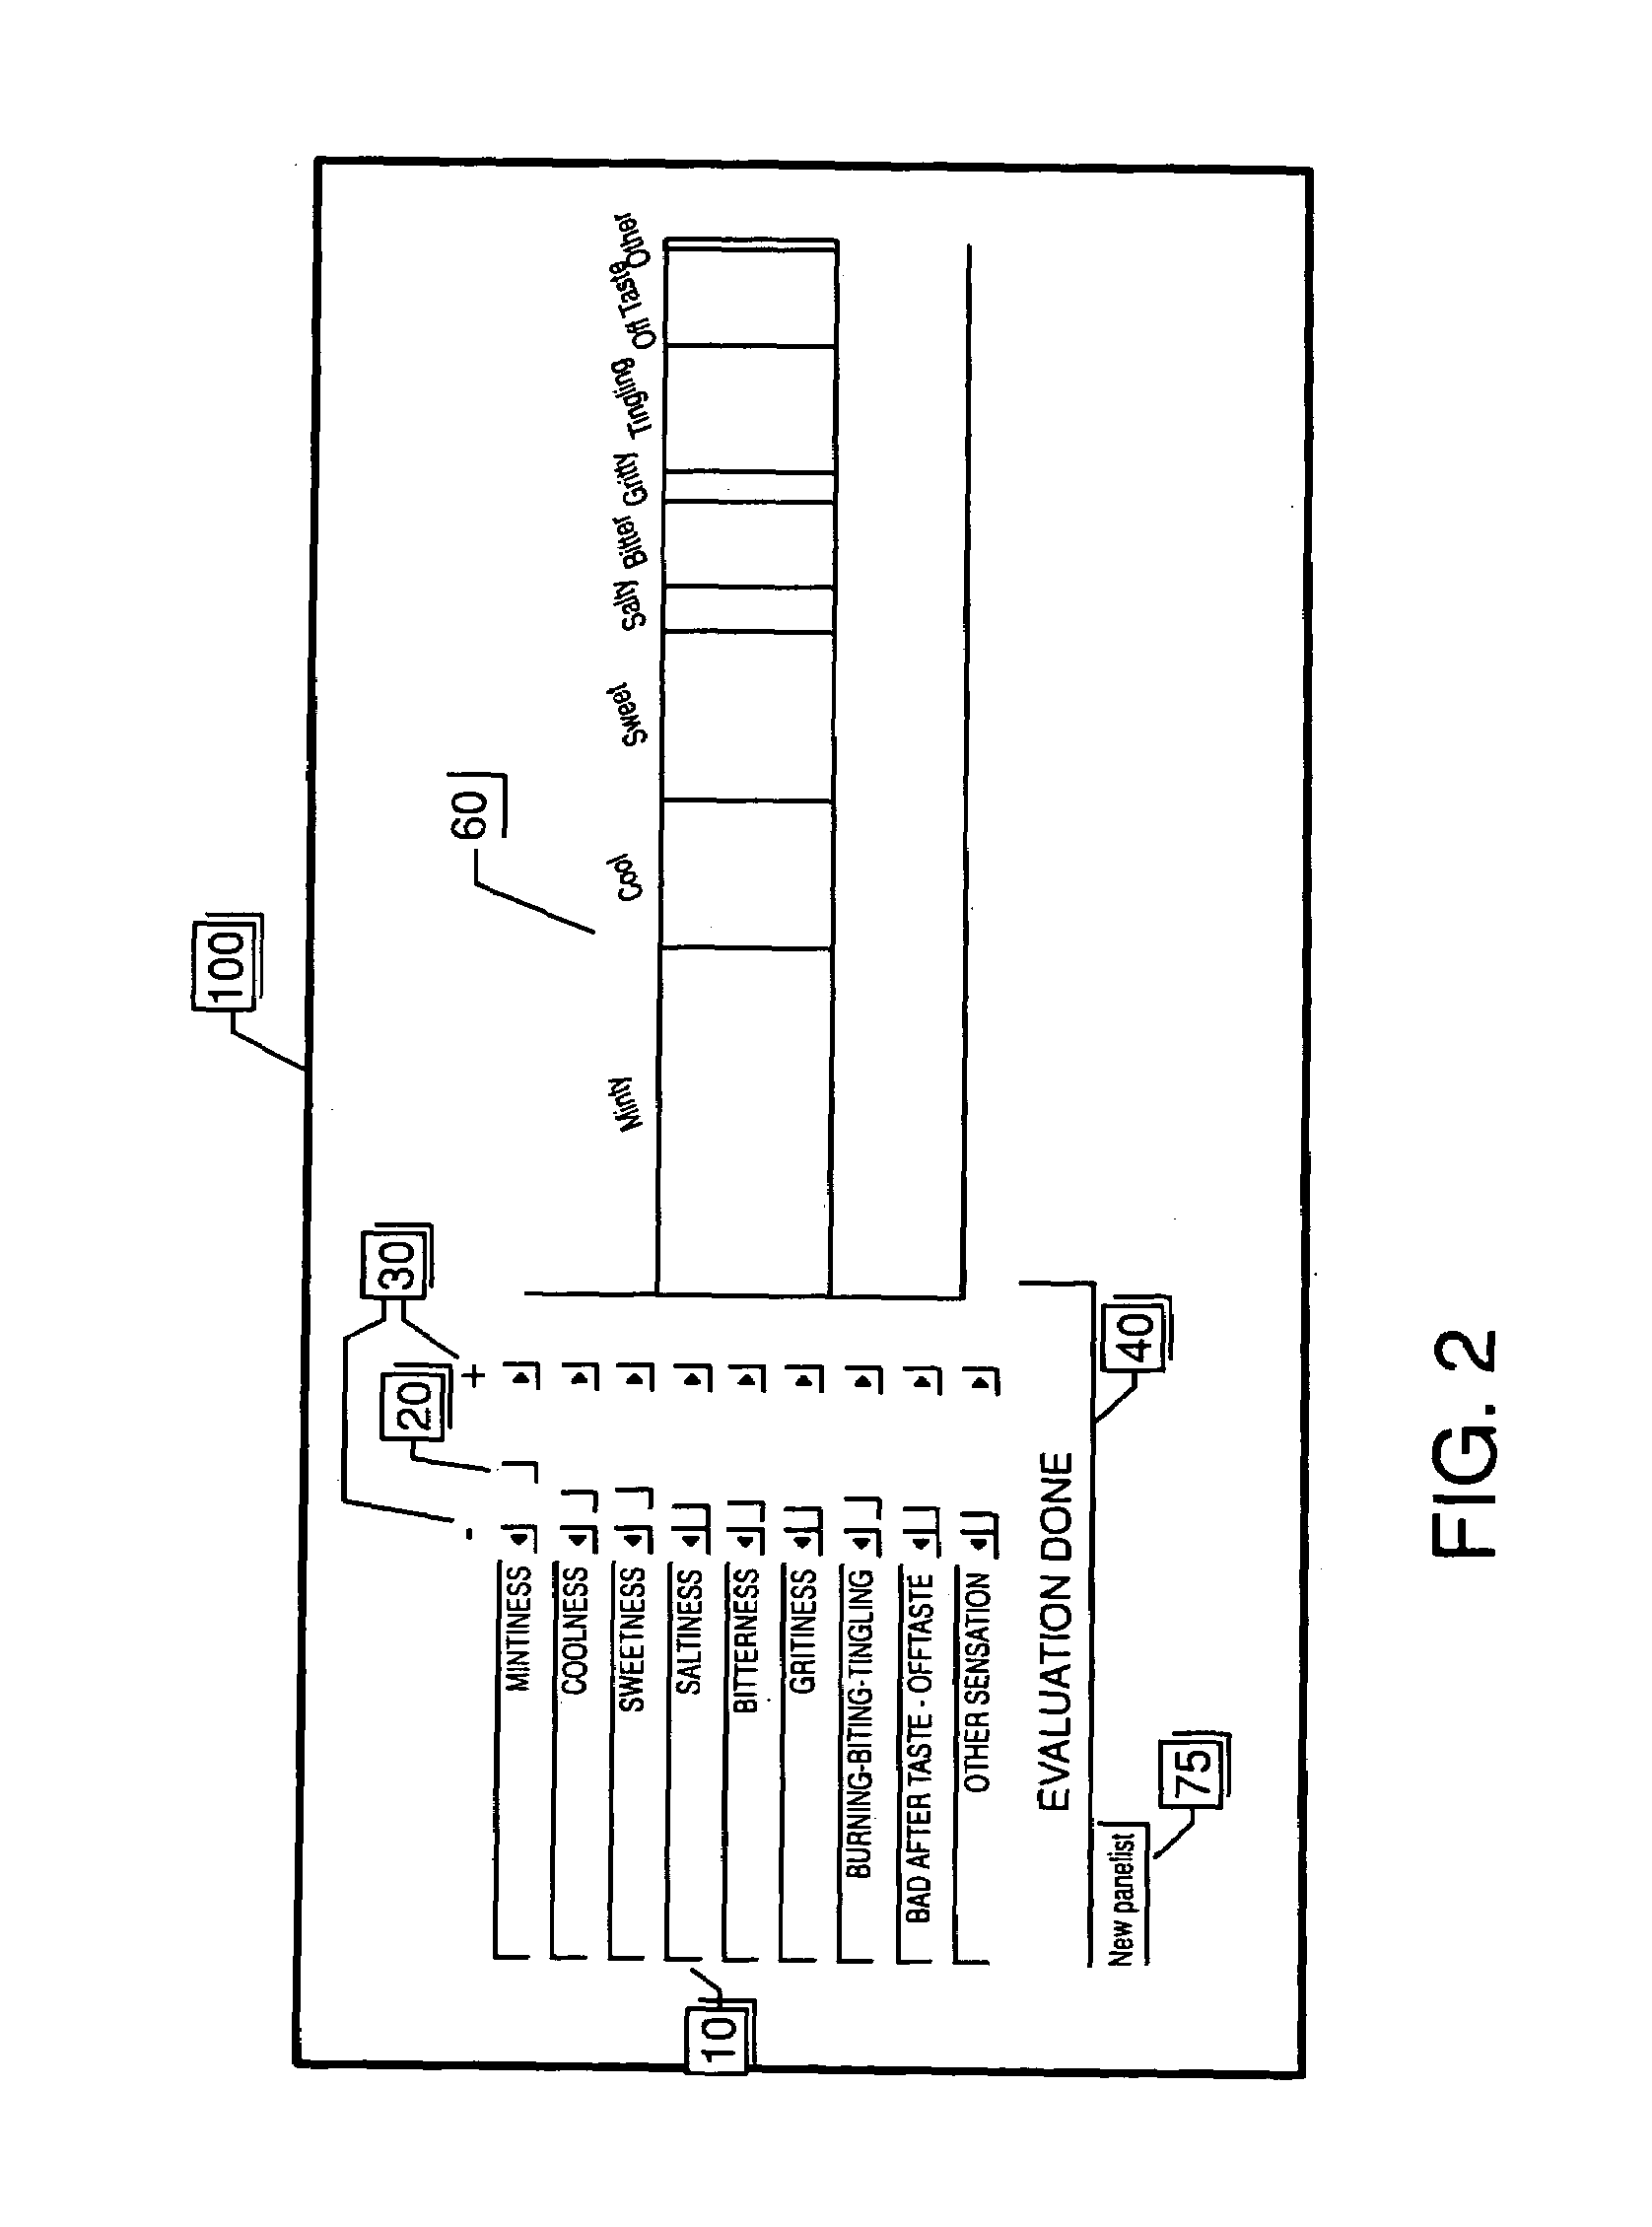
[0033]During the test, the panelists brushed their teeth with the product, 15 seconds on one side of the mouth, 15 seconds on the other side. Prior to rinsing the panelists were asked to rate their liking of the product (9 point hedonic scale), its overall intensity (9 point intensity scale) and the relative contribution of 8 attributes to the overall flavor (‘minty’, ‘coolness’, ‘sweetness’, ‘saltiness’, ‘bitterness’, ‘griminess’, ‘burning-biting-tingling’, ‘bad after-taste / off-taste’) using the method described in the above specification. The panelists made the same evaluation just after rinsing (time 0), at 2 minutes, 4 minutes, 8 minutes and 15 minu...


PUM


Abstract

A method is provided in which the sensory perceptions of the subject are represented in a visual manner, the method provides for a computation of the attributes to automatically total the perceptions tested such that the results to equal 100%. In a preferred embodiment the results are provided as a pie chart or a bar chart with each of the attributes tested provided in a different color to accentuate the relative proportions of the attributes.

Description

FIELD OF THE INVENTION[0001]The present invention is directed to a method for collection and display of the relative contribution of individual sensory attributes in the total perception of a stimulus.BACKGROUND OF THE INVENTION[0002]Respondents are frequently surveyed about their perceptions of a whole host of consumer products that include food, oral care, fragrances as well as other product categories that may also involve visual and / or auditory elements. A typical survey includes questions that aim to estimate the perceived intensity of a number of attributes that describe a given product. In the food category, the list could include such attributes as sweet, sour, salty, bitter and / or other. However, intensity ratings are not the most sensitive way of capturing more subtle but real differences between products that vary along only one, but very important dimension, or groups of people who may vary in their sensitivity to a particular stimulus. See, for example, Cowart, Beverly ...

Claims


Application Information

Patent Timeline
IPC IPC(8): A61B5/00A61B5/16
CPCA61B5/00A61B5/16A61B5/4011G06Q30/0281A61B5/4017A61B5/742A61B5/7435
Inventor GODINOT, NICOLAS MARIE PIERRERANKIN, KRYSTYNA MALGORZATACHRISTENSEN, CAROL M.
Owner INTERNATIONAL FLAVORS & FRAGRANCES
Why Eureka
Try Eureka