Characterizing biological stimuli by response curves

a biological stimuli and response curve technology, applied in the field of biological cell response curves and response curves, can solve the problems of rare and often difficult to identify purified substances having desirable combination bioactive properties, and the vast majority of “hits” generated by such techniques do not possess the right combination of properties to qualify as therapeutic compounds, and are typically found to fail in some regard

Inactive Publication Date: 2006-03-21
CYTOKINETICS INC
View PDF62 Cites 11 Cited by
  • Summary
  • Abstract
  • Description
  • Claims
  • Application Information

AI Technical Summary

Problems solved by technology

Purified substances having a desirable combination bio-active properties are rare and often difficult to identify.
Unfortunately, the vast majority of “hits” generated by such techniques do not possess the right combination of properties to qualify as therapeutic compounds.
When these substances are subjected to low throughput cellular and animal tests to establish their therapeutic usefulness, they are typically found to fail in some regard.
Unfortunately, such tests are time consuming and costly, thus limiting the number of substances that can be tested.
One difficulty in assessing similarity is that compounds often have greatly varying potencies.
It is difficult to make meaningful comparison of two such compounds until the dose scales of these compounds have been adjusted.
Unfortunately, there are significant limits to the value of such comparisons.
So a simple dose response curve may fail to shed light on a mechanism.
While image analysis techniques for characterizing phenotypes can provide many different characteristics of a compound, their full potential has not yet been realized.

Method used


Image

  • Characterizing biological stimuli by response curves
  • Characterizing biological stimuli by response curves
  • Characterizing biological stimuli by response curves

Examples


examples

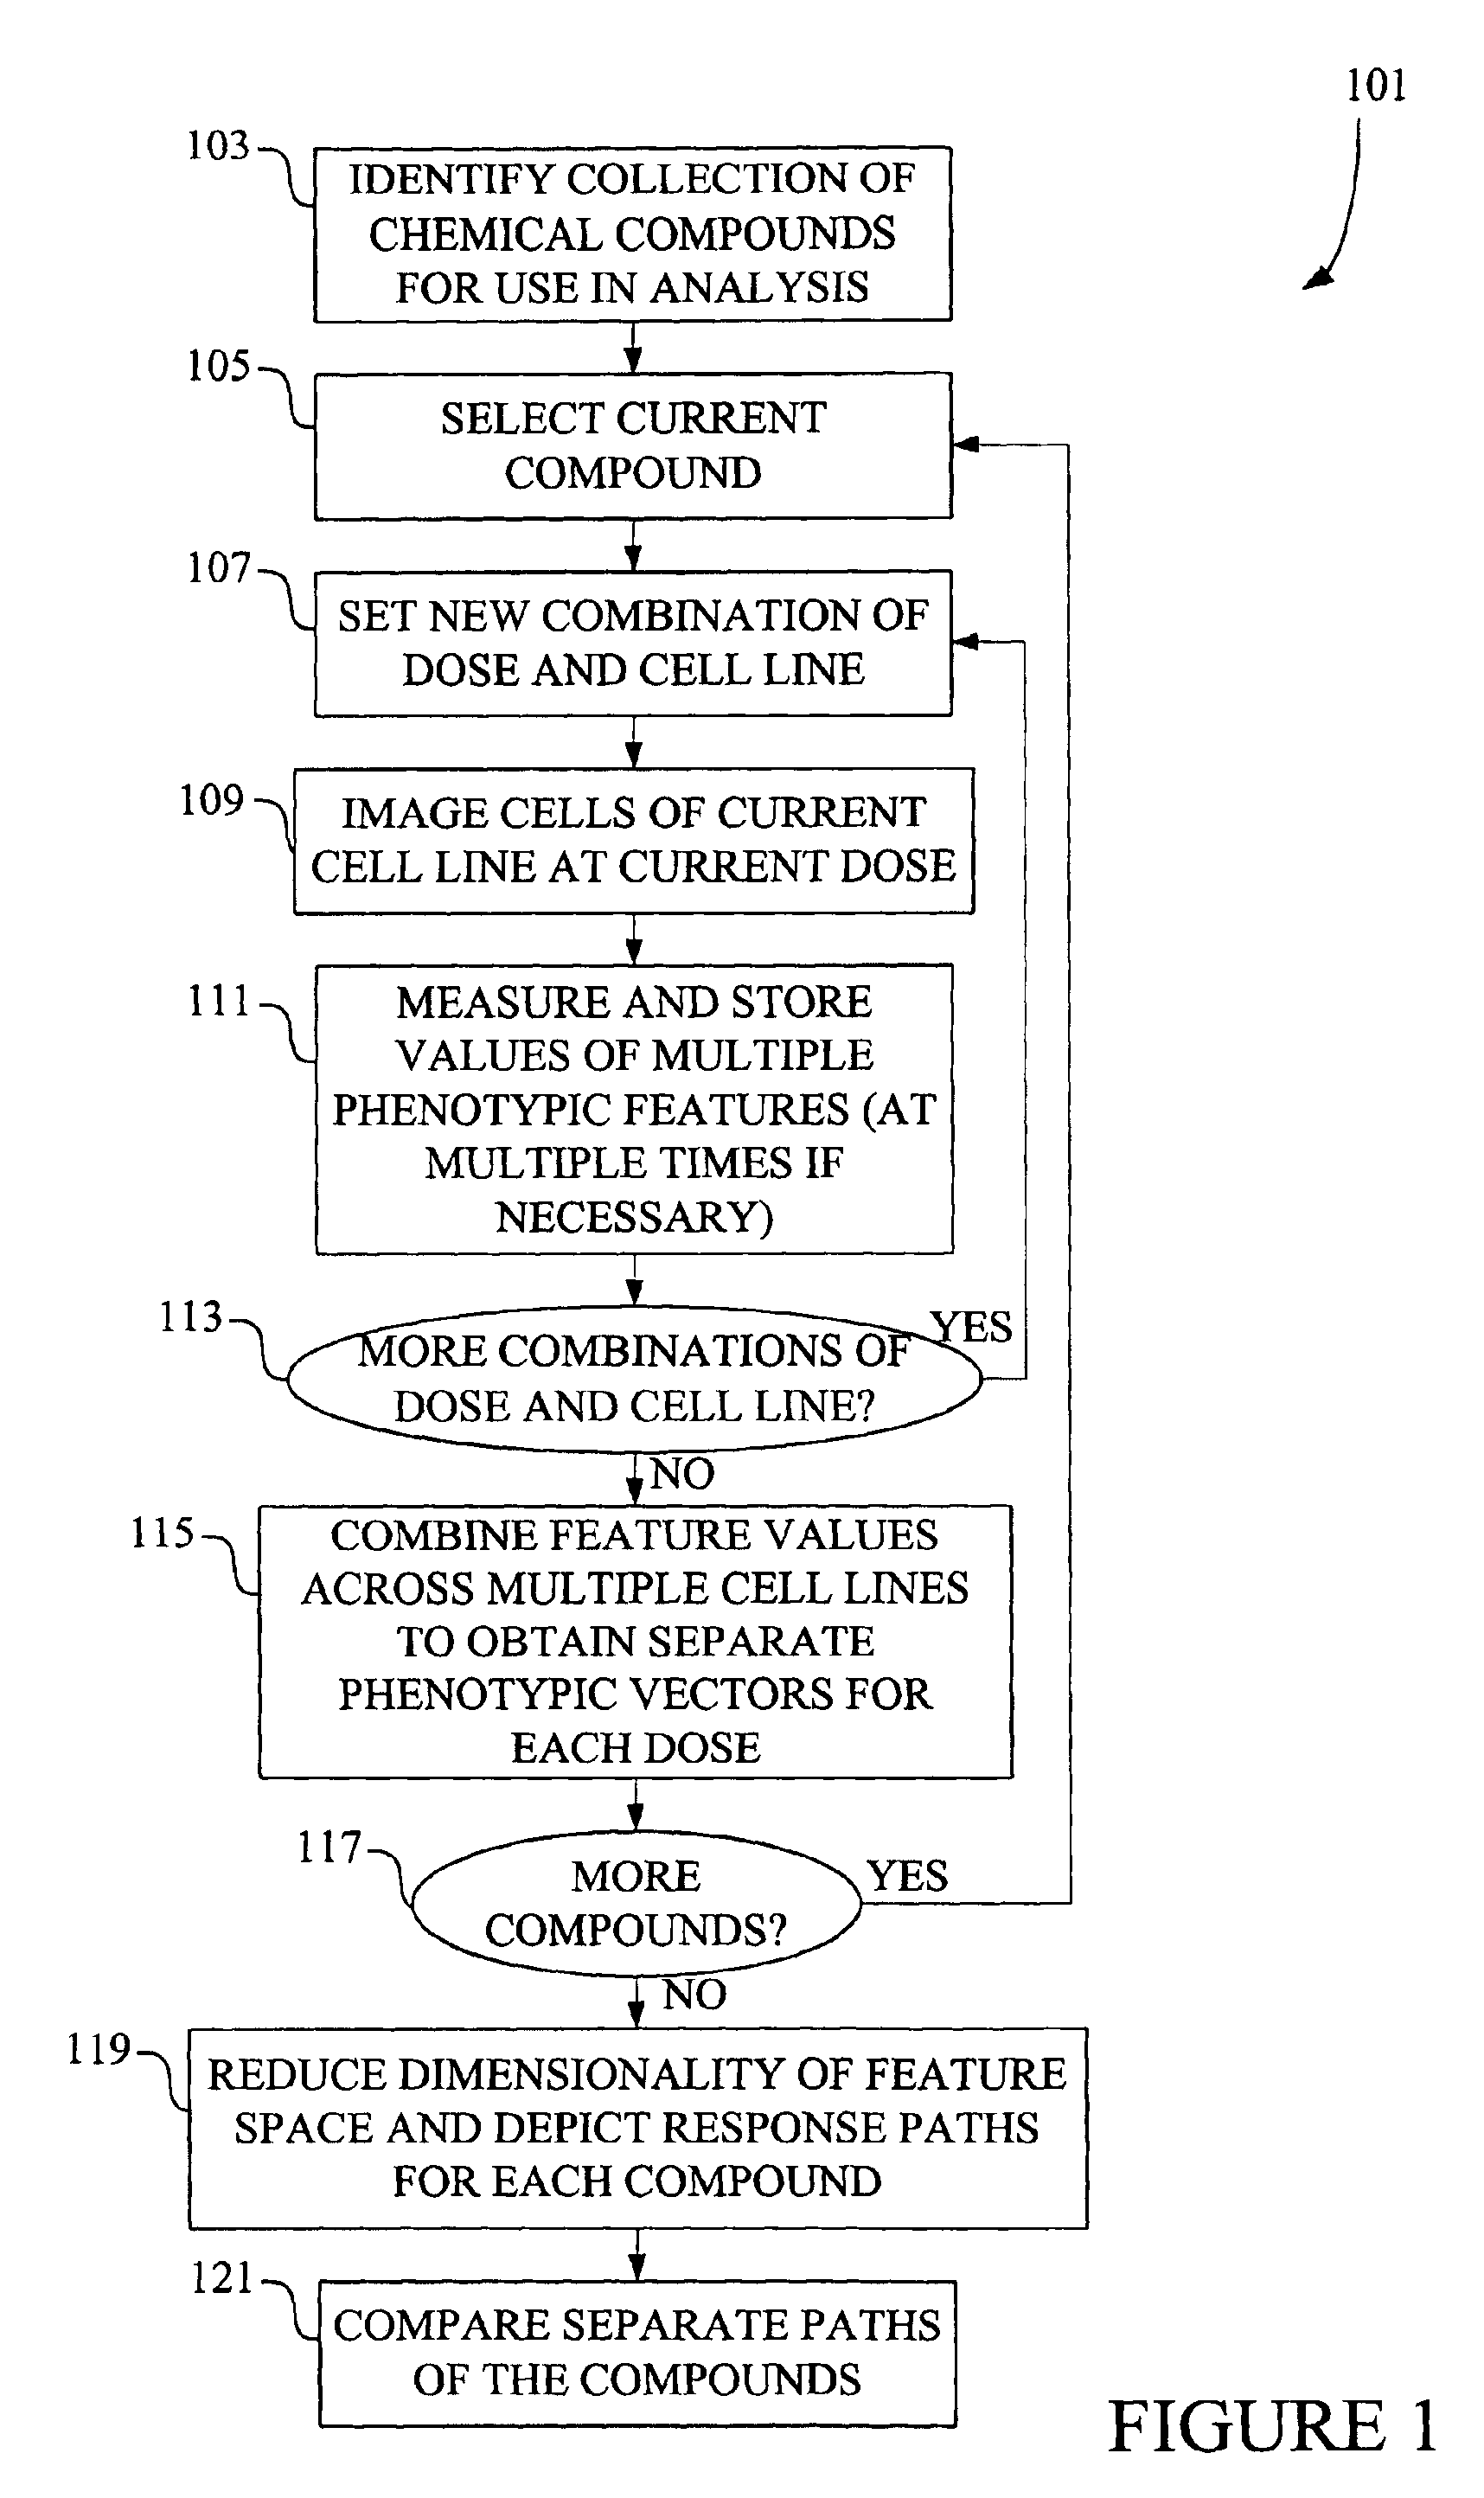
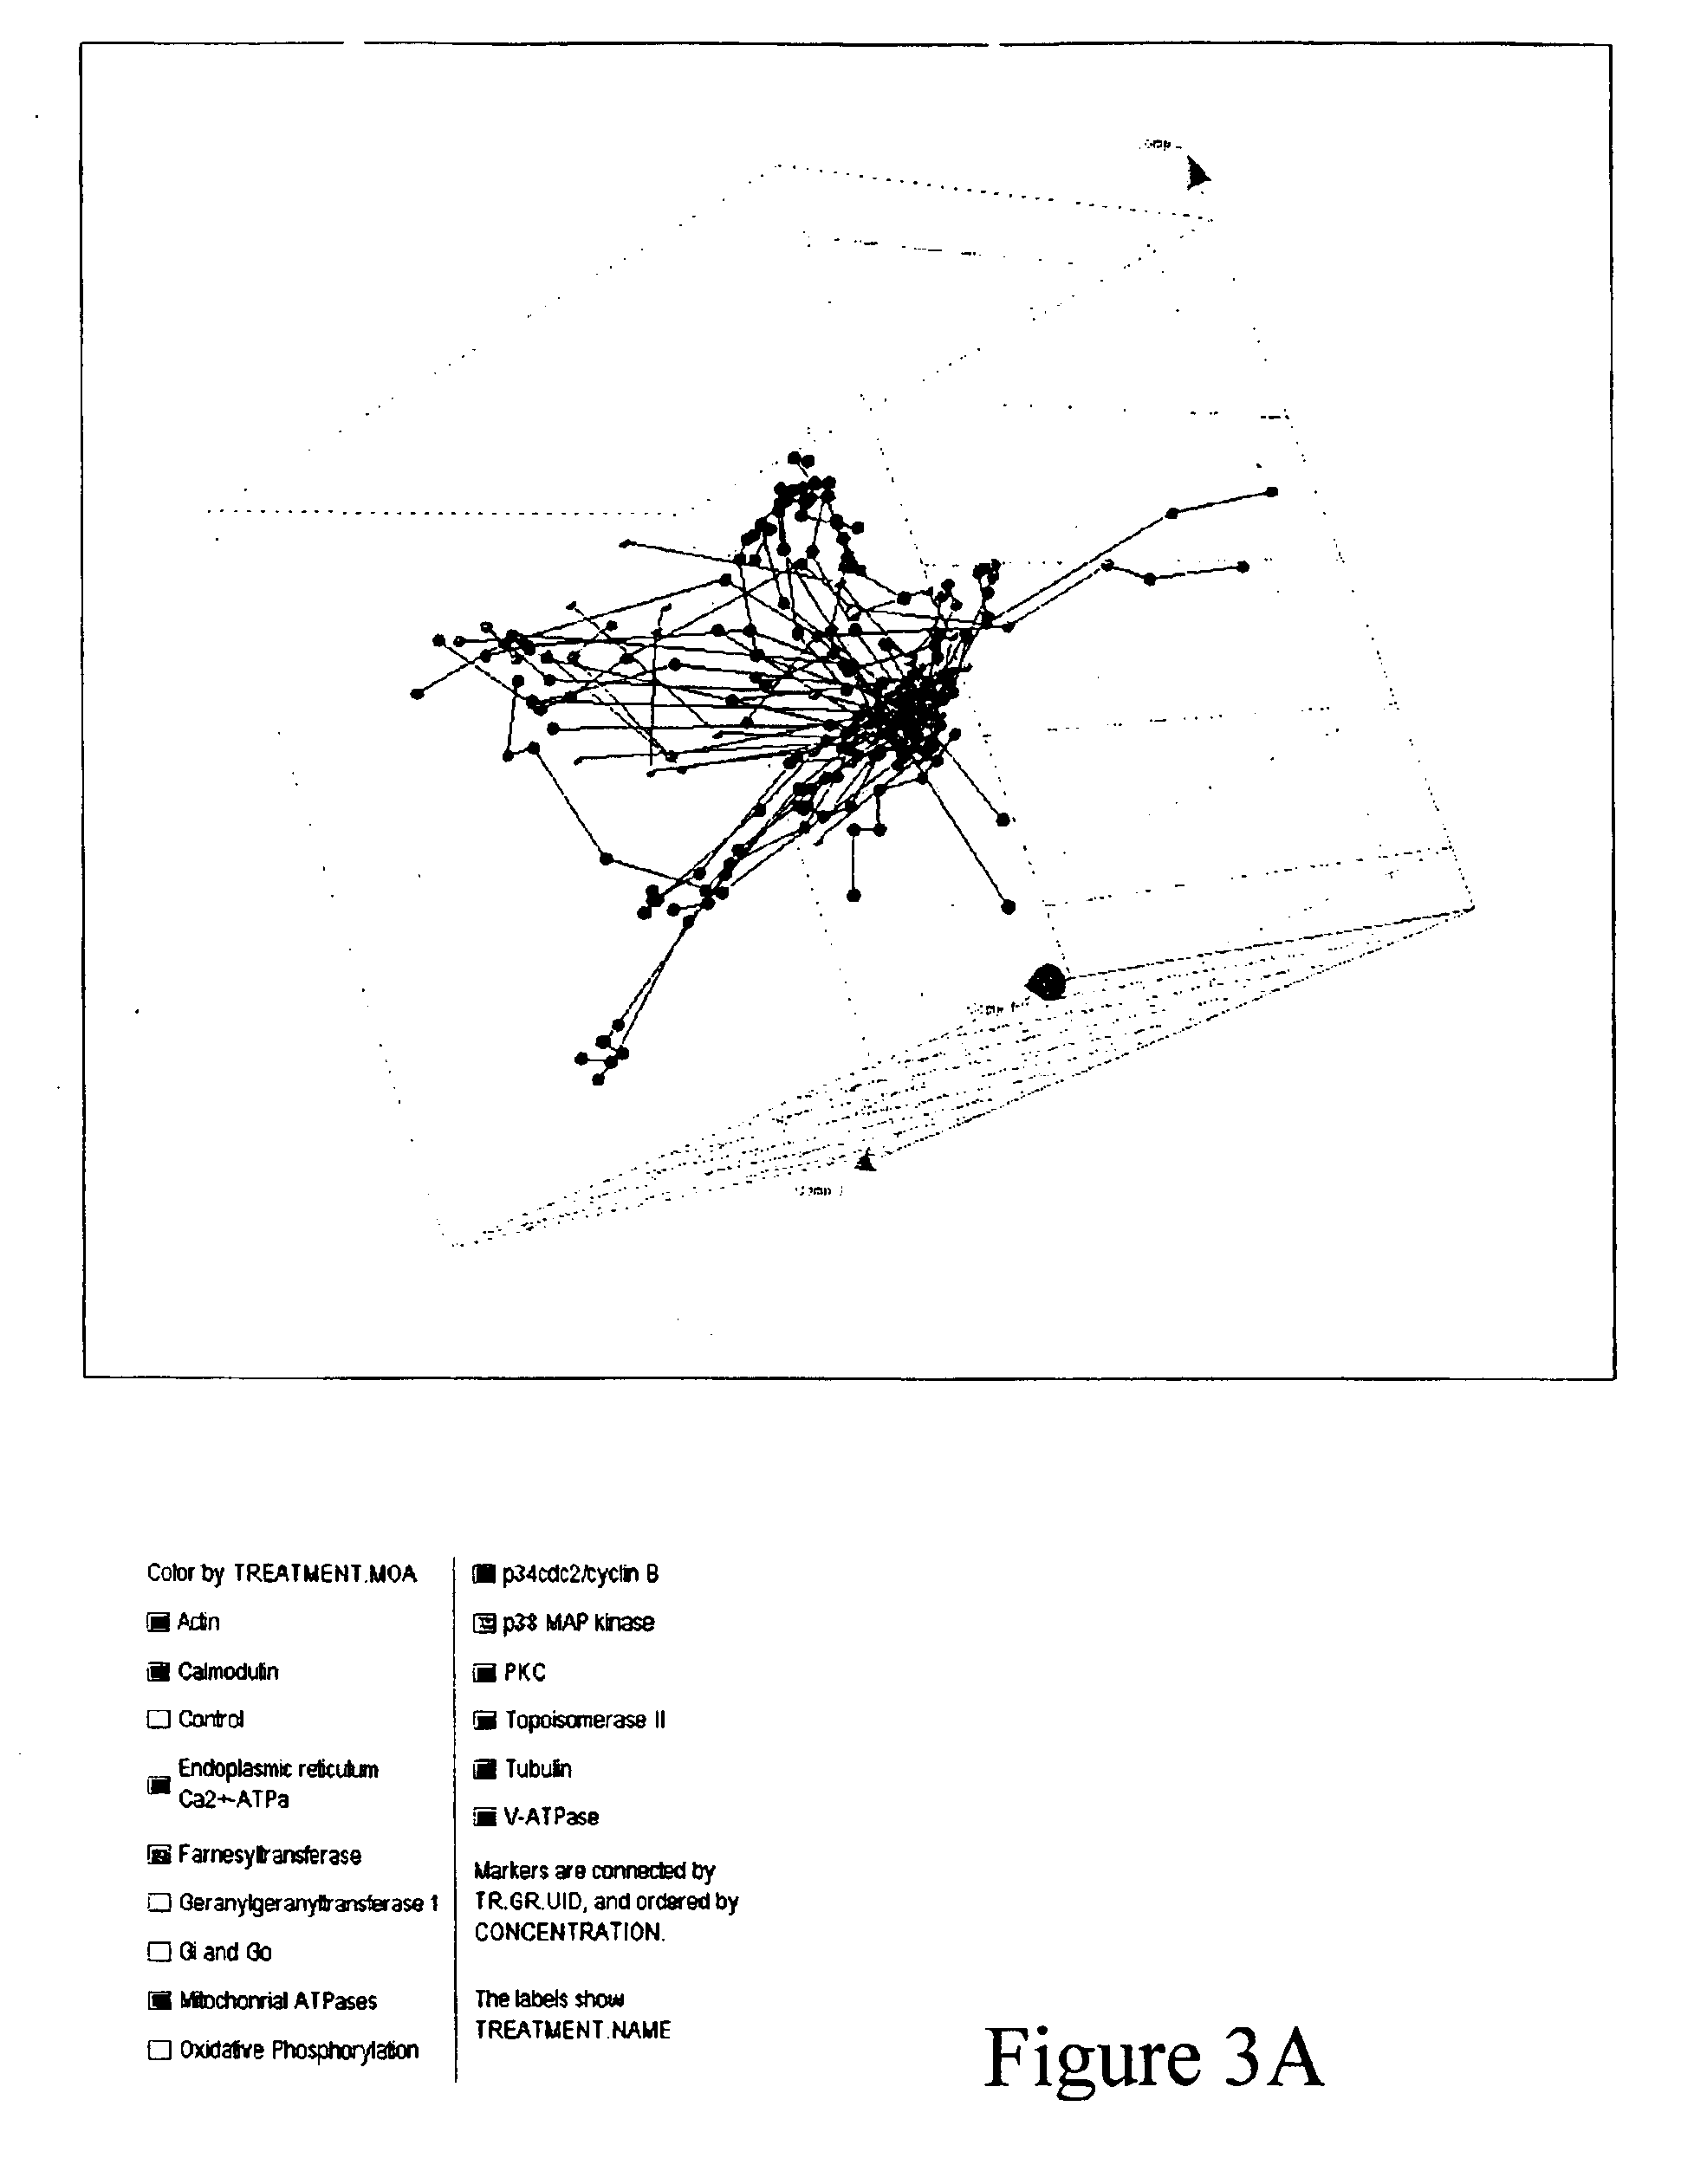
[0118]As indicated above, an underlying premise of this invention is that changes in cell physiology are detectable through single-cell image analysis of cellular markers and, by measuring such changes in a sophisticated fashion, one can monitor biological similarities and differences between compounds. To characterize and demonstrate the ability of multivariate quantitative phenotype response paths to distinguish different classes of molecules, a panel of commercially available compounds with broad mechanisms of action was tested using the present invention. The types of compounds tested are listed in the following table.

[0119]

Number ofClassPrimary Protein TargetCompoundsCalciumEndoplasmic reticulum3Ca2+ − ATPaseCalciumCalmodulin6CytoskeletonActin8CytoskeletonTubulin9G Protein EffectorsG-proteins Gi and Go4Gene RegulationTopoisomerase II6Ion PumpV-ATPase2Oxidative PhosphorylationMitochondrial ATPases3PosttranslationalFarnesyltransferase2ModificationPosttranslationalGeranylgeranyltr...


PUM

PropertyMeasurementUnit
electricalaaaaaaaaaa
magneticaaaaaaaaaa
mechanicalaaaaaaaaaa

Abstract

A method for generating stimulus response curves (e.g., dose response curves) shows how the phenotype of one or more cells change in response to varying levels of the stimulus. Each “point” on the curve represents quantitative phenotype for cell(s) at a particular level of stimulus (e.g., dose of a therapeutic). The quantitative phenotypes are multivariate phenotypic representations of the cell(s). They include various features of the cell(s) obtained by image analysis. Such features often include basic parameters obtained from images (e.g., cell shape, nucleus area, Golgi texture) and / or biological characterizations derived from the basic parameters (e.g., cell cycle state, mitotic index, etc.). The stimulus response curves may be compared to allow classification of stimuli and identify subtle differences in related stimuli. To facilitate the comparison, it may be desirable to present the response curves in a principal component space.

Description

CROSS-REFERENCE TO RELATED APPLICATIONS[0001]This application is related to the following co-pending U.S. patent applications, U.S. patent application Ser. No. 09 / 310,879 by Vaisberg et al., and titled DATABASE METHOD FOR PREDICTIVE CELLULAR BIOINFORMATICS; U.S. patent application Ser. No. 09 / 311,996 by Vaisberg et al., and titled DATABASE SYSTEM INCLUDING COMPUTER FOR PREDICTIVE CELLULAR BIOINFORMATICS; U.S. patent application Ser. No. 09 / 311,890, now U.S. Pat. No. 6,743,576, by Vaisberg et al., and titled DATABASE SYSTEM FOR PREDICTIVE CELLULAR BIOINFORMATICS. Each of these applications was filed on May 14, 1999. This application is also related to U.S. patent application Ser. No. 09 / 729,754, now U.S. Pat. No. 6,876,760, by Vaisberg et al., and titled CLASSIFYING CELLS BASED ON INFORMATION CONTAINED IN CELL IMAGES filed on Dec. 4, 2000. This application is further related to U.S. patent application Ser. No. 09 / 792,013 (Pulblication No. 20020154798) by Vaisberg et al., and titled E...

Claims


Application Information

Patent Timeline
Patent Type & Authority Patents(United States)
IPC IPC(8): G01N33/48G06K9/00G06K9/62G16C20/80
CPCG06K9/6253G06K9/00127G06F19/70G16C99/00G16C20/80G06V20/69G06V10/945G06F18/40
Inventor VAISBERG, EUGENI A.OESTREICHER, DONALD R.ADAMS, CYNTHIA L.
Owner CYTOKINETICS INC
Why Eureka
Try Eureka