Automatic tone mapping for images

a tone mapping and image technology, applied in the field of image processing, can solve the problems of complex above-the-scene technique, inability to accurately match the original scene luminance level, and inability to accurately match the luminance level of the original scene, etc., to achieve automatic mapping of tone levels, improve the appearance, and be pleasing to the eye.

Inactive Publication Date: 2006-11-14
CANON KK
View PDF11 Cites 52 Cited by
  • Summary
  • Abstract
  • Description
  • Claims
  • Application Information

AI Technical Summary

Problems solved by technology

The above technique is complicated by the fact that the range of luminance values that can be displayed by a typical output medium is much smaller than the range that exists in the real world.
In addition, it is not necessarily desirable to accurately match the original scene luminance levels to a corresponding level for display on the output medium.
A major disadvantage of the zone system is its requirement for performance of complex calculations by the photographer at the time of taking the picture.
Clearly, the application of the zone system is manual and requires expertise well beyond the skills of an amateur.
The Holm approach suffers from the same complexity disadvantage suffered by the zone system, namely, that of requiring extensive knowledge about the camera and the output medium.
Another drawback of the Holm approach is that it achieves tonal mapping based on tonal statistics of the entire image without consideration of individual areas within the image that a typical viewer would likely find most interesting.
This is because the algorithm developed by Holm has no way of inferring which parts of the captured image are more interesting and which parts are less interesting to a viewer.
Accordingly, resulting printed images obtained from such cameras are not optimal in providing aesthetic pleasure to the viewer because the tone-mapping has not been adjusted based on objects of interest in the image.

Method used


Image

  • Automatic tone mapping for images
  • Automatic tone mapping for images
  • Automatic tone mapping for images

Examples


Embodiment Construction

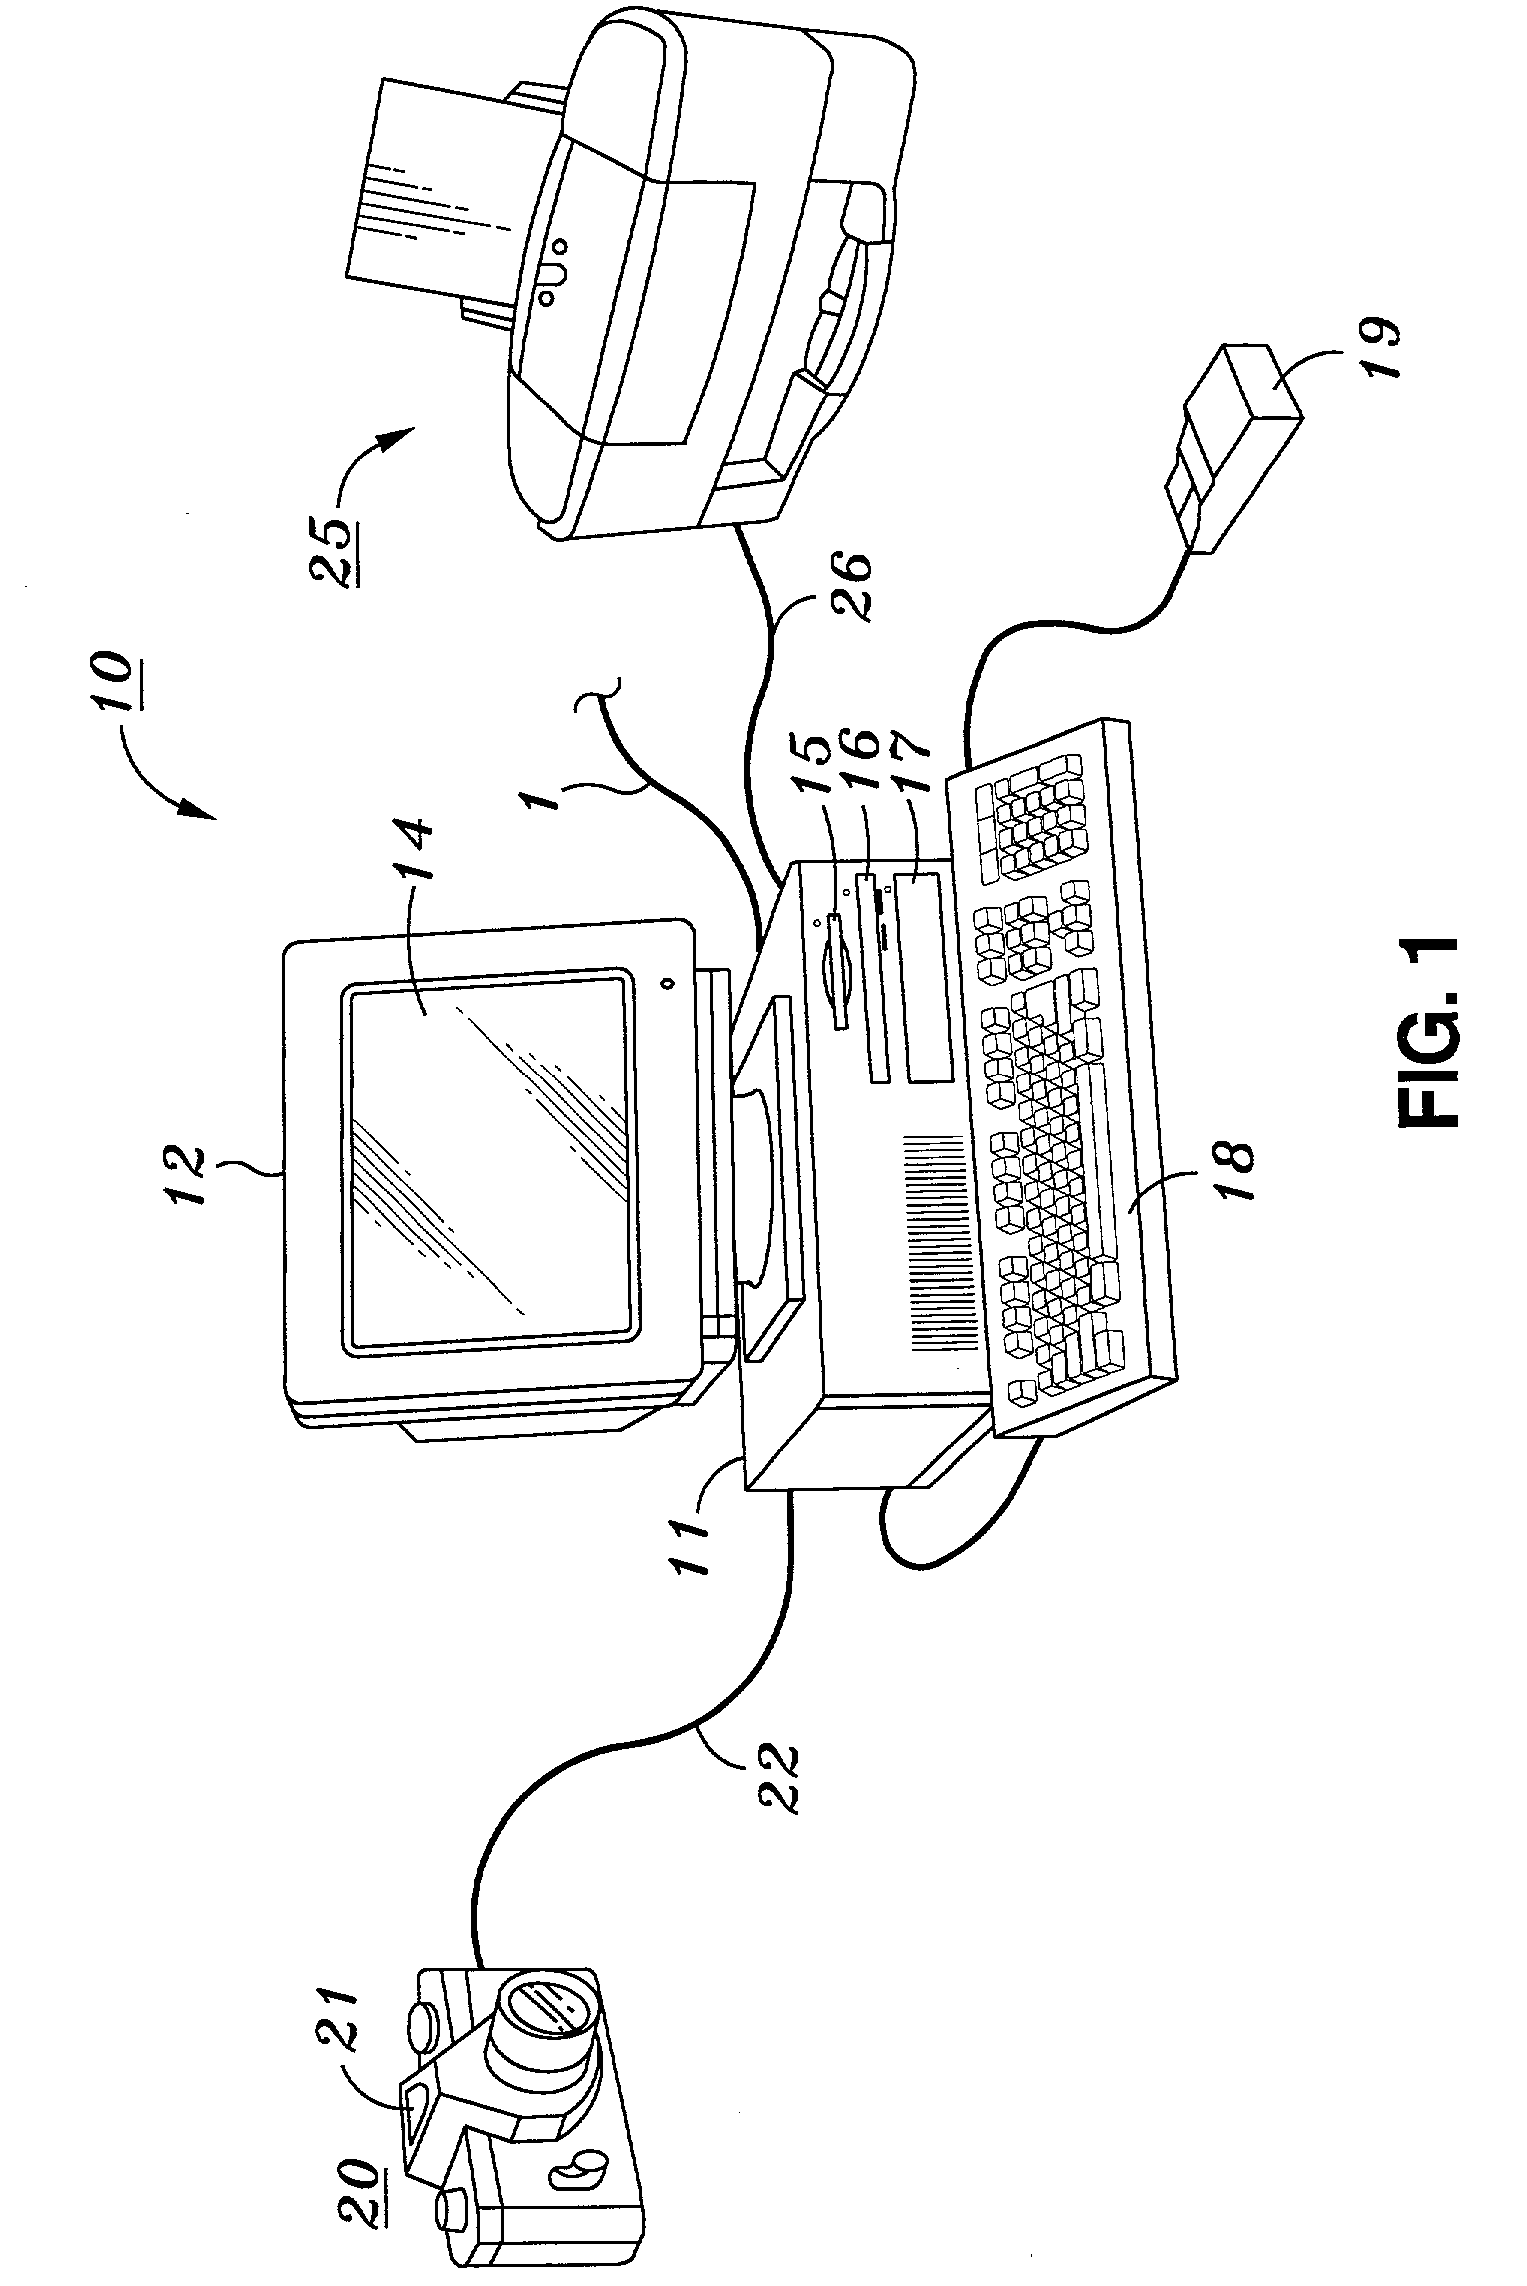
[0029]FIG. 1 is a view showing the outward appearance of a representative embodiment of the invention. As seen in FIG. 1, a computing environment is shown which includes computing equipment 10, image capture device 20 and printer 25. Computing equipment 10 includes host processor 11, color monitor 12, display screen 14, keyboard 18, pointing device 19, fixed disk 17, floppy disk drive 15, CD-ROM drive 16. Each of these elements will now be described in more detail.

[0030]Host processor 11 comprises a typical computer workstation that is capable of displaying images. Host processor 11 preferably executes a windowing operating system such as Microsoft Windows, Linux with the X window system or MacIntosh operating systems. Provided with computing equipment 10 are color monitor 12 including display screen 14, keyboard 18 for entering text data and user commands, and pointing device 19. Pointing device 19 preferably comprises a mouse, for pointing, selecting and manipulating objects displ...


PUM


Abstract

An image processing method for processing image data comprises the steps of obtaining scanpath data corresponding to original image data, determining regions of interest for the original image data based on the obtained scanpath data, and mapping tone values of the original image data corresponding to each region of interest in order to obtain tone-mapped image data.

Description

BACKGROUND OF THE INVENTION[0001]1. Field of the Invention[0002]The present invention relates to the field of image processing and in particular to tone-mapping of luminance levels of an original image to adjusted luminance levels for improved appearance of the image on an output medium.[0003]2. Description of the Related Art[0004]In the field of image processing and in the art of photography, tonal range, also known as luminance range or brightness range, is the difference between the maximum (highlights) and minimum (shadows) amounts of light reflected from a subject. With respect to color images, tonal range refers to the lightness of the colors, without regard to their hue or colorfulness. Although due to the Helmholtz-Kohlrausch effect, colors of higher chroma appear lighter than measurements would indicate. The differences in tonal value create contrast. Contrast, in turn, defines shapes and helps objects to be seen more clearly in a viewed image.[0005]In the art of photograph...

Claims


Application Information

Patent Timeline
Patent Type & Authority Patents(United States)
IPC IPC(8): G09G5/02G06T5/40G06T7/20H04N1/407H04N1/60
CPCH04N1/4072H04N1/6072
Inventor NEWMAN, TODD
Owner CANON KK
Why Eureka
Try Eureka