

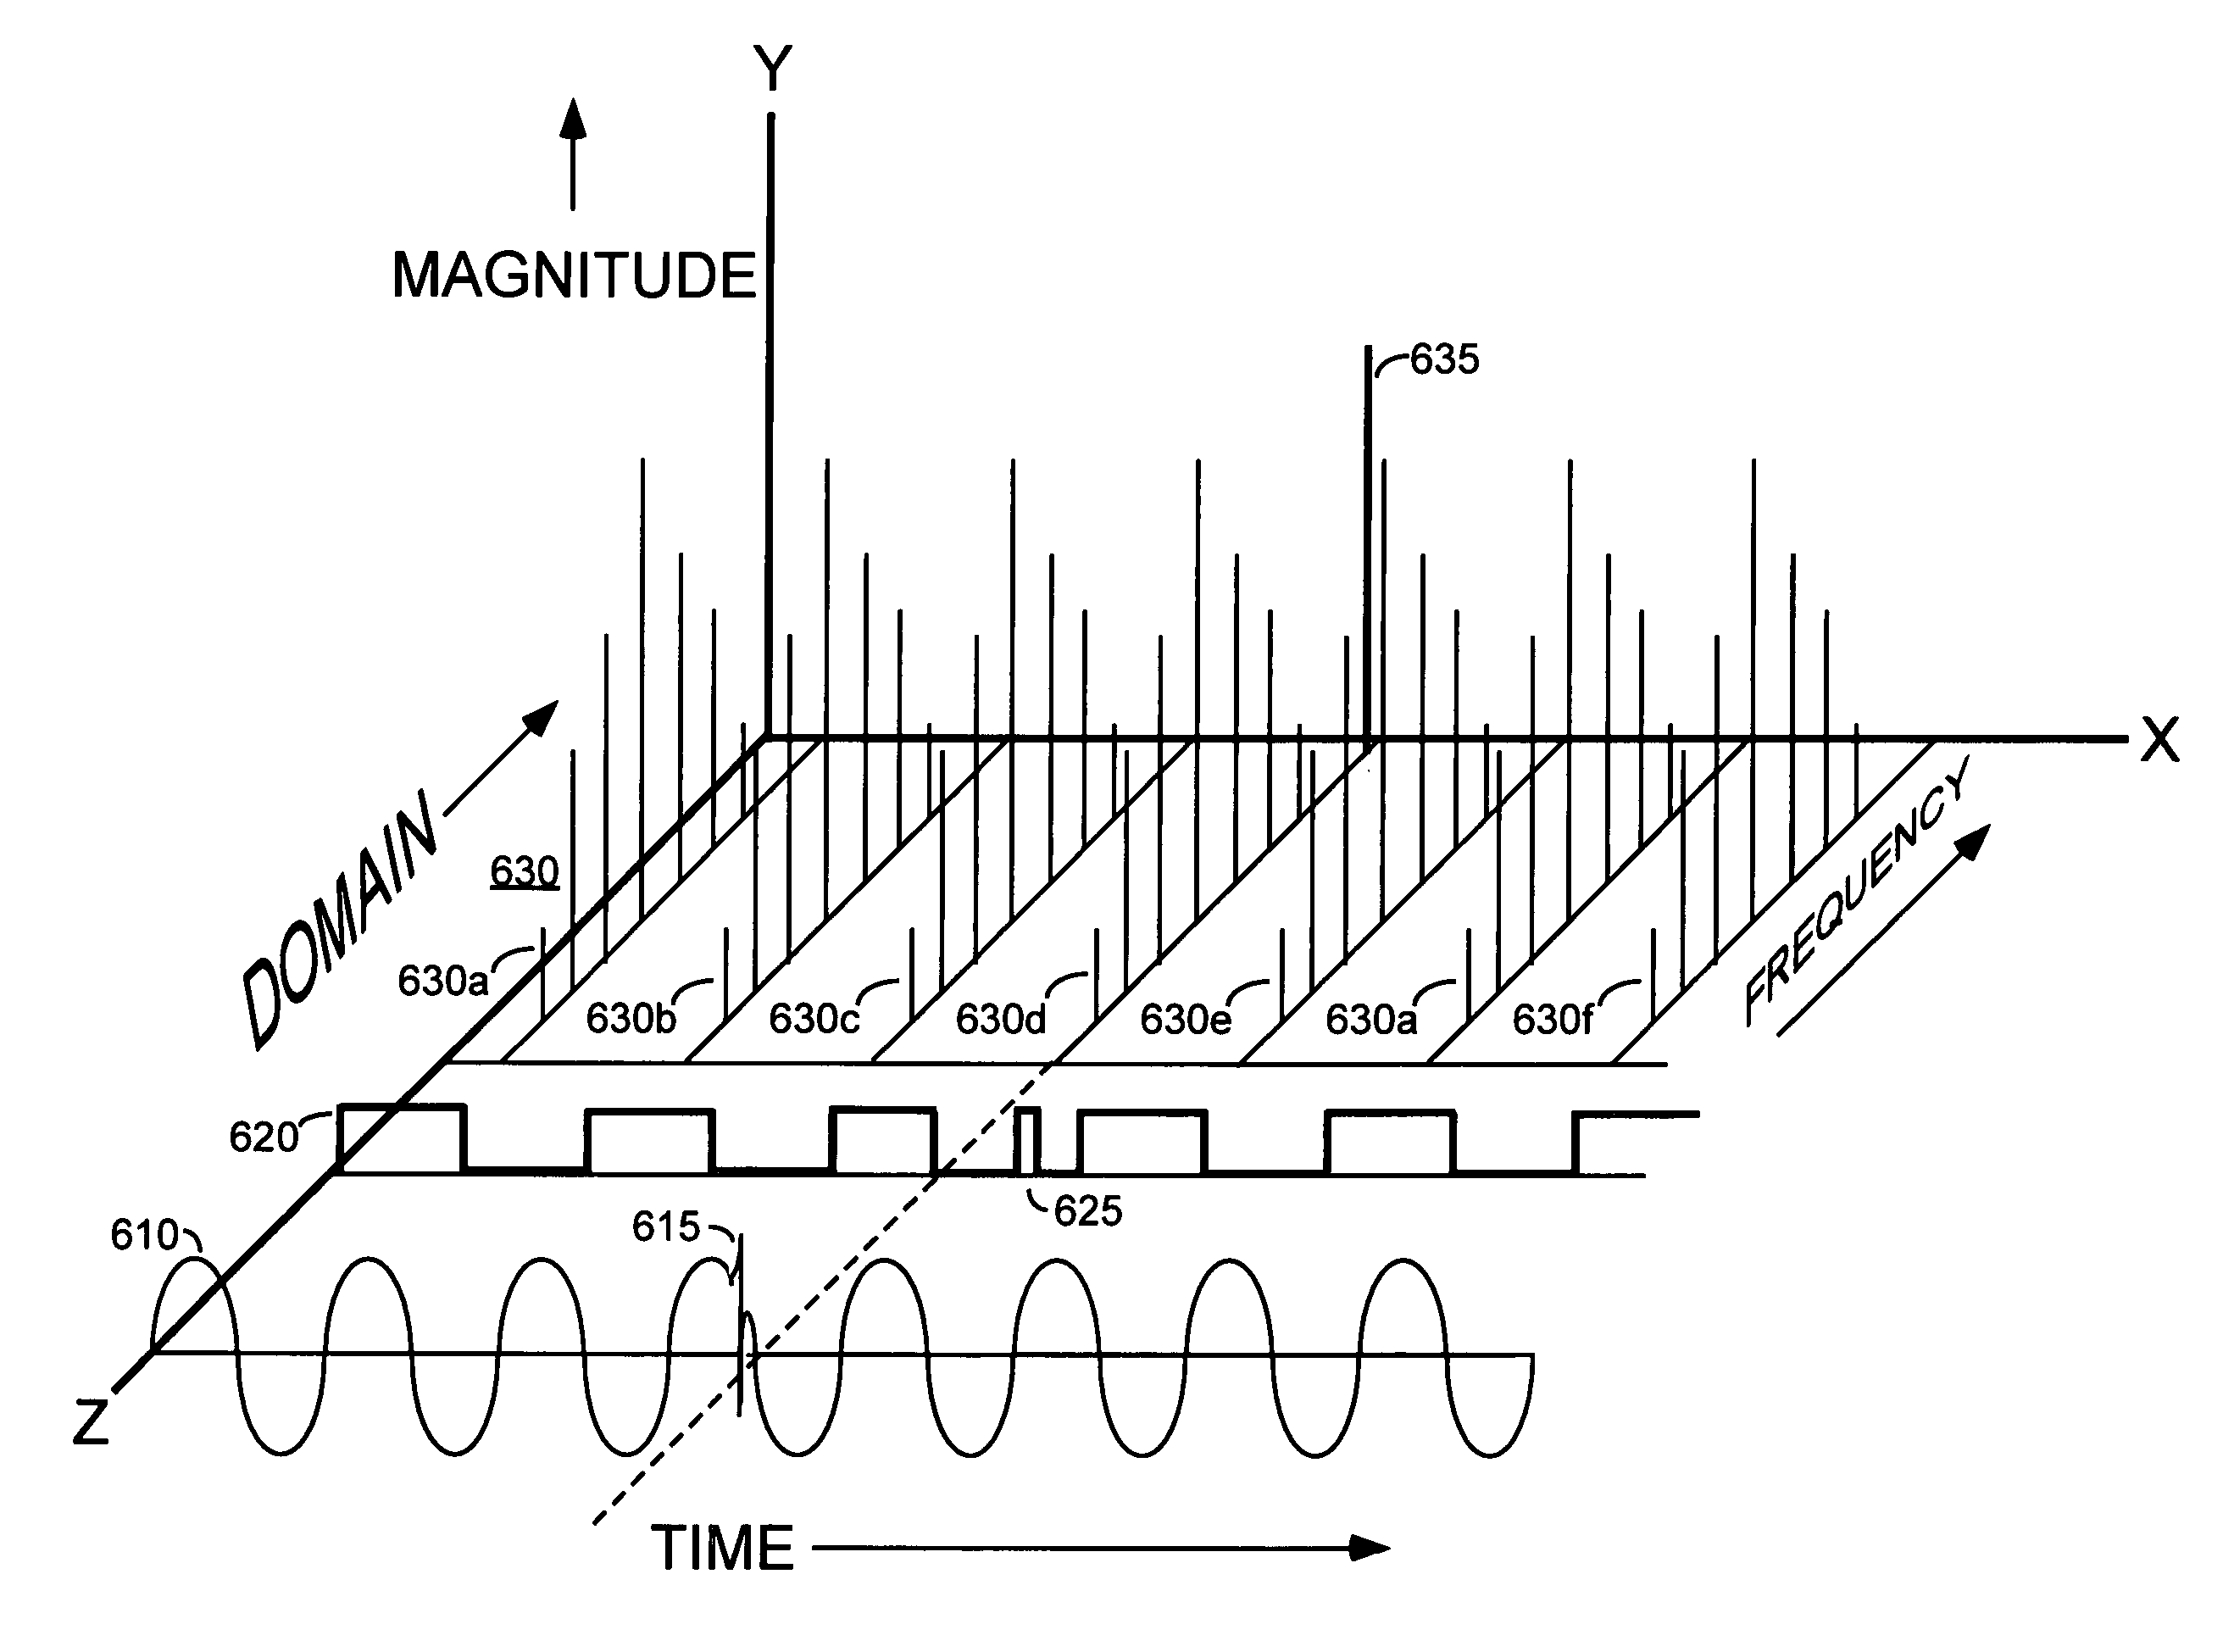
Three dimensional correlated data display
a three-dimensional, correlated technology, applied in the field of graphic visualization tools, can solve problems such as the difficulty of user correlation of information and measurement domains
- Summary
- Abstract
- Description
- Claims
- Application Information
AI Technical Summary
Benefits of technology
Problems solved by technology
Method used
Image

Examples
Embodiment Construction
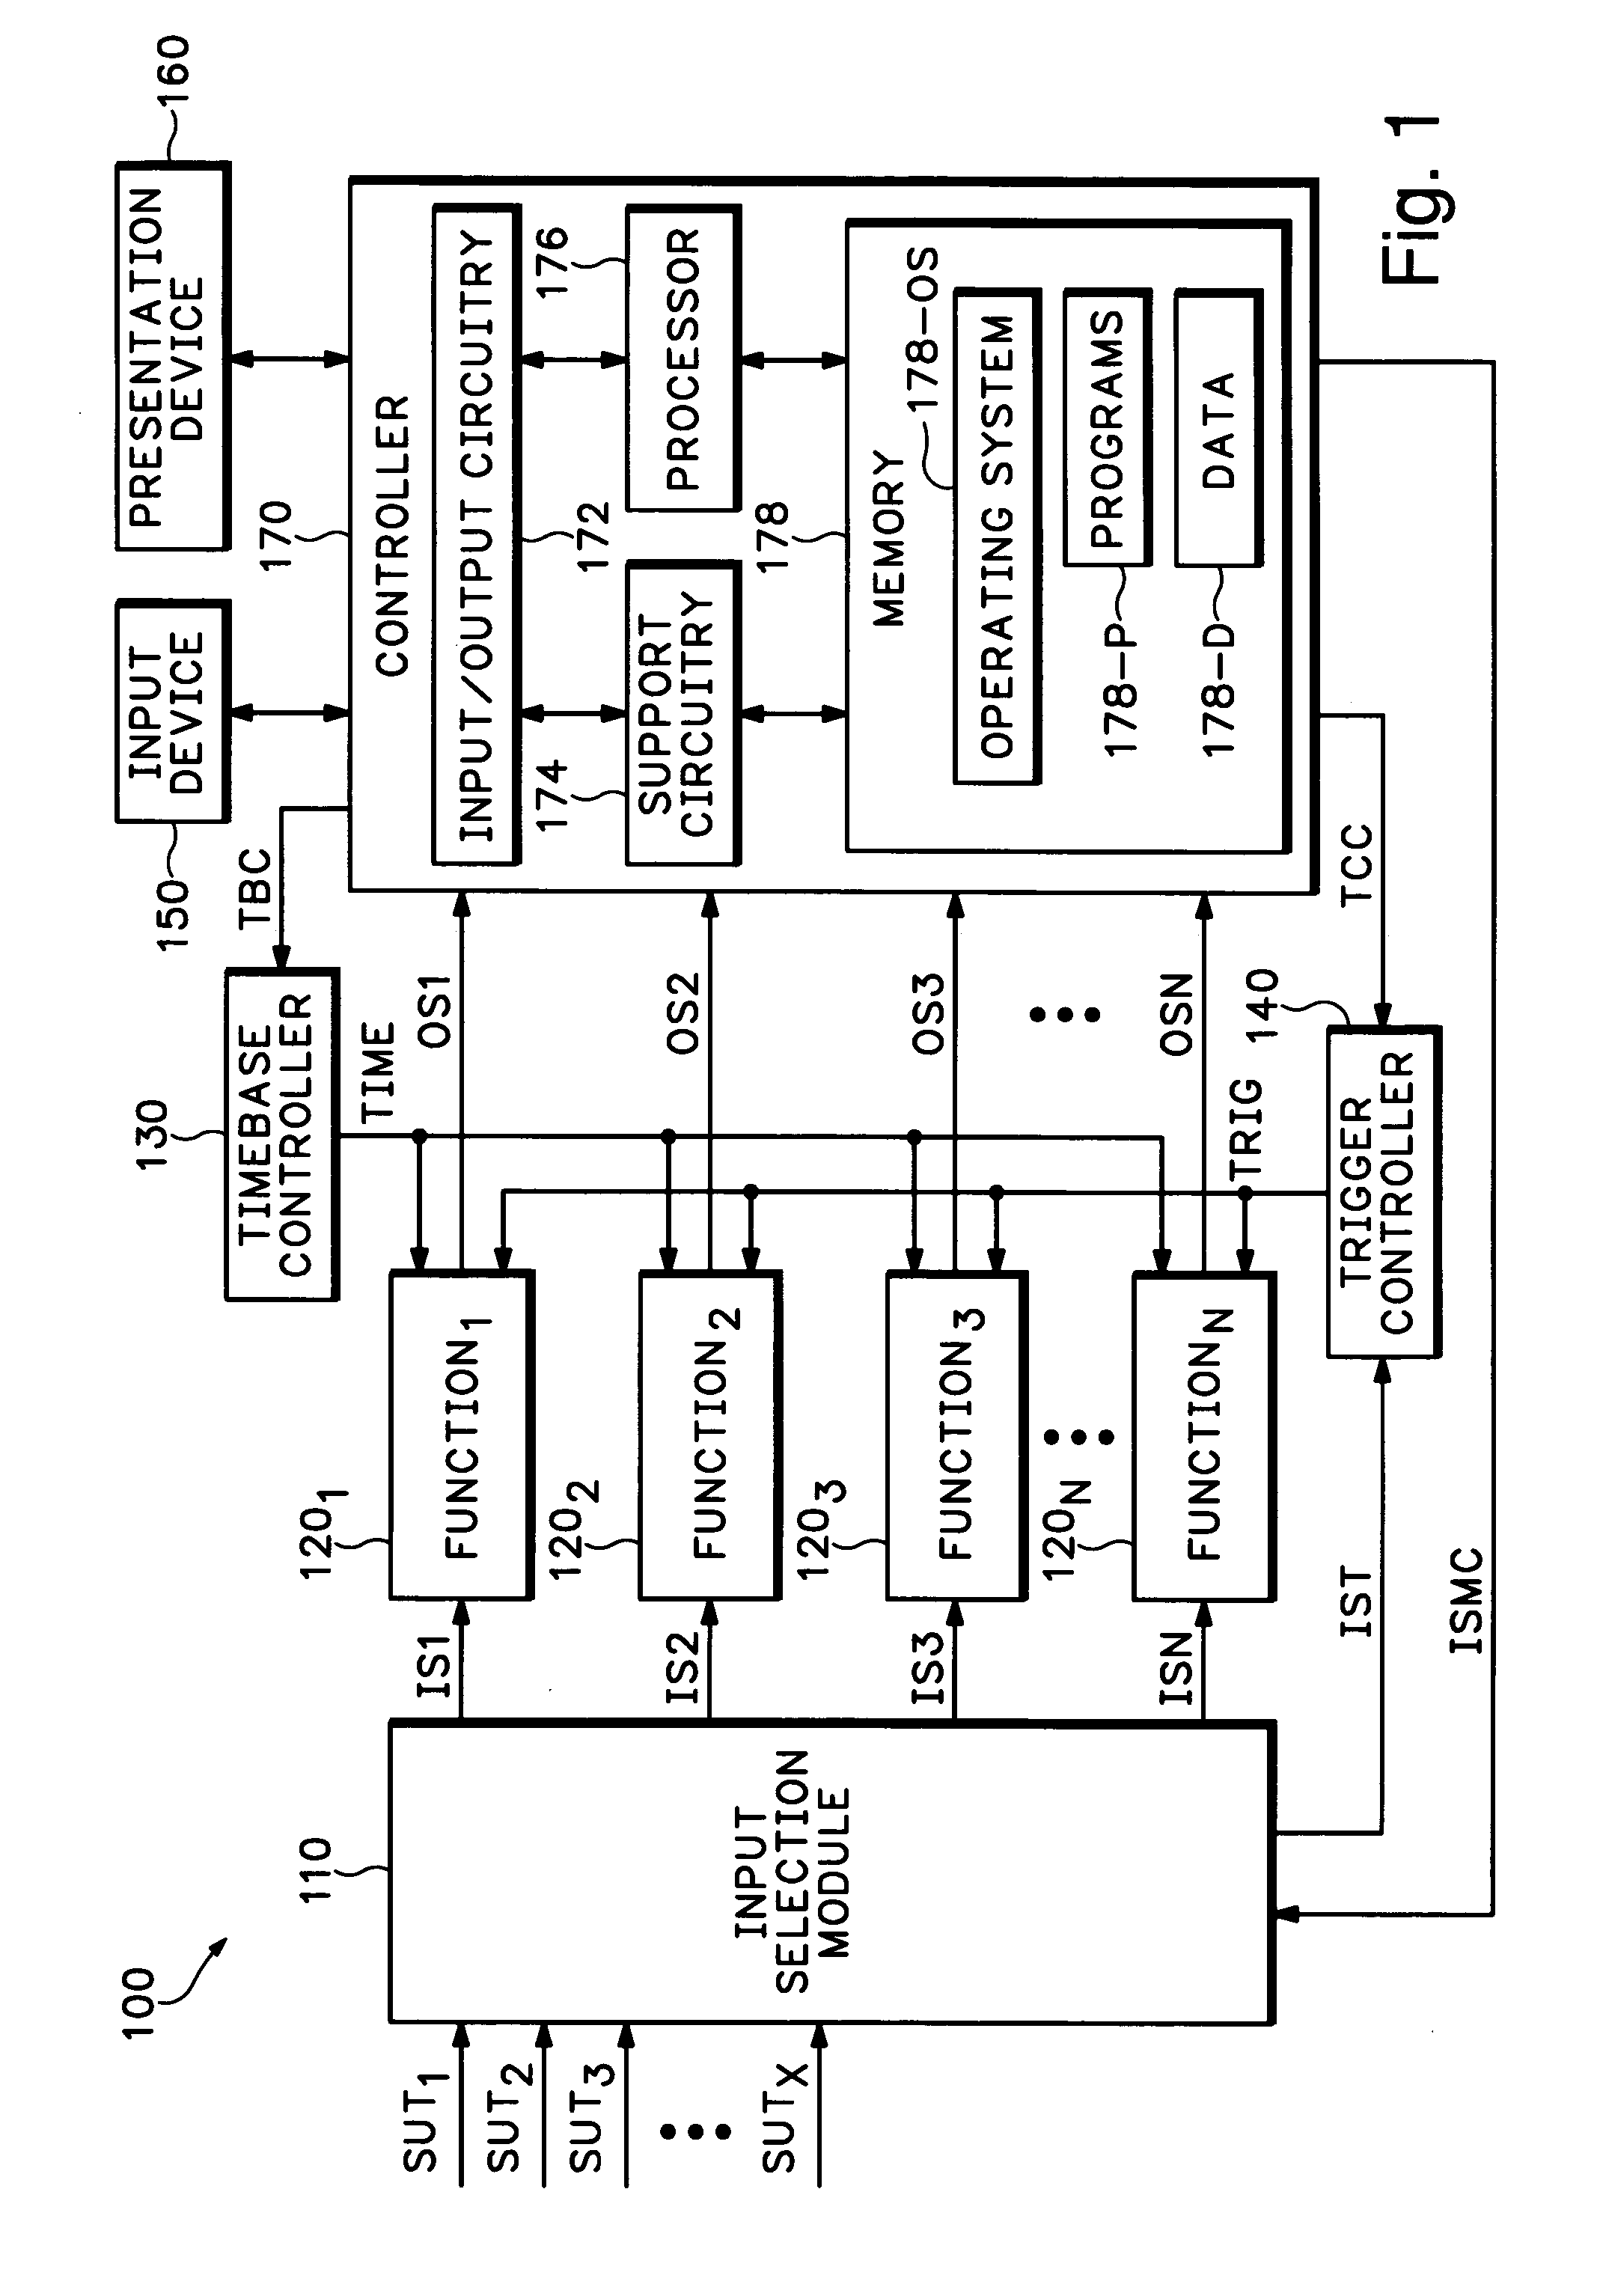
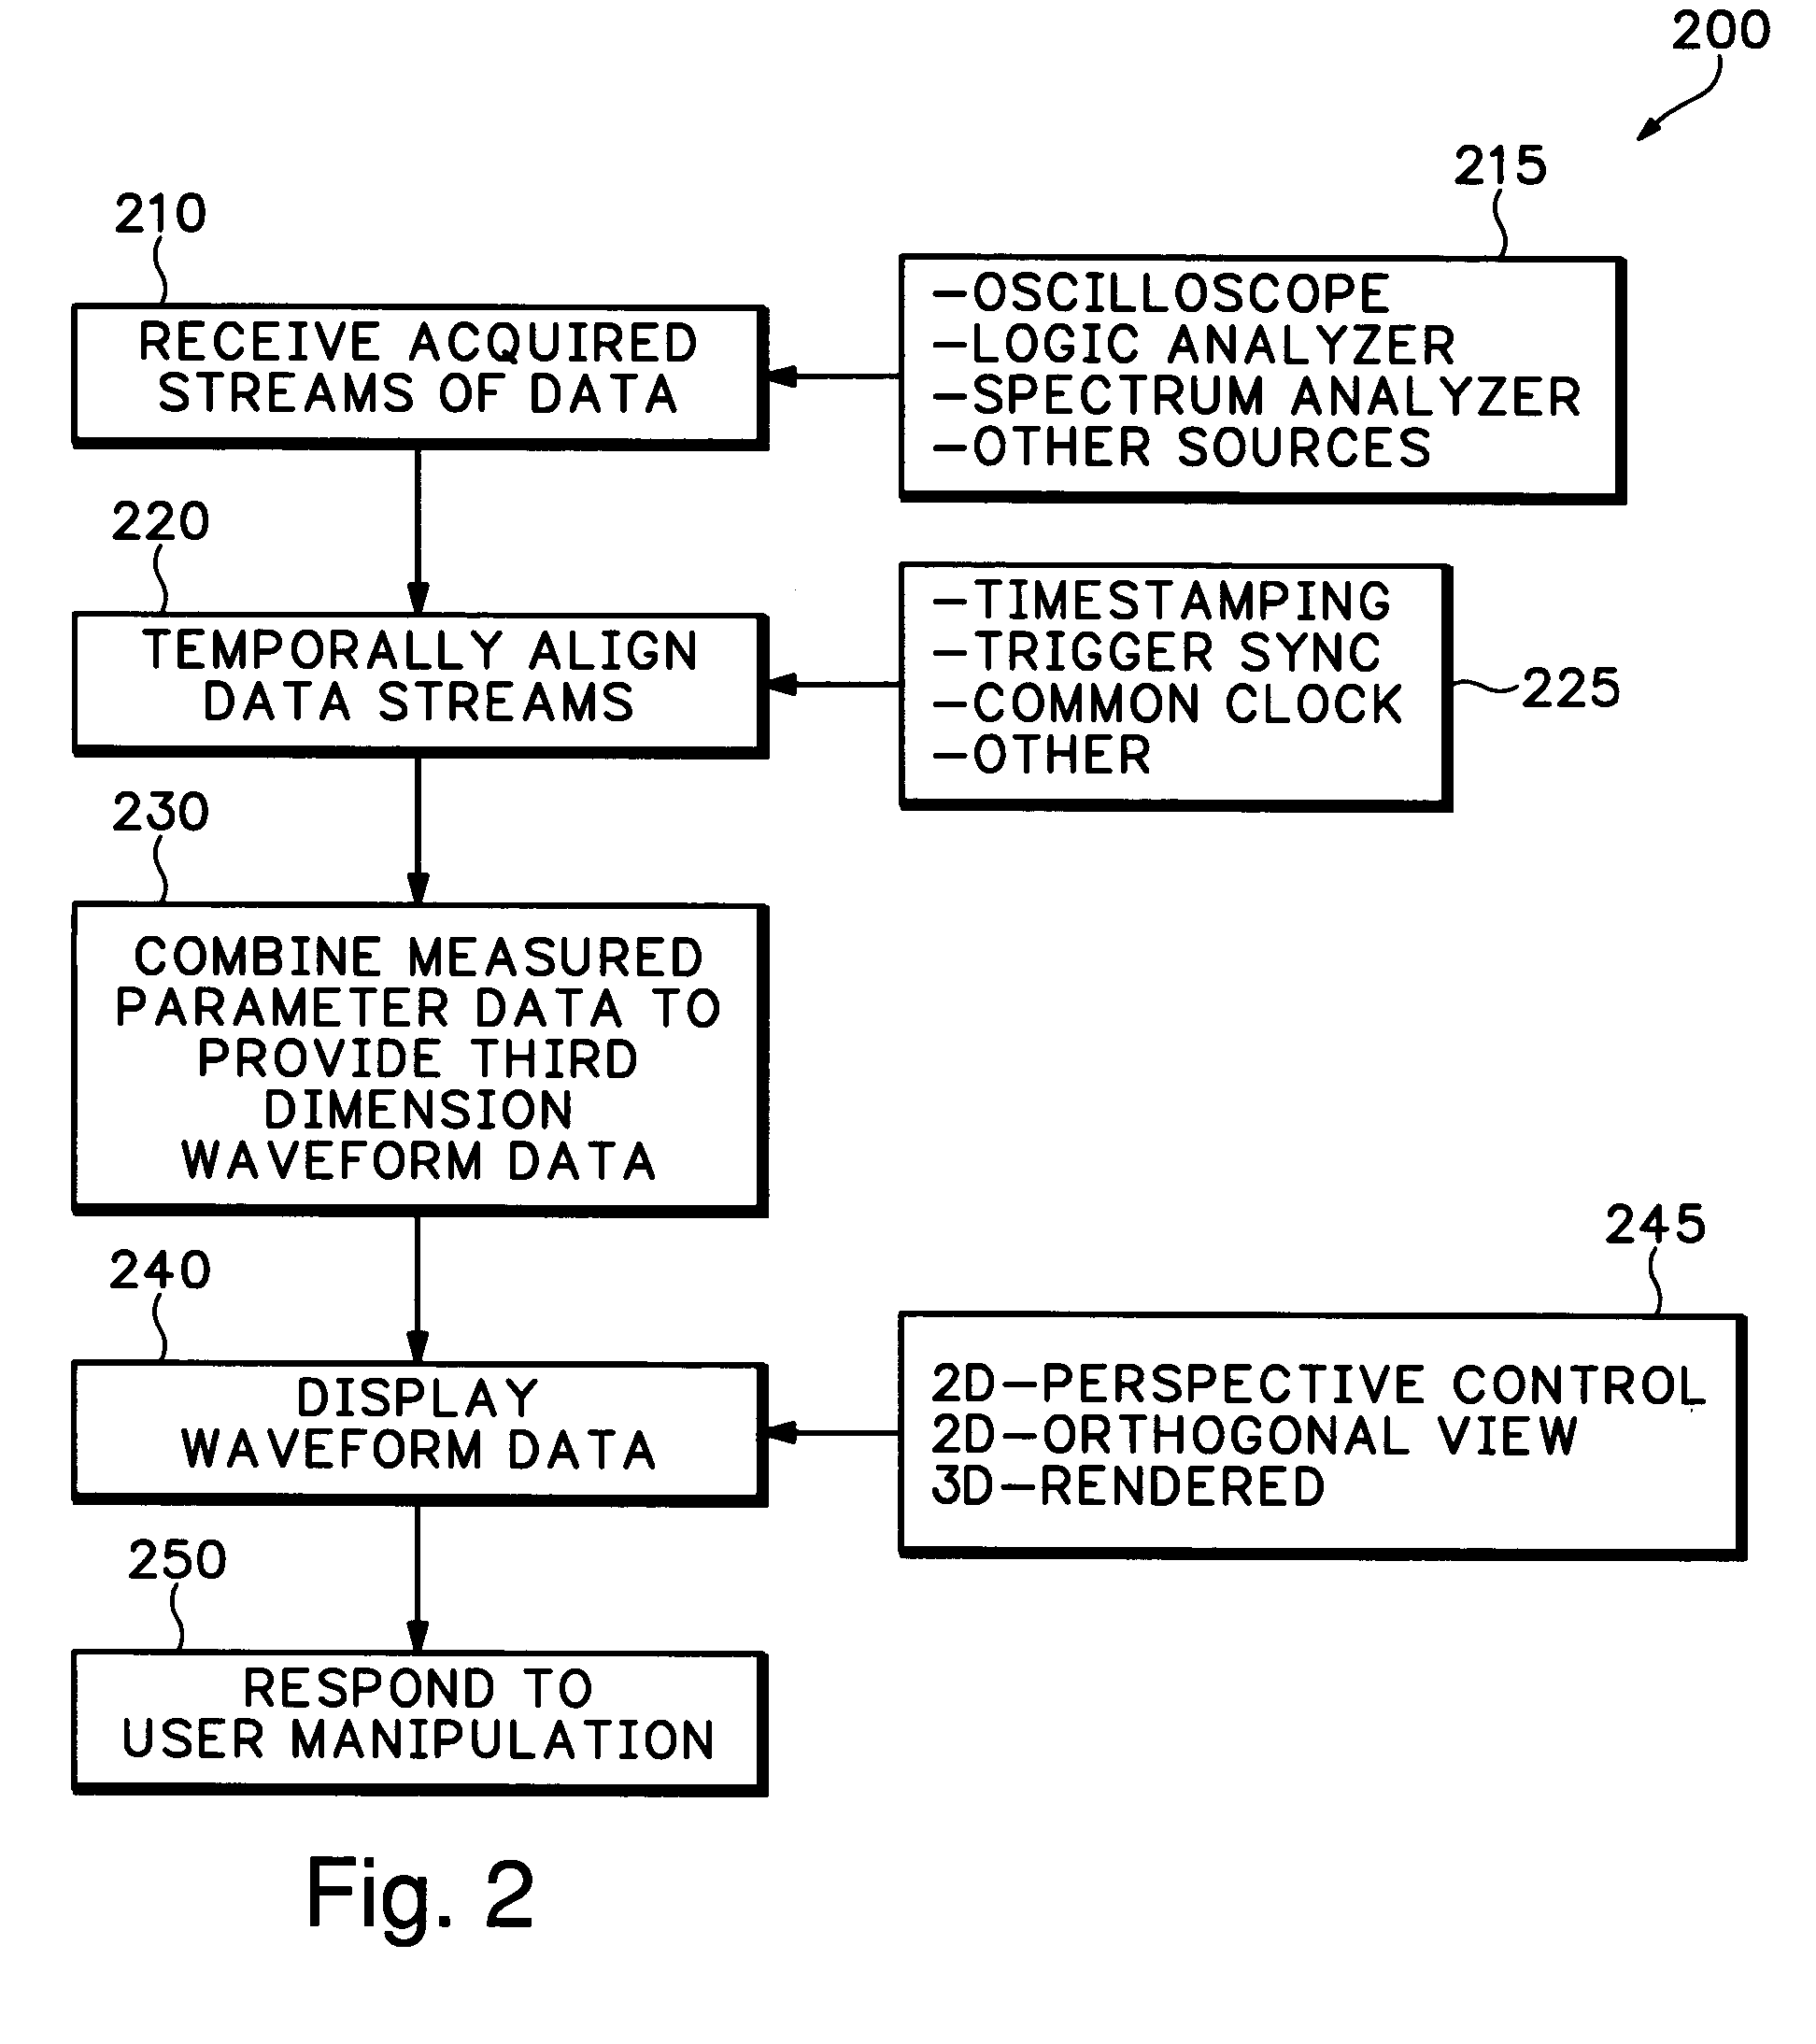
[0013]The subject invention will be primarily described within the context of a signal acquisition system having a plurality of function modules where each function module performs a respective different signal processing and / or analysis function. However, it will be appreciated by those skilled in the art that the various function modules may be used to implement any combination of functions, including multiple instances of the same function. It will further be appreciated by those skilled in the art that the invention may be advantageously employed in any environment where multiple signal acquisition and / or analysis devices process signals under test, wherein a common correlated display of information derived from such processing is useful. Thus, even though FIG. 1 shows a system incorporating a plurality of function modules, the various function modules may be dispersed or otherwise provided by additional test and measurement instruments for acquisition of data samples by the var...
PUM
 Abstract
Description
Claims
Application Information