
Mutual fund analysis method and system

a mutual fund and analysis method technology, applied in the field of mutual fund selection and tracking, can solve the problems of insufficient funds, finite amount of risk, and risk that one is willing to take with the investment, and achieve the effect of high emotional charg

Inactive Publication Date: 2007-11-20
GGS SYST
View PDF20 Cites 19 Cited by
  • Summary
  • Abstract
  • Description
  • Claims
  • Application Information

AI Technical Summary

Benefits of technology

[0010](1) the investment should have few, if any, years of negative performance (because of investor likelihood of stopping all investment) while maximizing cumulative growth; and
[0013]When selecting mutual funds, most analysts recommend investing in no more than five (5) funds, as more funds will not reduce risk because of the broad number of stocks that each fund owns. Two or three funds, each with different investment objectives / strategies should be sufficient. For example, a balance of an aggressive growth stock fund and a balanced equity fund will lower overall risk of a down market (where growth stocks suffer the most and equity funds—those that invest in stable, dividend-paying stocks and bonds—suffer the least). That balance should be weighted more toward growth stocks for younger investors and more toward equity funds for retired investors—retired investors should still retain at least 15%-25% of total investment in growth stocks to guard against periods of very high inflation, when equity funds typically fall the most.

Problems solved by technology

Each investment type carries a measure of risk—ALL investments have some degree of risk to the principal amount of investment.
Even bank accounts that are insured carry a finite amount of risk—risk that the insurance fund will have sufficient funds to pay off in the event of failure of the bank.
The issue that must be addressed is the amount of risk that one is willing to take with the investment.
This is especially true when one changes the investment from a mutual fund to money market funds; being out of the market may mean missing one or more of the big up days that occur without warning.

Method used


Image

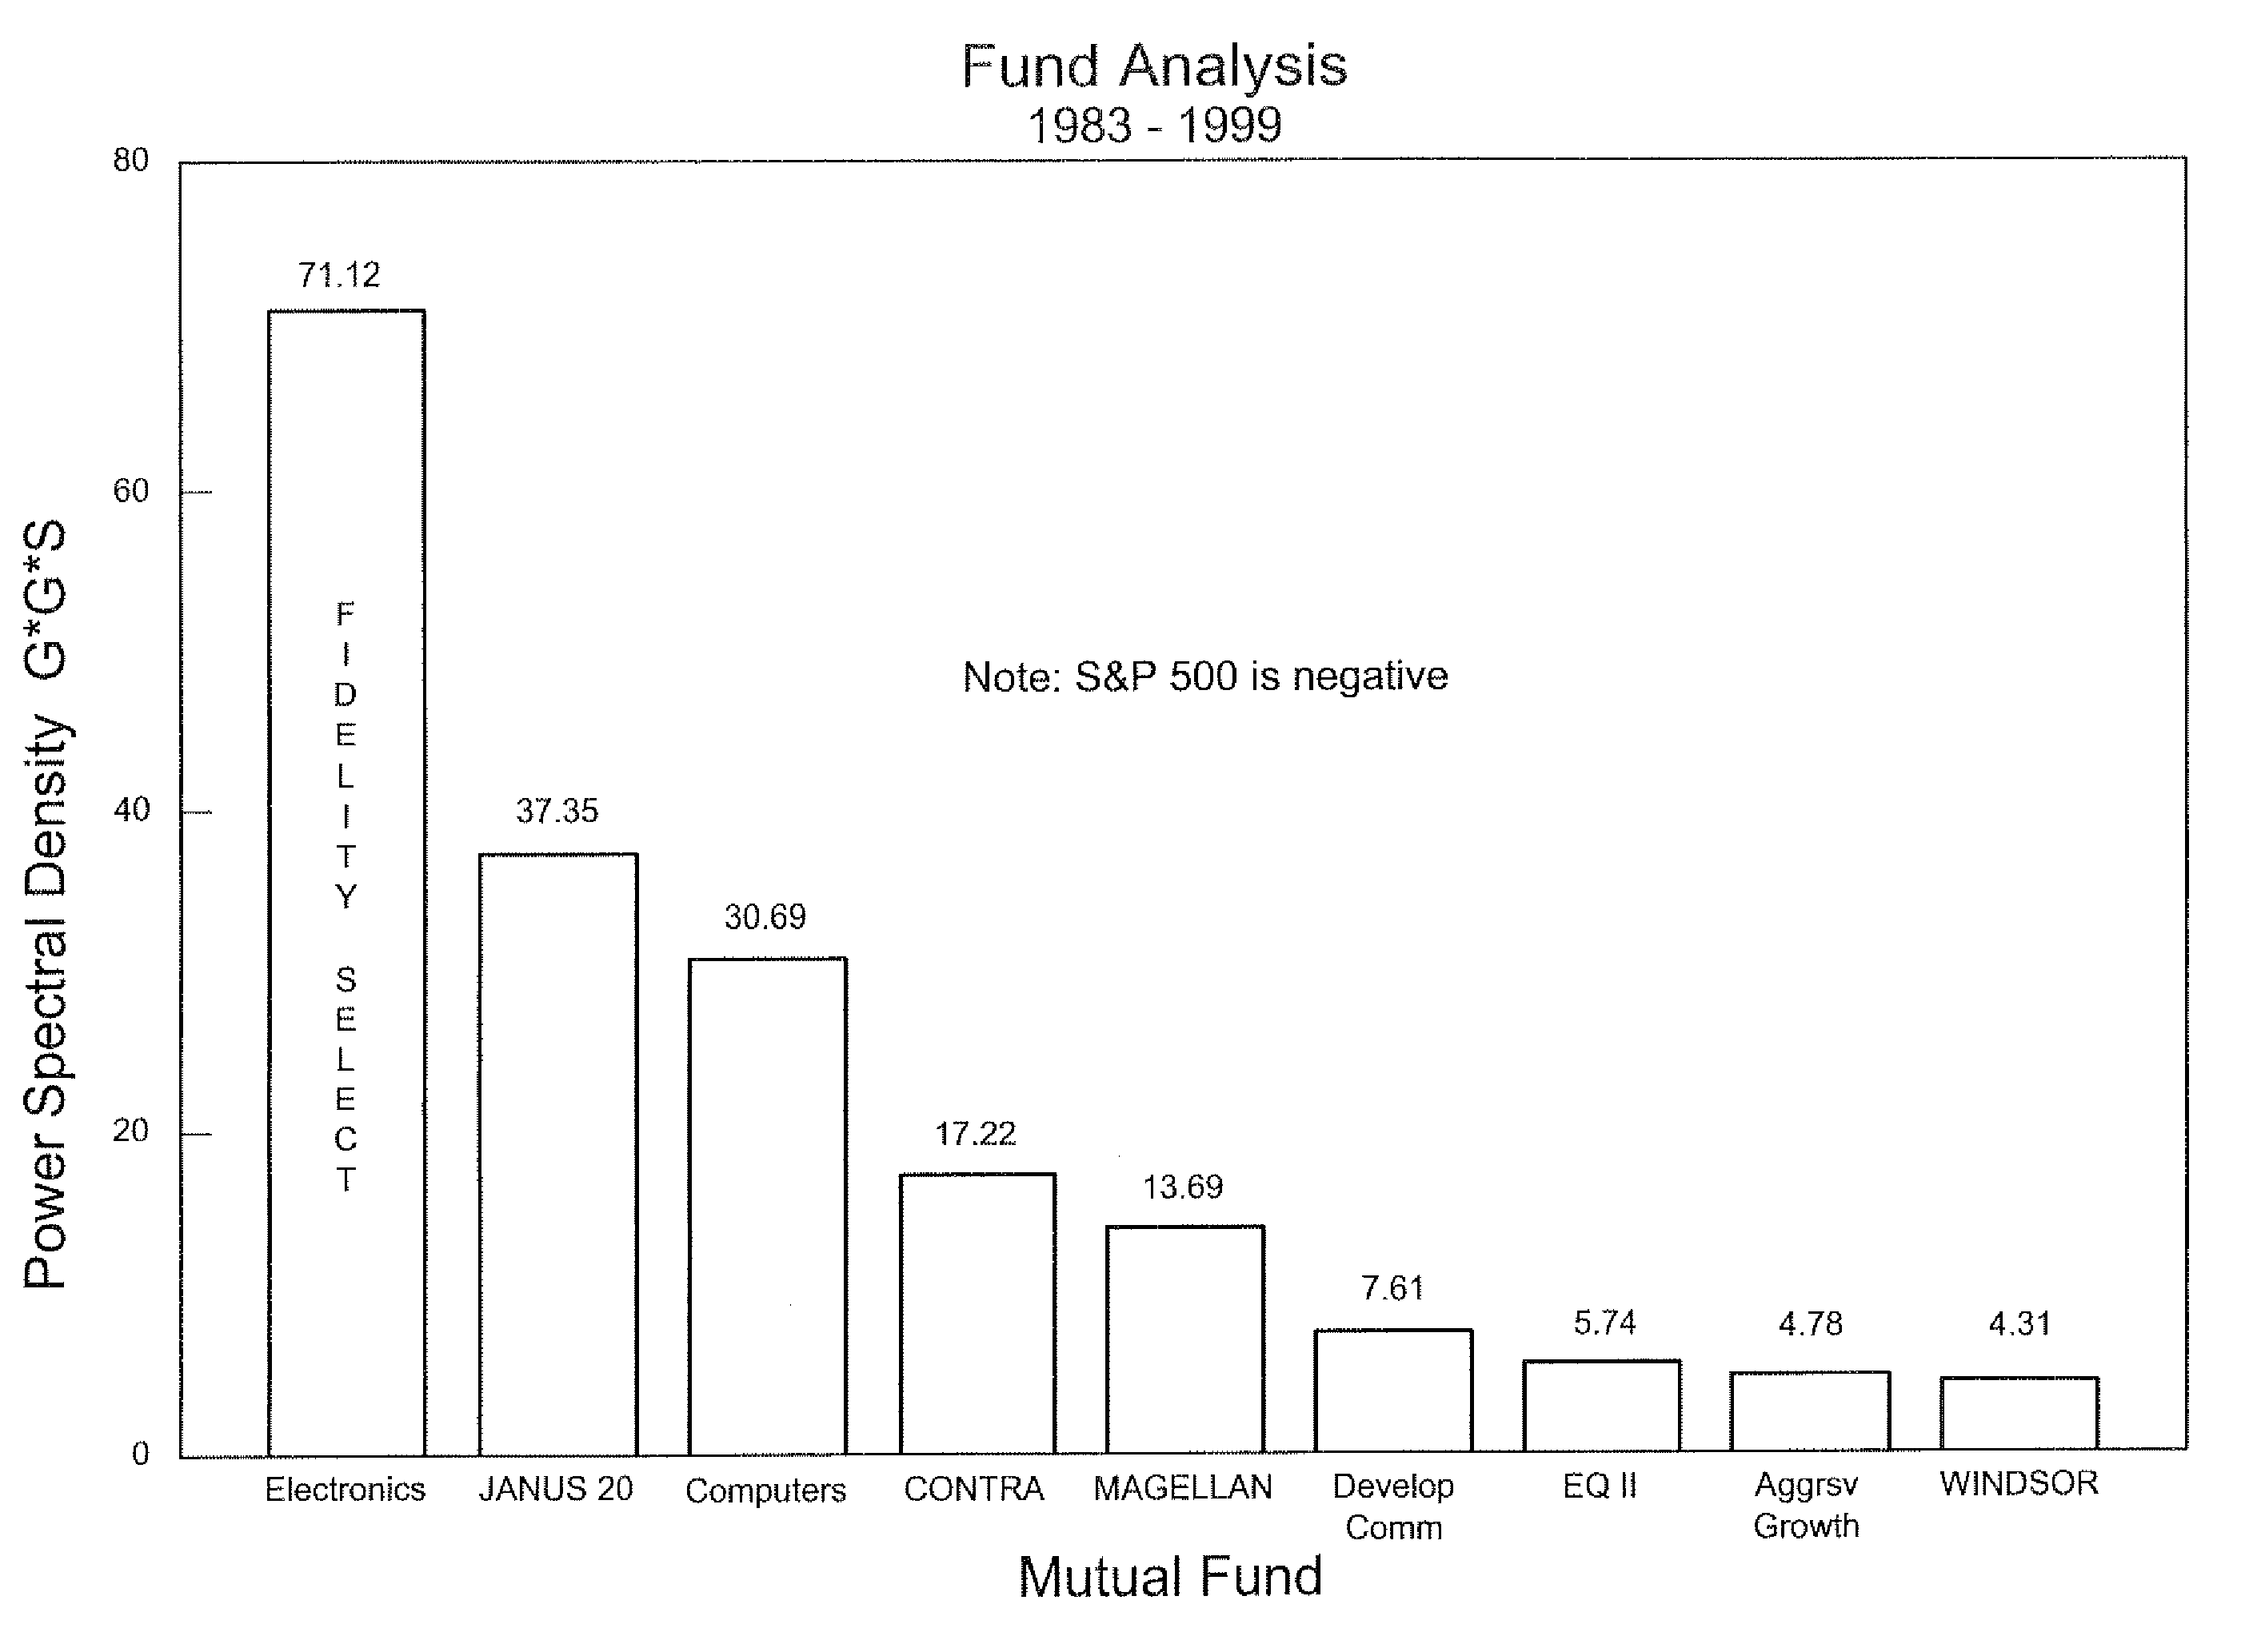
  • Mutual fund analysis method and system
  • Mutual fund analysis method and system
  • Mutual fund analysis method and system

Examples


Embodiment Construction

[0024]In the description below, as would be apparent to those of ordinary skill in the art, the described calculation and graphical representations are performed by a computer or other automated means.

[0025]In accordance with the present invention, a power spectral density analysis is applied to mutual fund historical data to compare, rank, select and track mutual funds. A power spectrum of density is created from data (such as annual growth performance of a mutual fund) and plotted over the entire fund-spectrum to determine peak occurrences. As used in communications and structures, the spectrum of frequency is created to locate via peaks in the power spectral density plot) resonant frequencies. As applied to mutual fund data, key attributes of mutual funds such as cumulative growth and stability over the spectrum of possible mutual funds are used to locate the best performing fund(s).

[0026]The term “power” in power spectral density (PSD) implies the square of the principal factor,...


PUM


Abstract

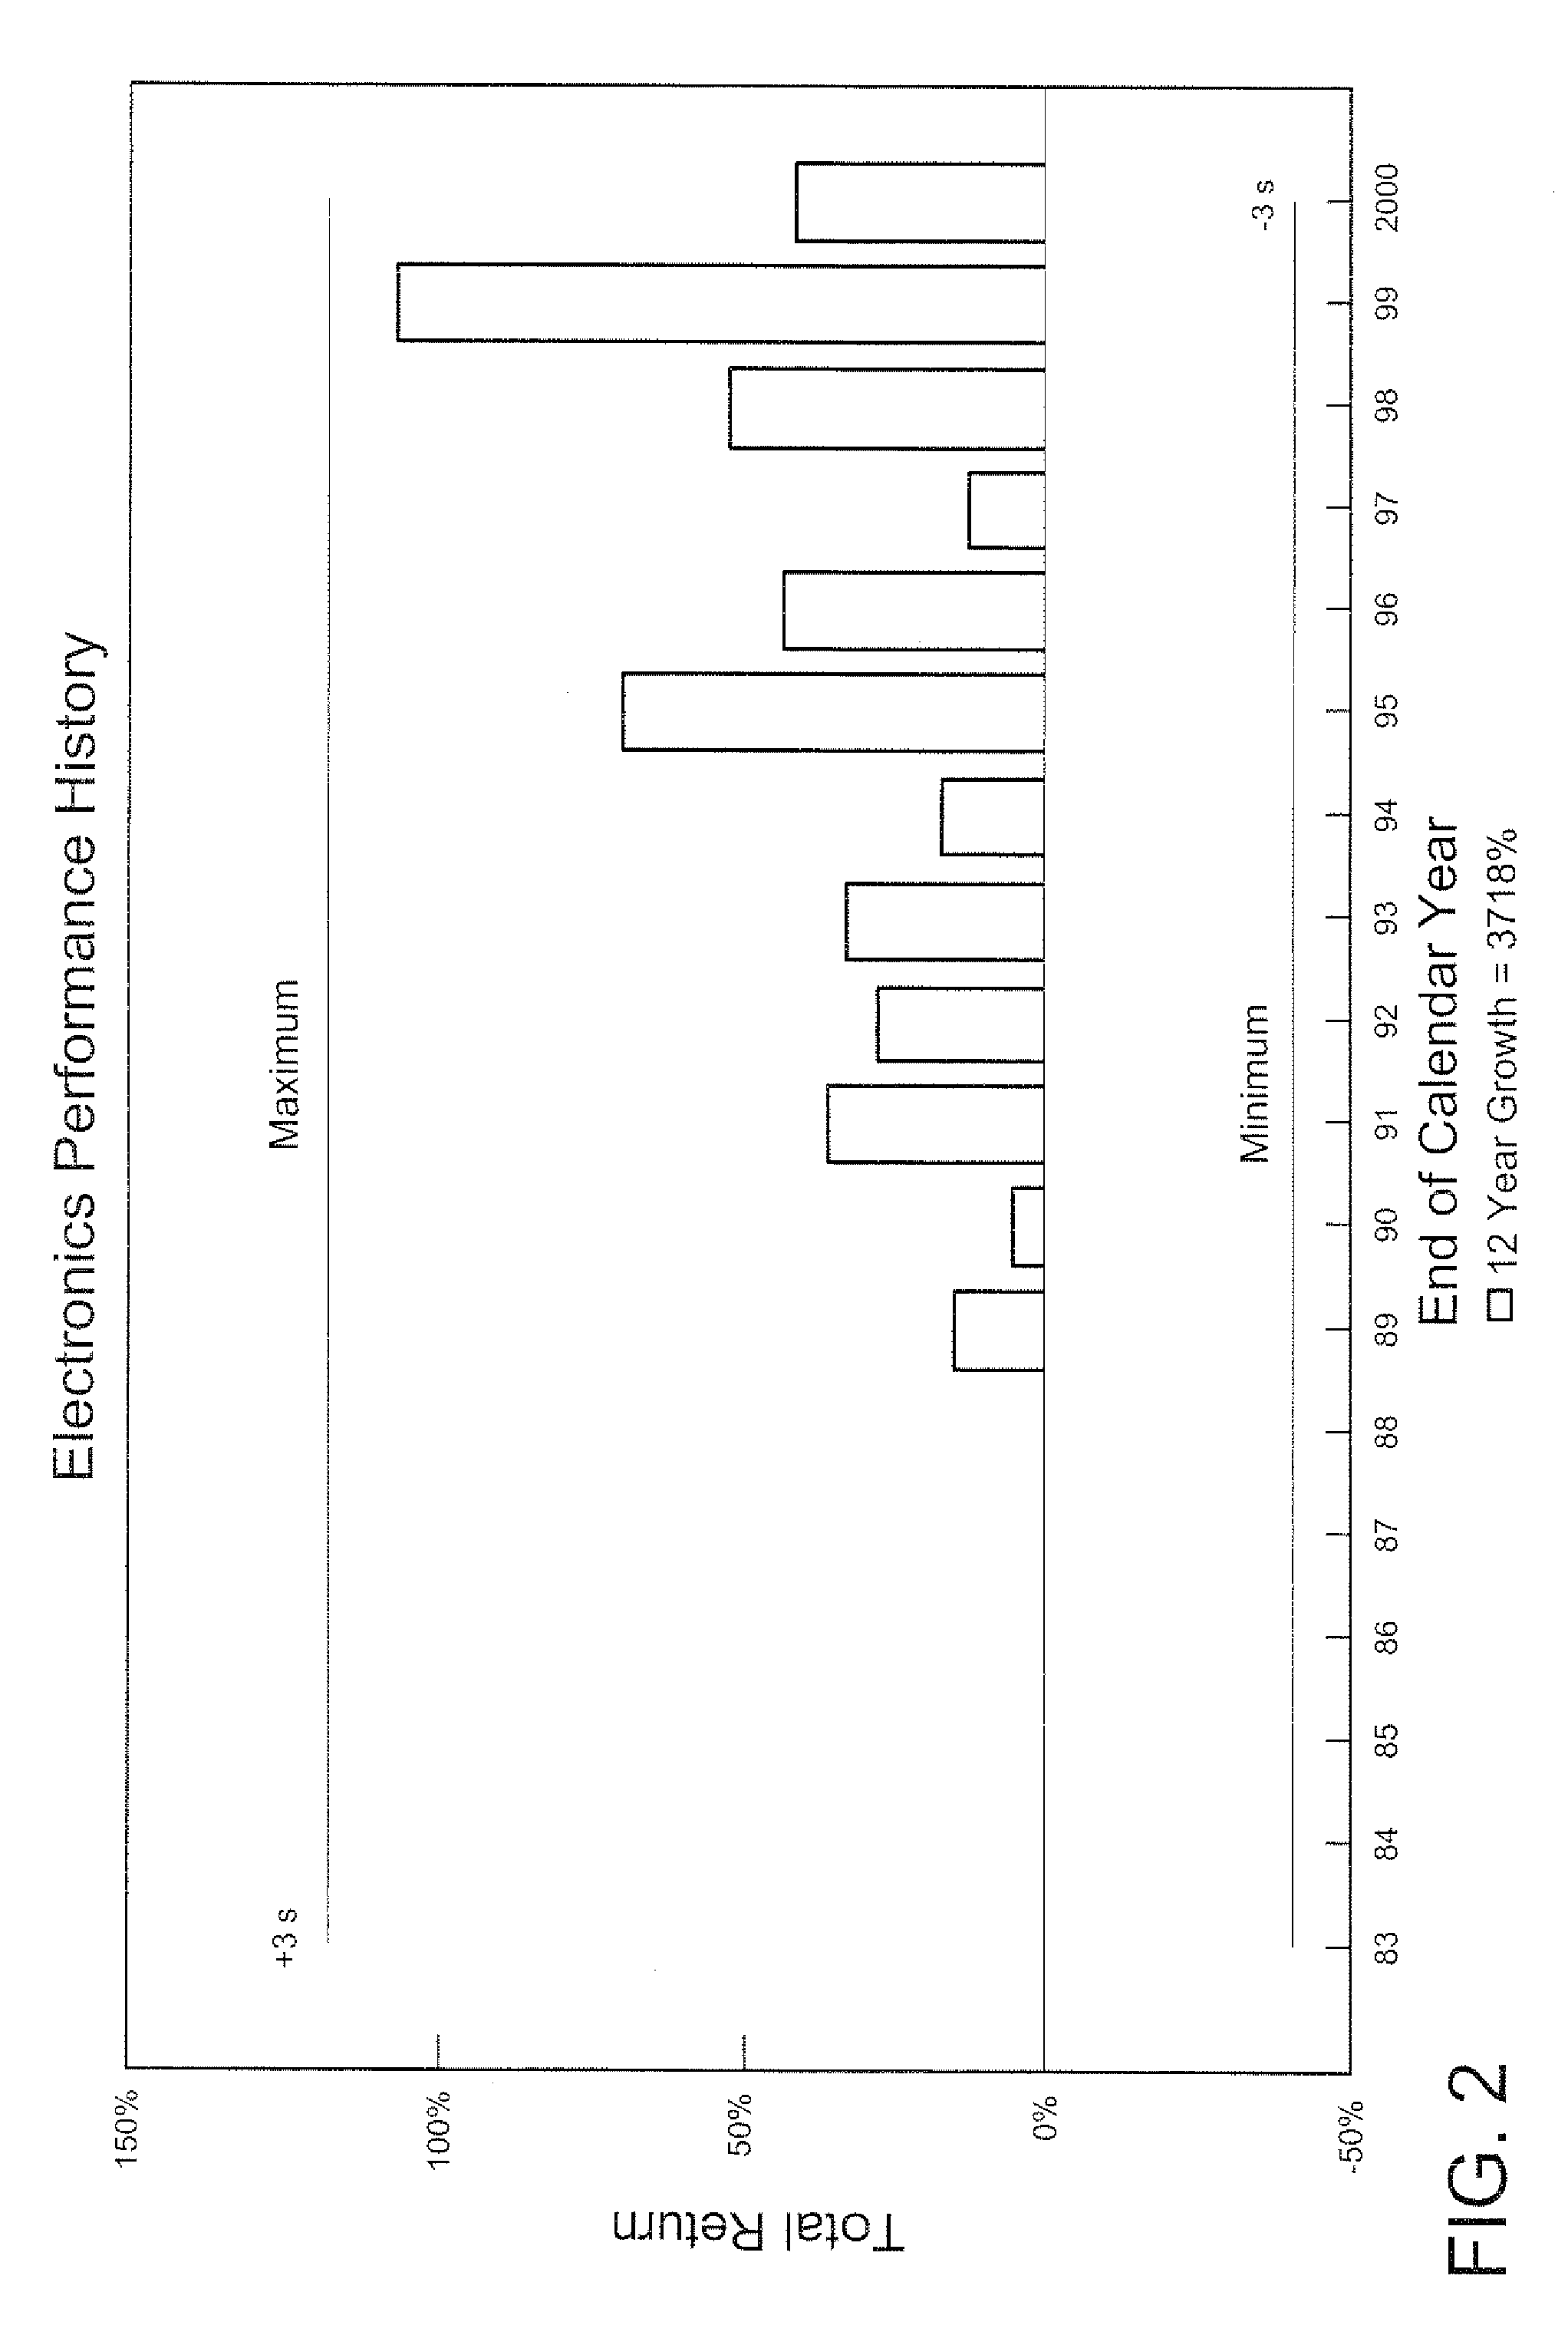
A method and system for comparing, ranking, selecting and tracking mutual funds provides a statistical analysis based on past history to facilitate the investment process. The comparing analysis incorporates a determination of power spectral density of each respective fund using a principal factor such as cumulative growth and stability. For tracking investments, upper and lower control limits are defined according to standard deviations of average total return over predetermined periods of time to improve chances of the investor achieving a profit as well as a near optimum performance. The power spectral density analysis provides a clear indication of comparative mutual fund performance.

Description

CROSS-REFERENCES TO RELATED APPLICATIONS[0001]This application is a continuation-in-part (CIP) of U.S. patent application Ser. No. 09 / 675,658, filed Sep. 29, 2000, now abandoned; which claims the benefit of U.S. Provisional Patent Application Ser. No. 60 / 156,886, filed Sep. 30, 1999; the entire contents of which are hereby incorporated by reference in this application.STATEMENT REGARDING FEDERALLY SPONSORED RESEARCH OR DEVELOPMENT[0002](NOT APPLICABLE)BACKGROUND OF THE INVENTION[0003]The present invention relates to selecting and tracking mutual funds and, more particularly, to a method and system for comparing mutual funds according to a power spectral density that incorporates fund growth and stability.[0004]There are three basic factors that affect the performance of a mutual fund, including fund management, market conditions and fund investment strategy. The fund manager makes the daily decisions not only on what stocks / bonds to buy, but when to buy them. Thus, market timing is ...

Claims


Application Information

Patent Timeline
Patent Type & Authority Patents(United States)
IPC IPC(8): G06Q40/00
CPCG06Q40/00G06Q40/06G06Q40/04
Inventor WEINBERGER, ALAN L.
Owner GGS SYST
Learn More