
Graphical indicator

a graphical indicator and indicator technology, applied in the field of graphical indicators, can solve the problems of difficult printing of graphical indicators, errors in the analysis of images captured by optical devices, and small space between adjacent dots, so as to reduce the density of dots, improve the visual effect, and be flexible.

Active Publication Date: 2009-06-23
SONIX TECH
View PDF21 Cites 17 Cited by
  • Summary
  • Abstract
  • Description
  • Claims
  • Application Information

AI Technical Summary

Benefits of technology

The invention provides a new design for a graphical indicator that solves problems with conventional designs. The indicator has a content part and a header part. The content part is divided into multiple sections, each containing a small number of dots. This allows for better visual effect and reduces confusion with the primary text or pattern on the surface of an object. The header part is specifically arranged to recognize the indicator. The new design also allows for more flexibility in dot arrangement and reduces the dot distribution density, making it easier to print and analyze.

Problems solved by technology

Further, in the conventional design, when the graphical indicators are spread on a confined surface area, a great amount of information to be carried may cause an excess distribution density of dots to result in a considerable small space between two adjacent dots.
This often causes the difficulty of printing the graphical indicators and errors in the analysis of the image captured by an optical device.

Method used


Image

  • Graphical indicator
  • Graphical indicator
  • Graphical indicator

Examples


Embodiment Construction

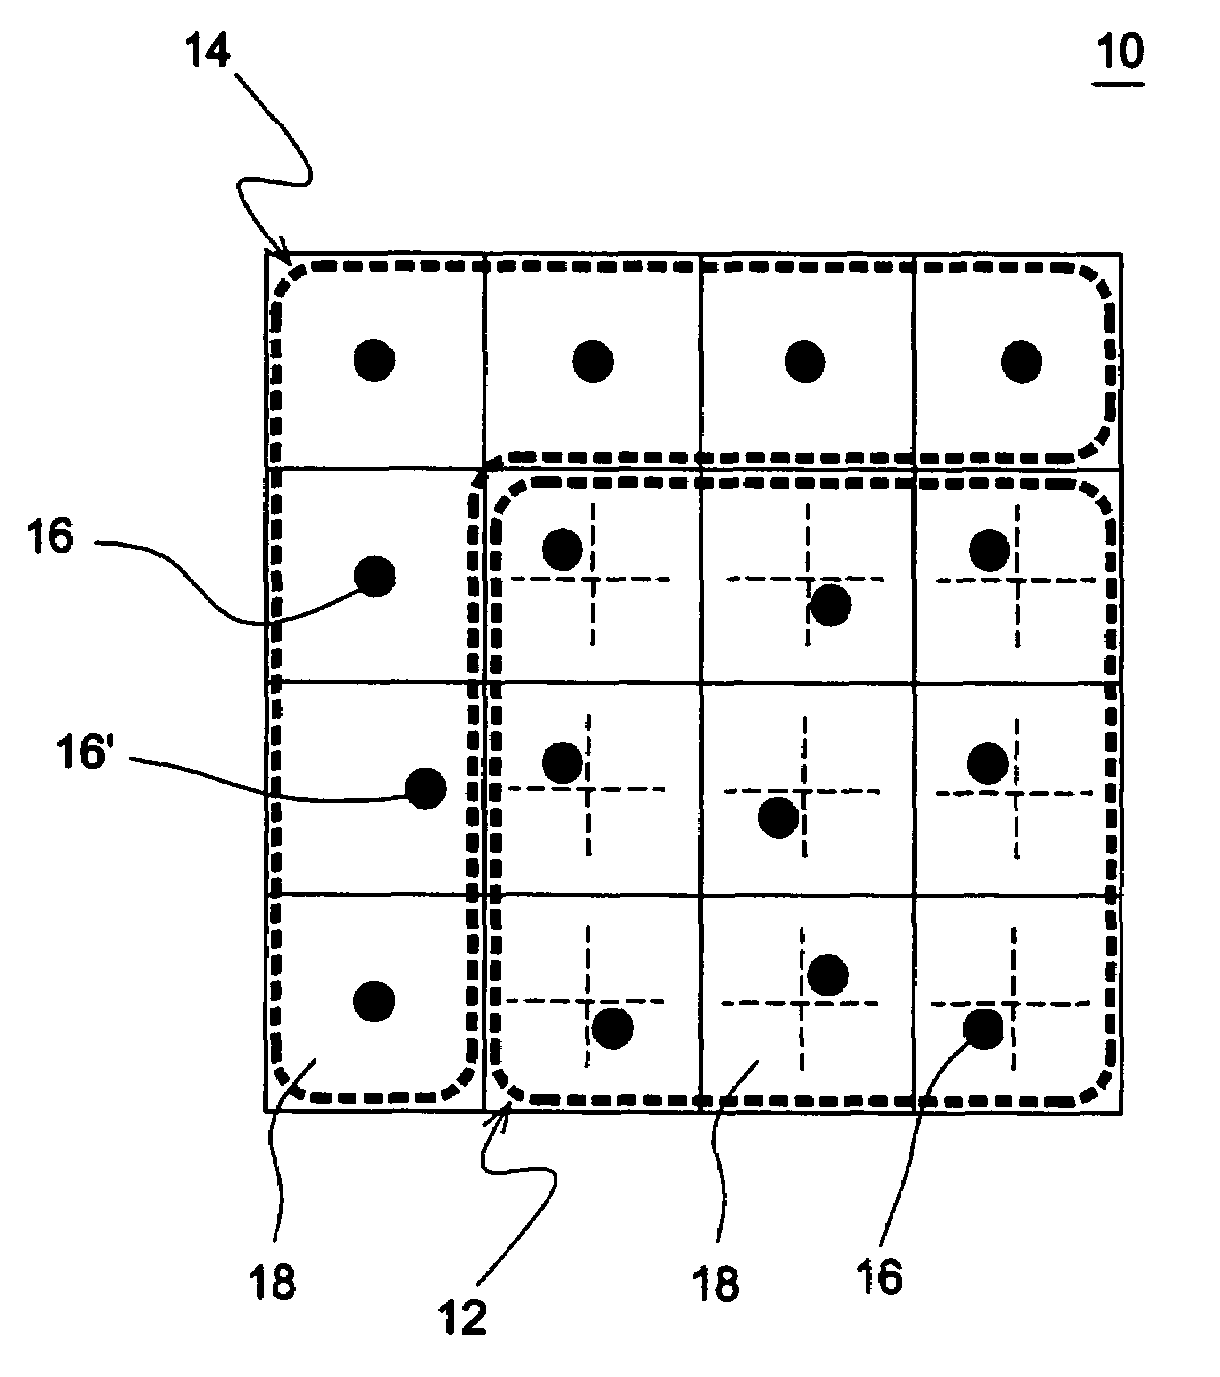
[0028]FIG. 4 shows a schematic diagram illustrating an arrangement of multiple graphical indicators 10 according to an embodiment of the invention. FIG. 5 shows an enlarged view of a graphical indicator 10 for clearly illustrating the design of the invention. Referring to FIG. 5, each graphical indicator 10 includes a content part 12 and a header part 14. In this embodiment, each content part 12 is spread with nine micro-units, namely nine dots 16, and is divided into nine state zones 18 arranged in a 3×3 two-dimensional array, so each state zone 18 is spread with one dot 16. According to this embodiment, when a dot 16 is to be placed in one state zone 18, it is placed to deviate from the center of one state zone 18 and toward its upper right, upper left, lower right, or lower left corner. In other words, as shown in FIG. 6, in case each state zone is equally divided into four hypothetical sections, a dot 16 placed in any of the four hypothetical sections may form four candidate sta...


PUM


Abstract

A graphical indicator provided on the surface of an object to represent index information includes a content part and a header part. The content part is spread with a plurality of micro-units and divided into a plurality of state zones. Each state zone is spread with one micro-unit and equally divided into multiple hypothetical sections. The micro-unit is placed in any of the hypothetical sections to form different candidate states. The header part is spread with a plurality of micro-units that are specifically arranged to provide header information used to recognize the graphical indicator.

Description

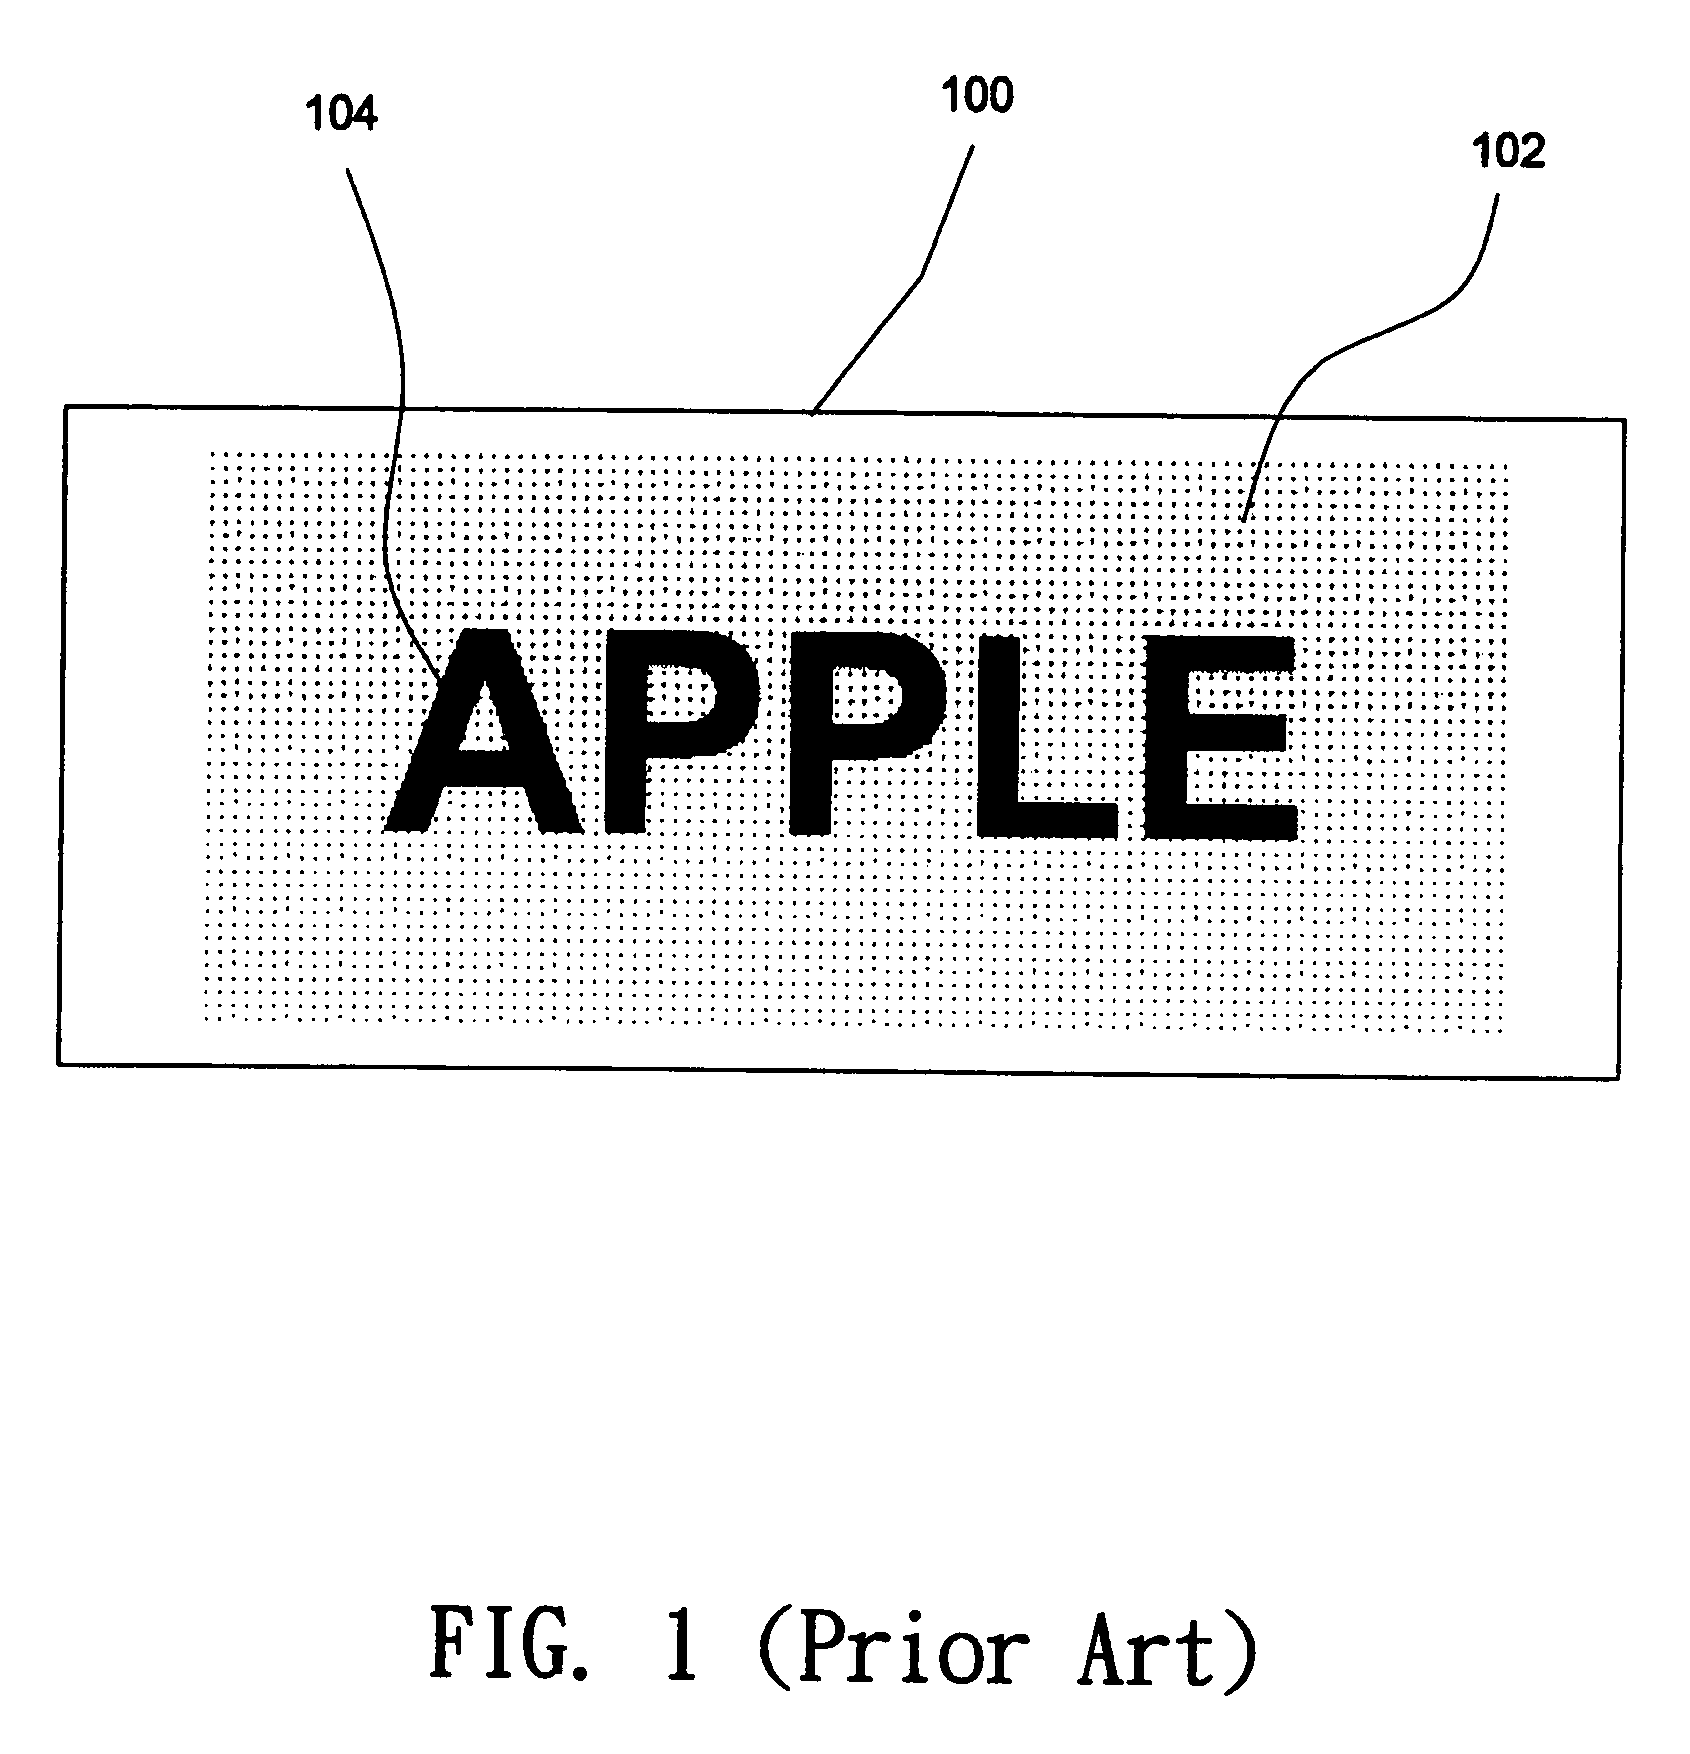
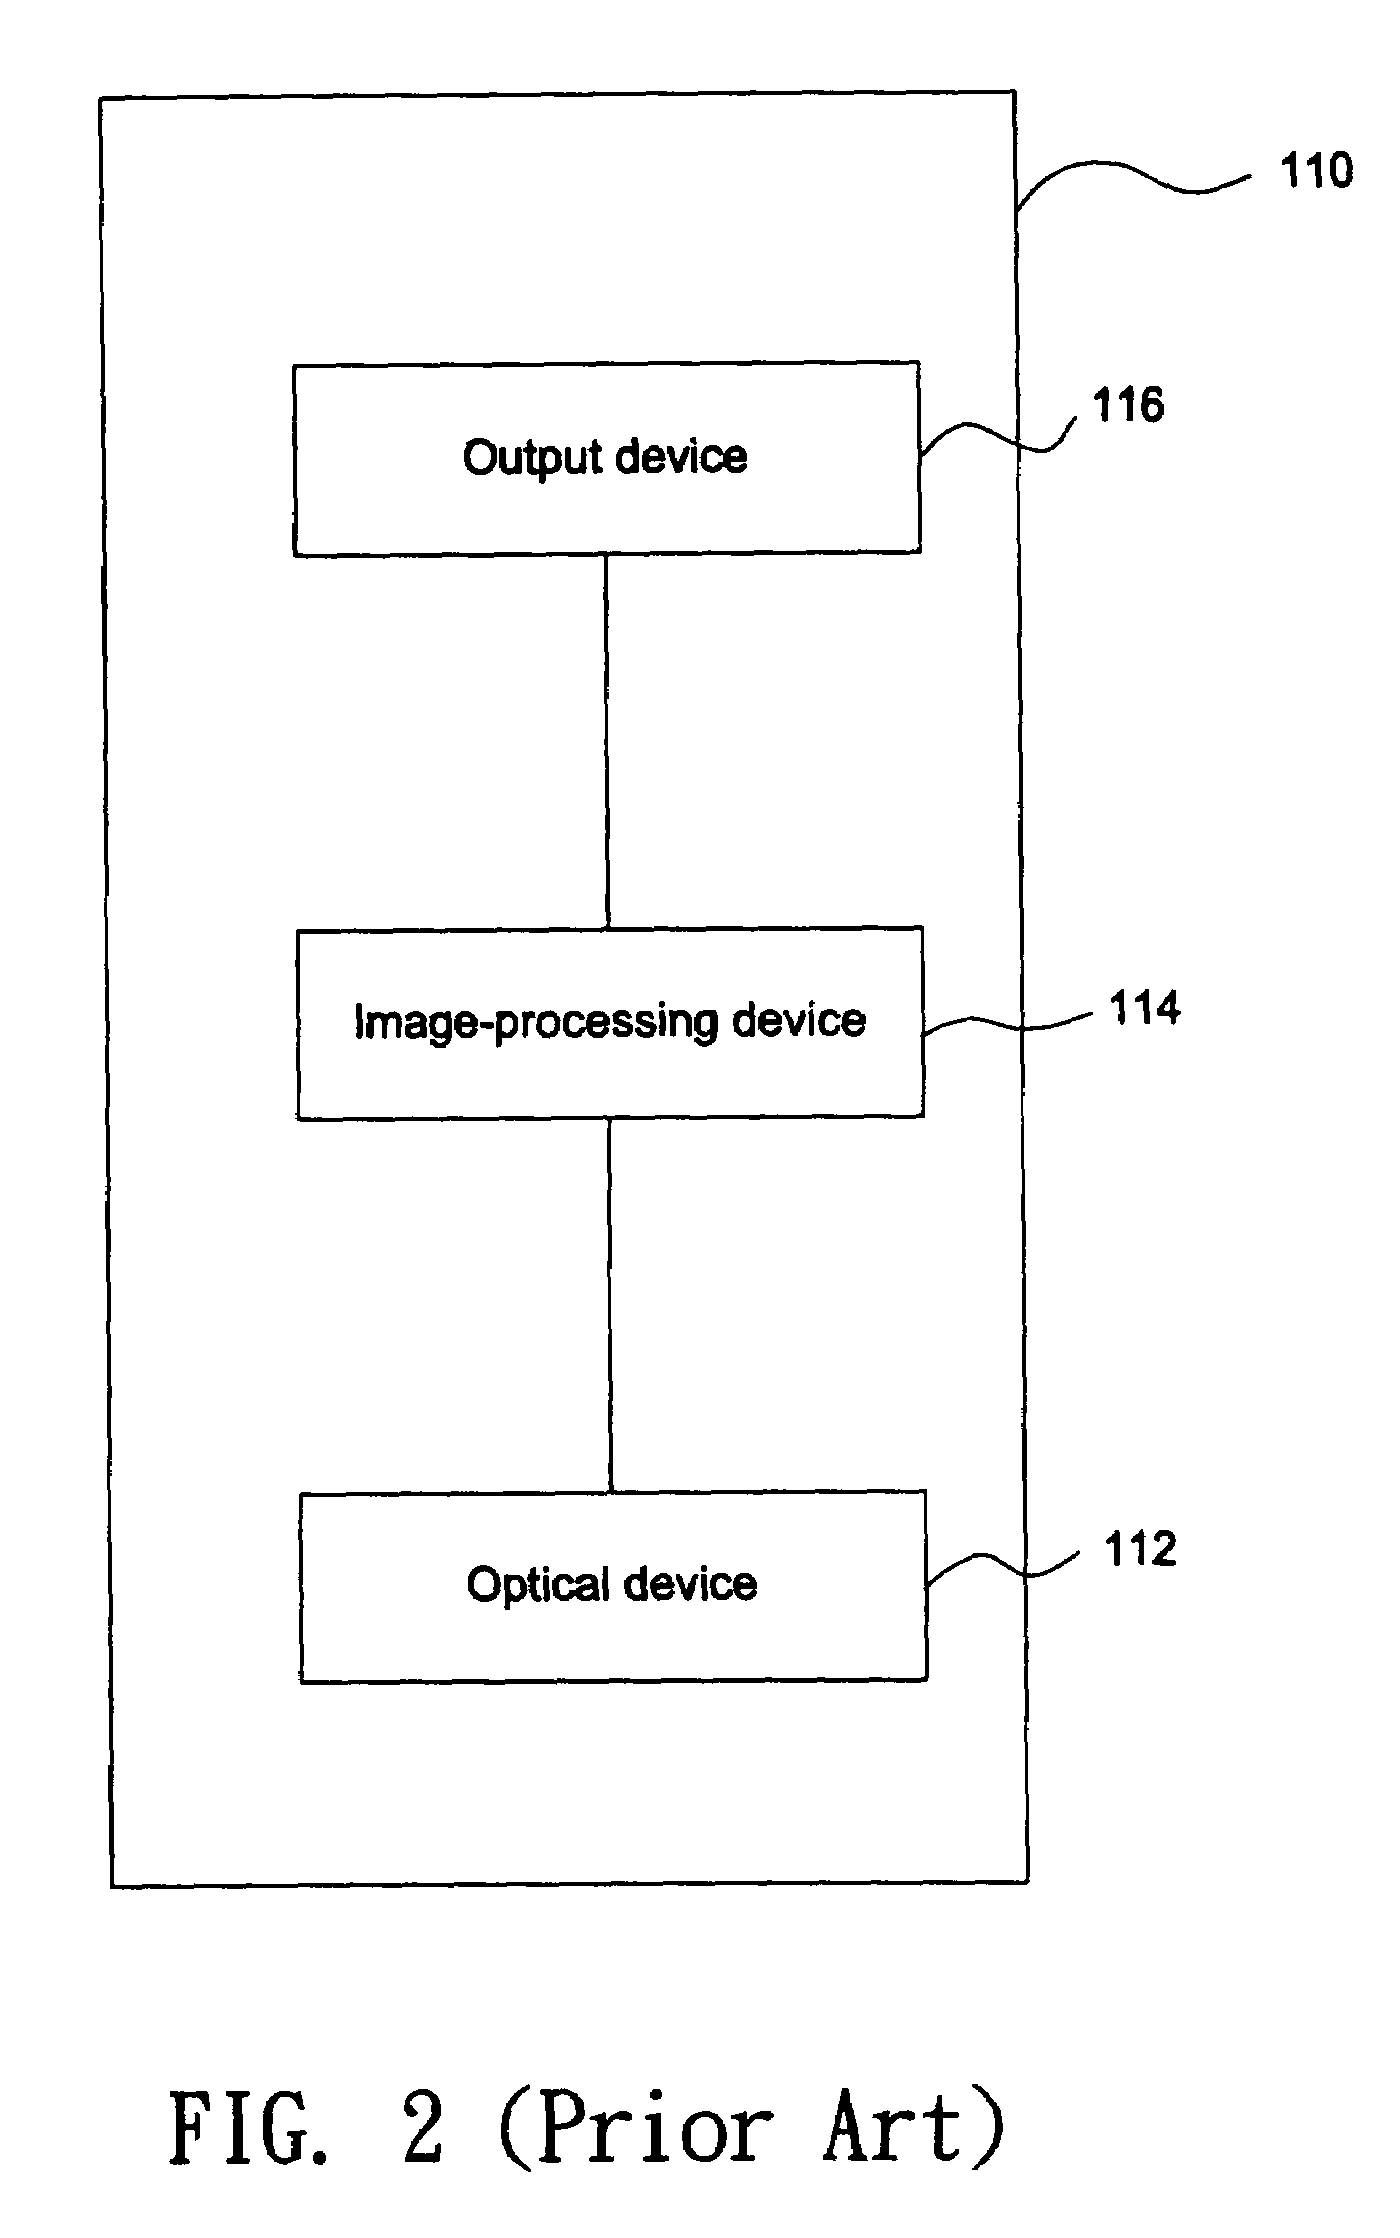
BACKGROUND OF THE INVENTION[0001](a) Field of the Invention[0002]The invention relates to a graphical indicator that is provided on the surface of an object and carries index information recognized by pattern / image recognition process.[0003](b) Description of the Related Art[0004]FIG. 1 shows a schematic diagram illustrating a graphical indicator 102 provided on the surface 100 of an object. The graphical indicator 102 typically consists of a plurality of graphical micro-units, and the graphical indicator 102 and the primary pattern or text 104 (such as the text “APPLE” shown in FIG. 1) that carries main information coexist on the surface 100 of an object such as a paper sheet. Since the graphical micro-units are so tiny as to be visually negligible or be sensed as background materials by human eyes, they do not interfere with the recognition of the main information carried by the primary pattern or text 104.[0005]FIG. 2 shows a schematic diagram illustrating an electronic system 11...

Claims


Application Information

Patent Timeline
Patent Type & Authority Patents(United States)
IPC IPC(8): G06K21/06
CPCG09F9/33G09F15/0025G06F3/147G09G2320/08
Inventor TSAI, YAO-HUNGCHEN, LI-CHING
Owner SONIX TECH
Learn More