
Technical analysis formation recognition using pivot points

a technology of formation recognition and financial analysis, applied in the field of financial analysis, can solve problems such as error-prone, manual charting is a tedious process, and manual charting is unreliabl

Active Publication Date: 2010-11-16
RECOGNIA
View PDF15 Cites 36 Cited by
  • Summary
  • Abstract
  • Description
  • Claims
  • Application Information

AI Technical Summary

Benefits of technology

[0028]Advantageously, the present invention is able to systematically determine all possible instances of a specified formation such as continuation triangle formation or reversal diamond formation. Another advantage of the present invention is that it does not require human judgment and can be implemented using computers.
[0029]A further advantage of the present invention is that the backward facing nature of pivot points allows a formation to be recognized at the earliest possible time. By contrast, a forward facing method may introduce a time delay of indeterminate duration arising from the choice of box size and starting point of the sequence of data points. Thus, it is possible that a suboptimal combination of these choices could result in requiring additional later data points when compared with the preferred use of backward facing pivot points.

Problems solved by technology

Manual charting is a tedious process in which the analyst must create or be provided with a graph of past price information.
A manual approach to charting can be unreliable because it depends on human pattern recognition ability.
It can be error prone due to guesswork, inaccurate heuristics or the absence of a systematic procedure for comparing the available data with all possible or likely formations.
In addition, if the analyst has a predilection for certain formations, the results may be biased towards those formations and may not be as accurate as an unbiased approach.
Finally, a manual approach, even with the aid of mechanical or computer assistance is inherently slow due to the human factor.
However, training neural networks to recognize patterns, or formations, in financial results is cumbersome and highly dependent on the quality of data used to train the neural network.
In conventional point and figure charting, the use of OHLC data can introduce ambiguity into the charting process, as a large price differentials between high and low in a single day can occur, potentially resulting in a reversal in both directions without it being clear whether the high or low occurred first.
However, point and figure charting is highly dependent on the box size chosen, and relevant formations can be missed if the box size is not appropriate.
Products available for automating point and figure charting suffer similar disadvantages.

Method used


Image

  • Technical analysis formation recognition using pivot points
  • Technical analysis formation recognition using pivot points
  • Technical analysis formation recognition using pivot points

Examples


Embodiment Construction

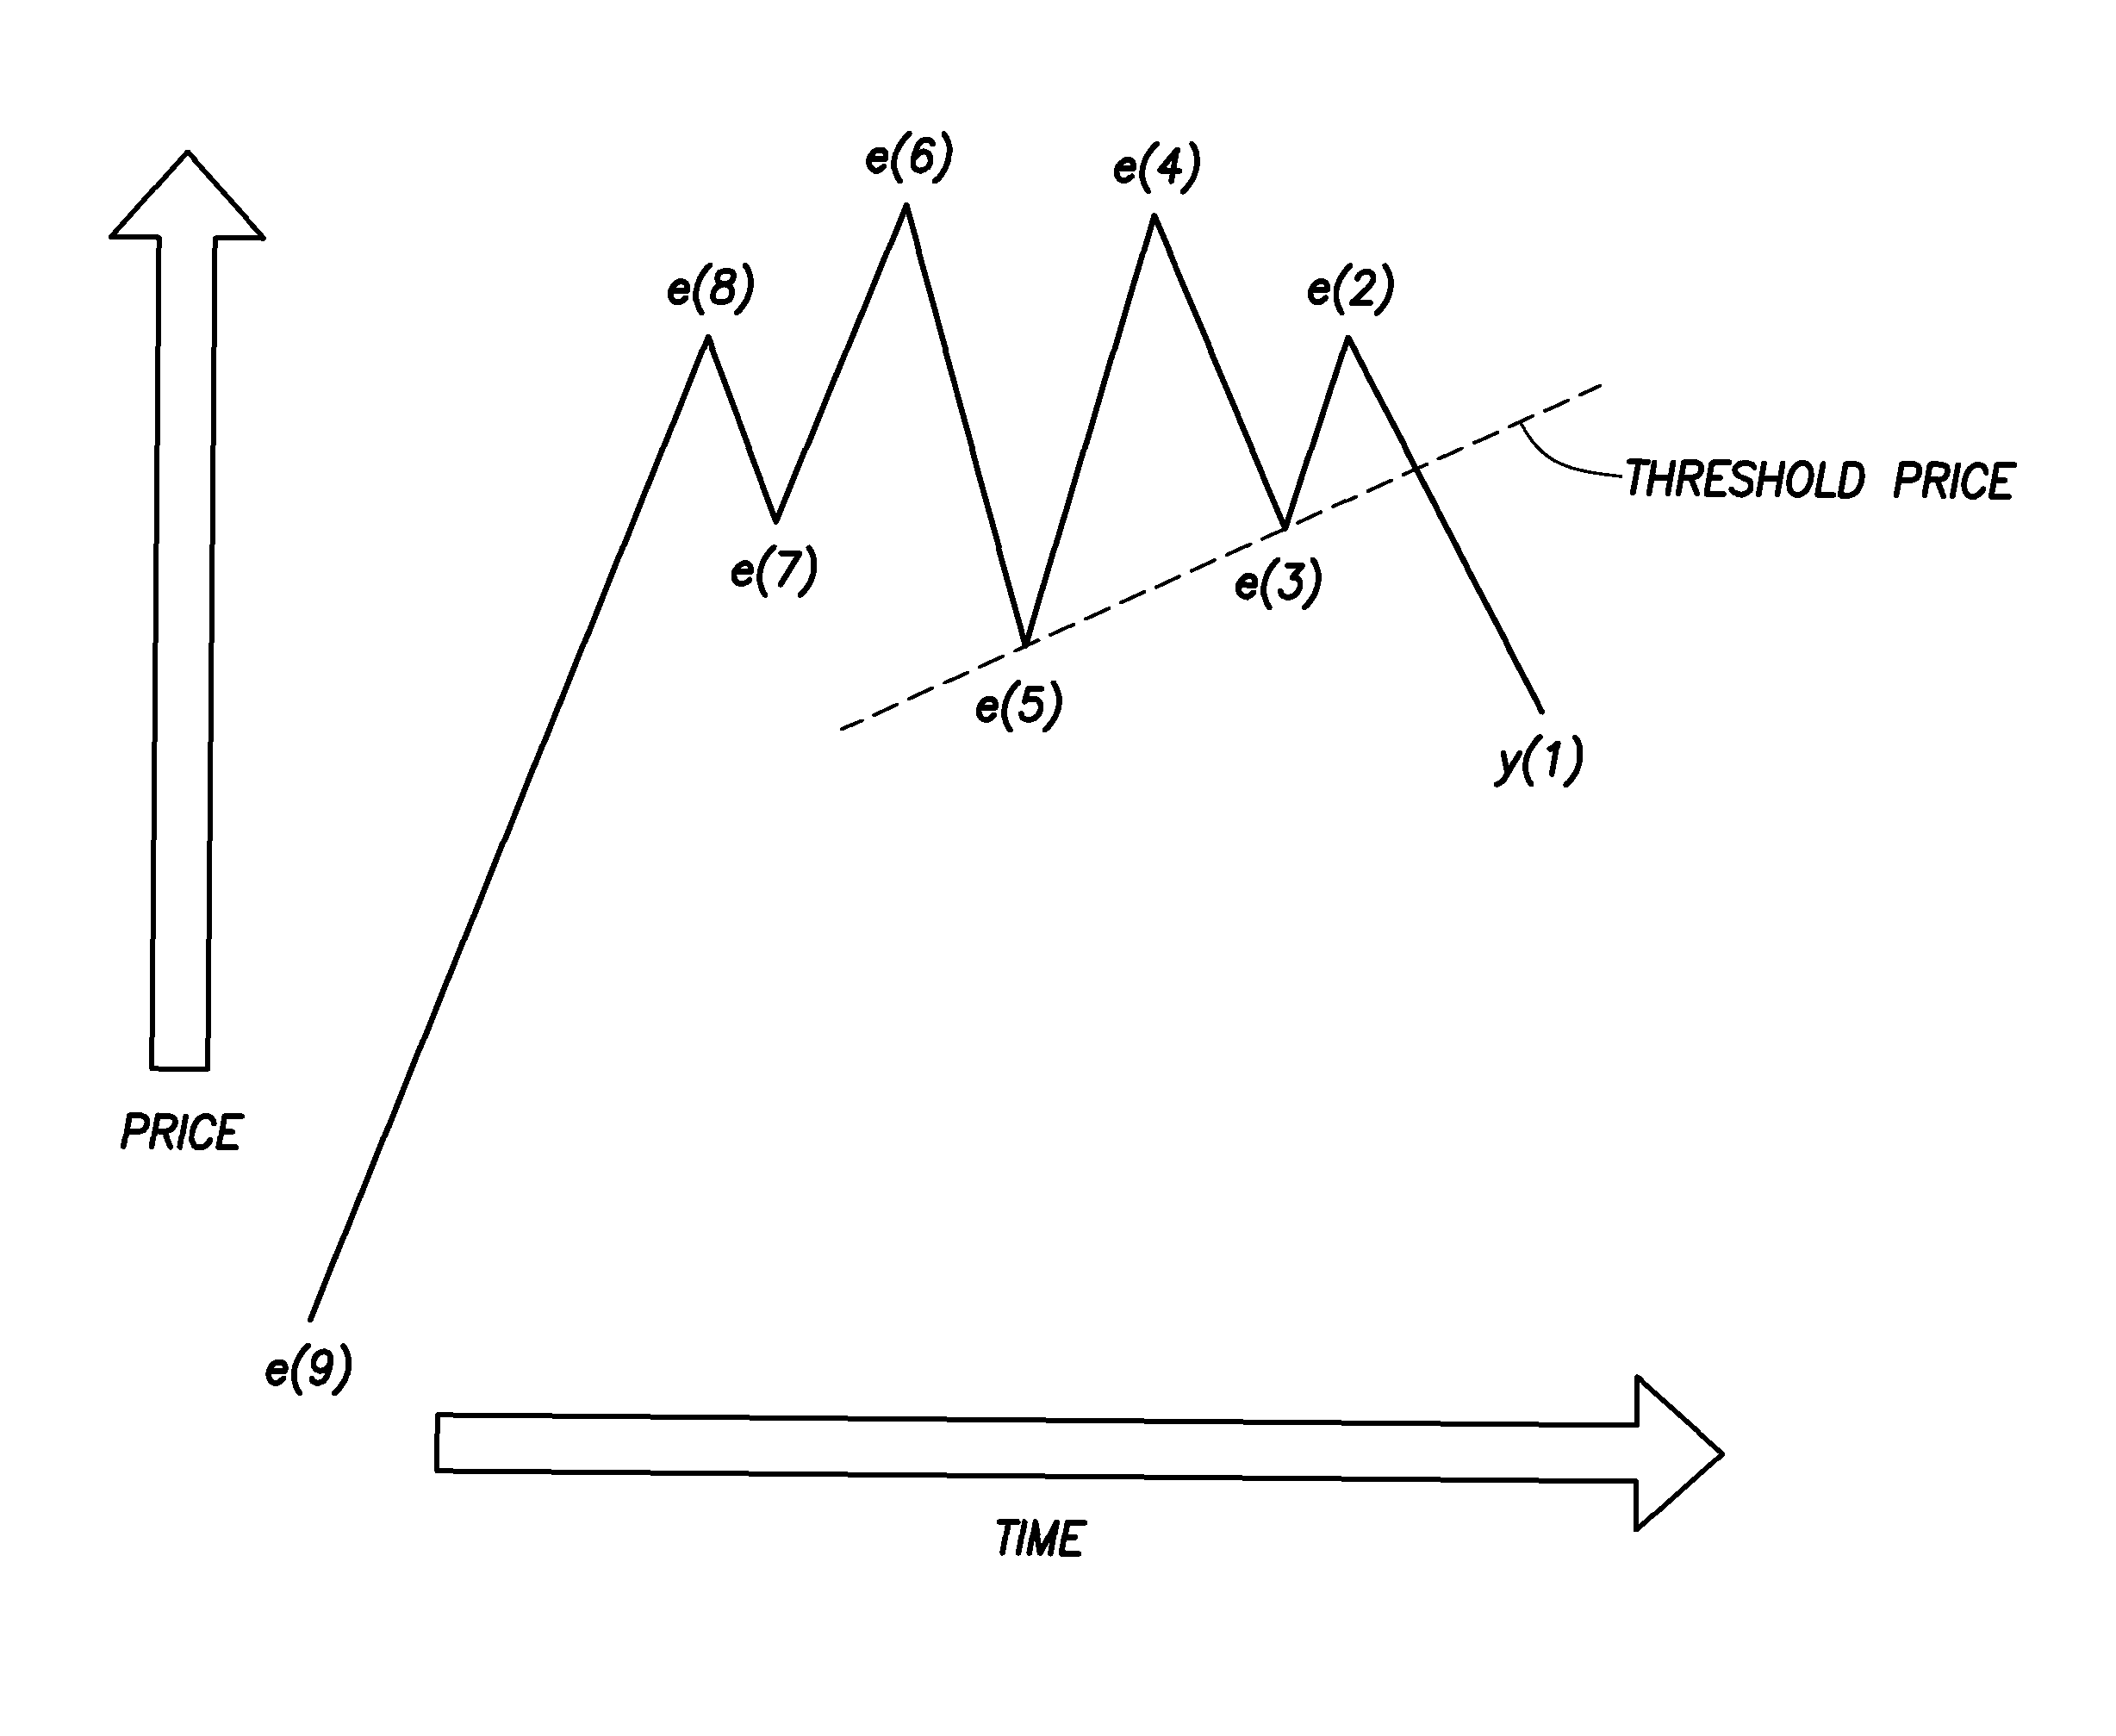
[0042]Generally, the present invention provides a method for the recognition of formations in financial data such as stock prices such as continuation triangle or reversal diamond formations. Such formations are useful in allowing investors and others who follow the financial markets to identify strategic buying and selling opportunities.

[0043]To allow a general method applicable to several different types of formations, we begin by establishing some terminology. Assume that there are n pivot points. Then we can refer to each pivot point as pi, where i=1 . . . n. Assume that the formation of interest has k extreme points, e1 . . . ek. Then the method of the present invention is to match the k extreme points to a corresponding number of pivot points so that the relationships between the extreme points is preserved in the relationships between the pivot points. Regarding intervals, we use the following notation: [a,b] refers an interval inclusive of both end points; (a,b] refers to an...


PUM


Abstract

A method of formation recognition in technical analysis relies on the use of pivot points. A formation of interest is defined in terms of extreme points. The extreme points can be characterized in relation to one another as a series of local or global extrema in corresponding intervals. The method numbers the pivot points in reverse chronological order and attempts to match pivot points with the extreme points of the formation of interest. The first pivot point is assigned to the first extreme point of the formation. A second pivot point is selected from the interval defined by the first pivot point and the highest numbered pivot point that is a high or a low, as required by the formation. Subsequent pivot points are selected from intervals determined based on the formation and previously determined intervals. A formation is recognized if corresponding pivot points are identified for all extreme points in the formation.

Description

[0001]The present application claims priority from U.S. Provisional Patent Application No. 60 / 322,643, filed on Sep. 17, 2001 and U.S. Provisional Application No. 60 / 345,331 filed on Nov. 9, 2001.FIELD OF THE INVENTION[0002]The present invention relates to financial analysis and particularly to formation recognition, such as formation recognition in the technical analysis of financial information.BACKGROUND OF THE INVENTION[0003]Technical analysis, as opposed to fundamental analysis, uses the past price, volume activity, or other measures of a stock, or of a market as a whole, to predict the future direction of the stock or market. The results of technical analysis (sometimes also referred to as “charting”) are usually summarized in charts or graphs that are studied by technicians to identify known trends and patterns in the data to forecast future performance.[0004]Traditionally, the approach to technical analysis is a manual one. One important aspect of technical analysis is patte...

Claims


Application Information

Patent Timeline
IPC IPC(8): G06Q40/00G06F17/00G06F17/10G06Q40/04G06Q40/06
CPCG06Q40/06G06Q40/04
Inventor SATCHWELL, CHRISTOPHER J.
Owner RECOGNIA
Learn More