Measurement of EEG reactivity

a reactivity and eeg technology, applied in the field of eeg reactivity measurement, can solve the problems of patient inability to respond, inapplicability of observational scoring system, and disturbed brain function and resulting eeg

Active Publication Date: 2010-11-30
GENERAL ELECTRIC CO
View PDF7 Cites 20 Cited by
  • Summary
  • Abstract
  • Description
  • Claims
  • Application Information

AI Technical Summary

Benefits of technology

[0017]In the present invention, a signal model is constructed for the EEG signal from the EEG signal data obtained from a subject. The signal model here refers to a formula that describes signal characteristics and thereby enables subsequent testing whether a stimulus causes a change in the stationarity of the signal, i.e. occurrence of non-stationarity in the signal. The change in the stationarity may be a quick, transient-type reversible change or a long-time or rather permanent change in the stationarity. The signal model may be, for example, a formula that enables the prediction of a signal value based on previous signal values. Prediction error, which is the difference between the predicted signal value and the measured signal value, may be used to test if signal stationarity has changed. This kind of signal prediction is typically done with autoregressive (AR) modeling. In autoregressive modeling, AR parameters are derived, which characterize the signal spectral properties. The AR parameters may be derived, for example, by solving so-called Yule-Walker equations, which include a p×p autocorrelation matrix, where p is equal to model order. However, as is discussed below, an autocorrelation function itself may also serve as a signal model, since it characterizes the spectrum of the signal. Comparison of autocorrelation function values calculated prior to and after the stimulus therefore allows a quick method for testing whether the stimulus caused a change in the stationarity of the signal. Alternatively, a change in the AR parameters may be used to detect a change in signal stationarity. Other formulas that may be used to produce signal model include Hjort descriptors, Teager energy operator (TEO), nonlinear energy operator (NLEO), and signal derivatives, for example. All the above-mentioned formulas may be sequentially applied to a time series signal and they characterize the spectral content and / or the variance (power) of the signal.
[0023]The invention enables an objective and a reliable measure of the EEG reactivity to be obtained without the presence of an EEG specialist, which enhances patient monitoring in an ICU environment. Furthermore, the invention enables exact detection and temporal positioning of the reactivity events in the signal. For example, the delay from the stimulus to the onset of reactivity may be measured.
[0025]In one embodiment of the invention, the measurement employs transcranial magnetic stimulation (TMS) of the subject's cortex. Since the stimulus is in this case not sensed through the sensory nervous system, the state of the neural pathways does not affect the measurement, but the measurement is specific to the cortical state of the subject. Furthermore, TMS offers an opportunity to activate relatively large populations of cortical neurons, hence supplying in a way much stronger stimulation to the cortex than what would be possible through sensory stimulation. In this way, TMS provides an efficient tool for assessing different levels of deep sedation or unconsciousness.

Problems solved by technology

Different derangements of internal system homeostasis disturb the environment in which the brain operates, and therefore the function of the brain and the resulting EEG are disturbed.
Moreover, the test of EEG reactivity provides information regarding the state of a patient for whom the GCS or another observational scoring system is not applicable.
This is the case, for example, when neuromuscular blocking agents have been administered to the patient, which makes the patient unable to respond and thus the observational scoring systems inapplicable.
In practice, ICU (Intense Care Unit) doctors or nurses, who are skilled in making GCS-type assessments, are usually not capable of interpreting the EEG waveforms, and therefore a consulting EEG specialist has to be called in for the test of EEG reactivity.
The test of the EEG reactivity is thus currently based on the visual assessment of the EEG waveform prior to and after the stimulation, since developing an automated testing procedure is complicated.

Method used


Image

  • Measurement of EEG reactivity
  • Measurement of EEG reactivity
  • Measurement of EEG reactivity

Examples


Embodiment Construction

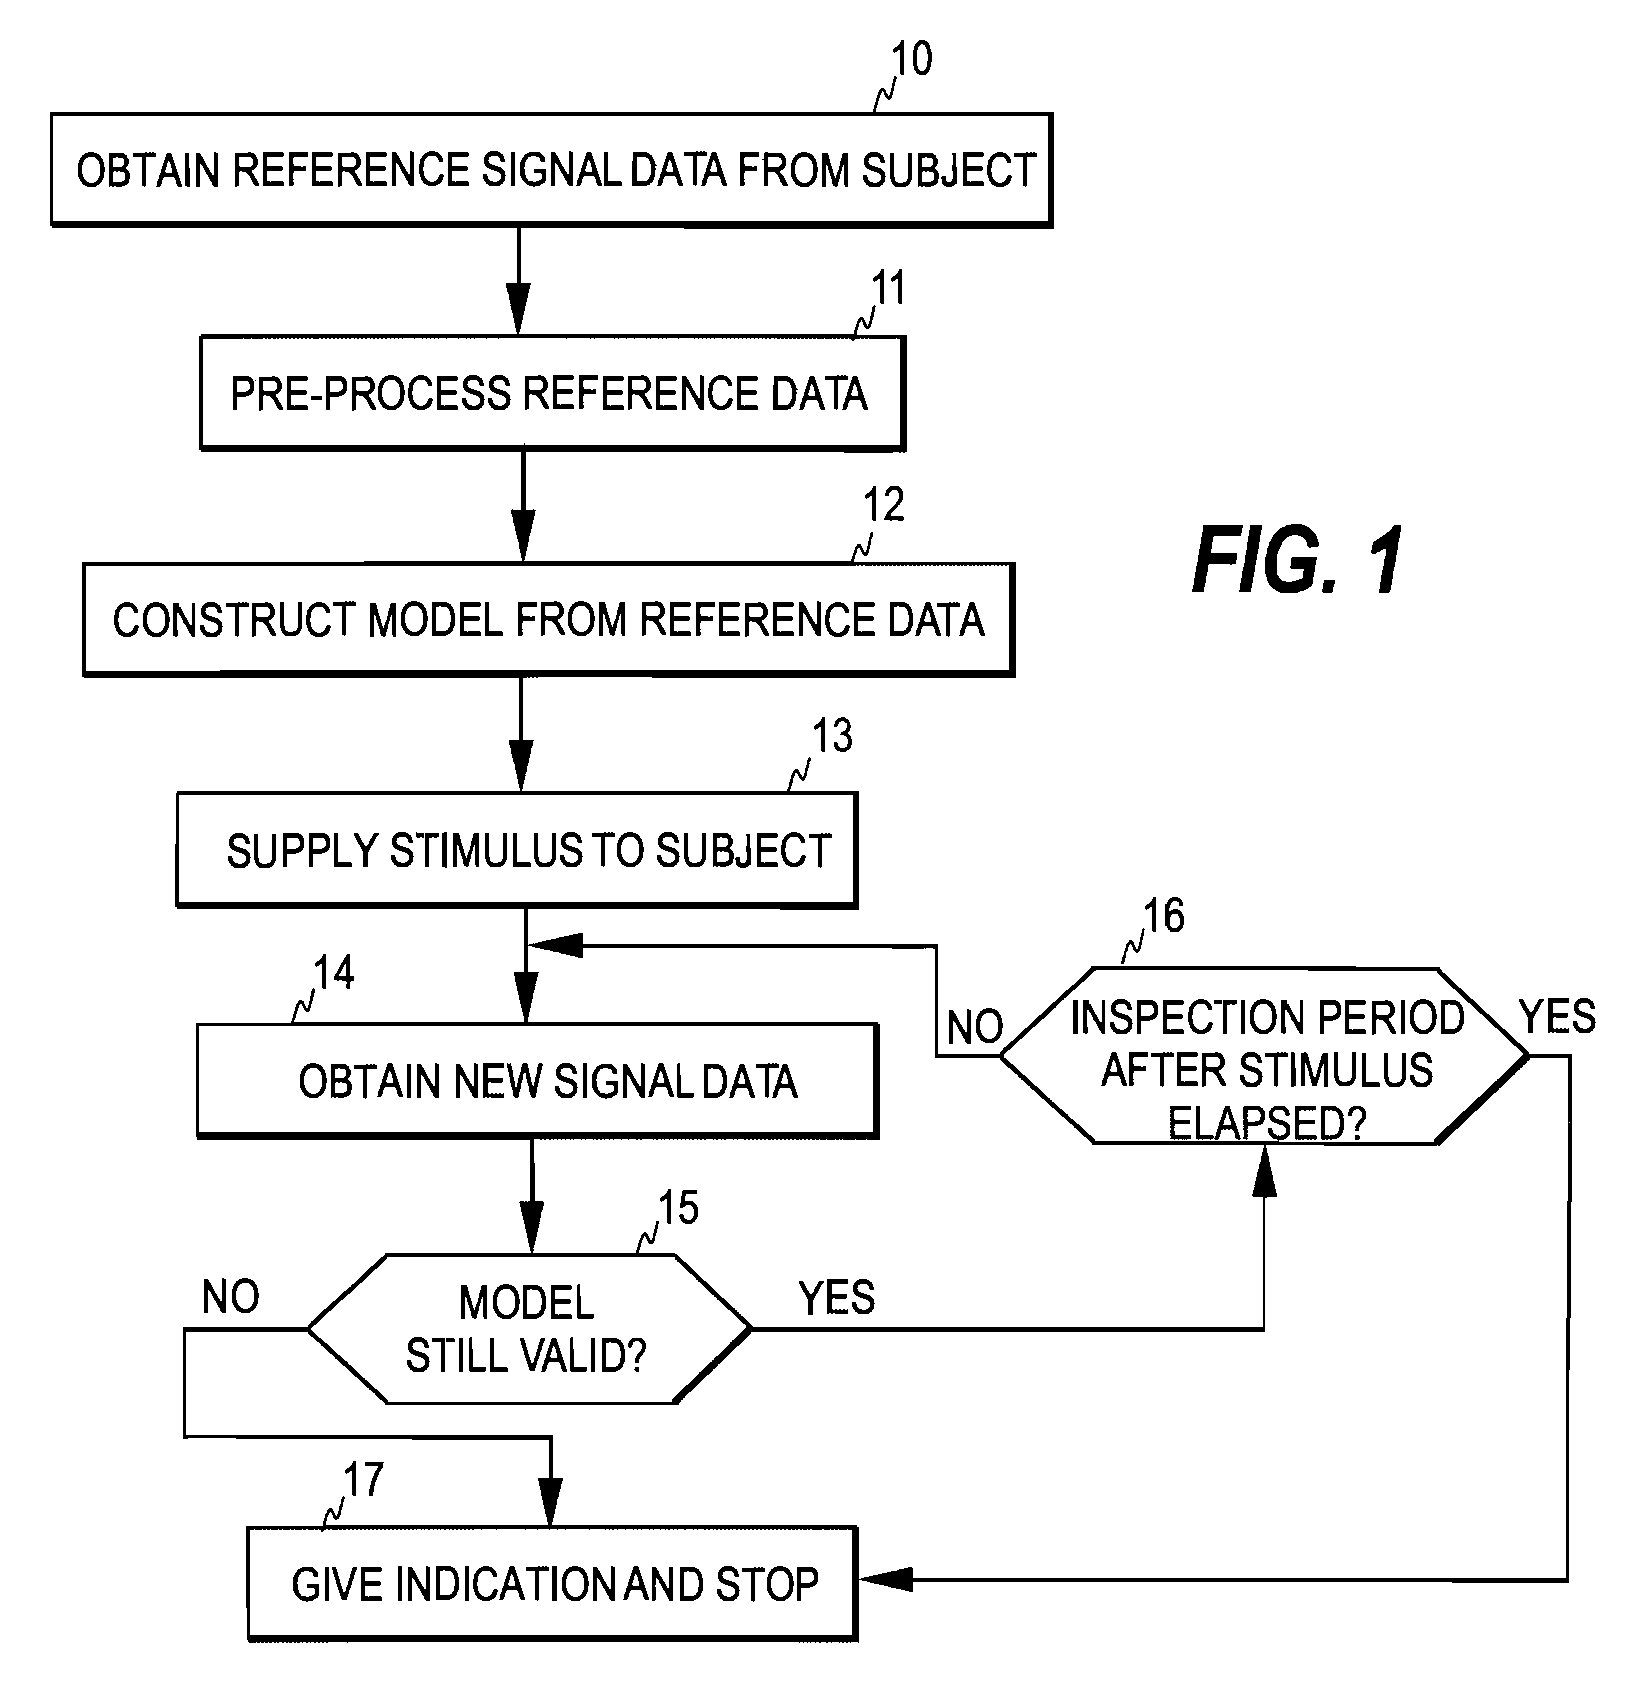
[0038]As discussed above, the present invention rests on adaptive segmentation of the physiological signal for detecting changes in the stationarity of the signal. In adaptive segmentation, the signal is not processed in fixed length time windows termed epochs, as is common in EEG analysis, but rather on a sample-by-sample basis.

[0039]FIG. 1 illustrates one embodiment of the present invention. An EEG signal measured from a patient (step 10) is first digitized to obtain a time series of EEG signal data. The sampled EEG signal may then be filtered to exclude high- and low-frequency artifacts (step 11). The signal data obtained initially from the patient may also be termed reference signal data in this context, since it is employed at step 12 to construct a valid signal model for the current time series. The signal model constructed enables prediction of signal values for the time series and a valid signal model meets predetermined criteria in the prediction. For example, the signal mo...


PUM


Abstract

The invention relates to a method and apparatus for assessing the reactivity observable in a certain physiological signal, especially the EEG signal, of a comatose subject. In order to obtain an objective and a reliable measure of the reactivity automatically and without the presence of a trained EEG specialist, a valid signal model is constructed for an EEG signal obtained from the subject. A time reference corresponding to a stimulus is applied and further signal data is obtained from the time series, the further signal data being subsequent to the time reference. By employing the further signal data, the method tests whether the signal model remains to be a valid signal model for the EEG signal also after the stimulus, and indicates, based on the test, whether reactivity is present in the physiological signal.

Description

FIELD OF THE INVENTION[0001]The present invention relates to the assessment of the reactivity of the central nervous system of a patient to external stimulation as observable on / in a physiological signal, especially an EEG signal. Below, the reactivity observable on / in a physiological signal is termed physiological signal reactivity. If the physiological signal concerned is an EEG signal, the said reactivity is termed briefly EEG reactivity.BACKGROUND OF THE INVENTION[0002]Neuromonitoring is a subfield of clinical patient monitoring focused on measuring various aspects of brain function and on changes therein caused by neurological diseases, accidents, and drugs commonly used to induce and maintain anesthesia in an operation room or sedation in patients under critical or intensive care.[0003]Electroencephalography (EEG) is a well-established method for assessing brain activity. When measurement electrodes are attached on the skin of the skull surface, the weak biopotential signals g...

Claims


Application Information

Patent Timeline
Patent Type & Authority Patents(United States)
IPC IPC(8): A61B5/04
CPCA61B5/0484G06F19/322A61B5/7221A61B5/7203A61B5/377G16H10/60
Inventor SARKELA, MIKAVIRTANEN, JUHAVIERTIO-OJA, HANNA E.SALMI, TAPANI
Owner GENERAL ELECTRIC CO
Why Eureka
Try Eureka