
Generating and displaying an application flow diagram that maps business transactions for application performance engineering

a flow diagram and business transaction technology, applied in the field of display systems, can solve the problems of known application mapping techniques failing to identify the cost and value of critical business assets to facilitate application performance engineering recommendations, and critical business assets vulnerable to changes in infrastructur

Inactive Publication Date: 2013-03-12
INT BUSINESS MASCH CORP
View PDF6 Cites 4 Cited by
  • Summary
  • Abstract
  • Description
  • Claims
  • Application Information

AI Technical Summary

Benefits of technology

Enables organizations to effectively identify and protect critical business assets by visualizing data flows, facilitating better performance engineering and asset protection strategies.

Problems solved by technology

In conventional application mapping technologies, information technology (IT) transactions are mapped to infrastructure without resolving the IT transactions to business functions, and critical business assets are not identified and mapped, thereby leaving the critical business assets vulnerable to changes in infrastructure.
Furthermore, known application mapping techniques fail to identify the cost and value of critical business assets to facilitate application performance engineering recommendations.

Method used


Image

  • Generating and displaying an application flow diagram that maps business transactions for application performance engineering
  • Generating and displaying an application flow diagram that maps business transactions for application performance engineering
  • Generating and displaying an application flow diagram that maps business transactions for application performance engineering

Examples


examples

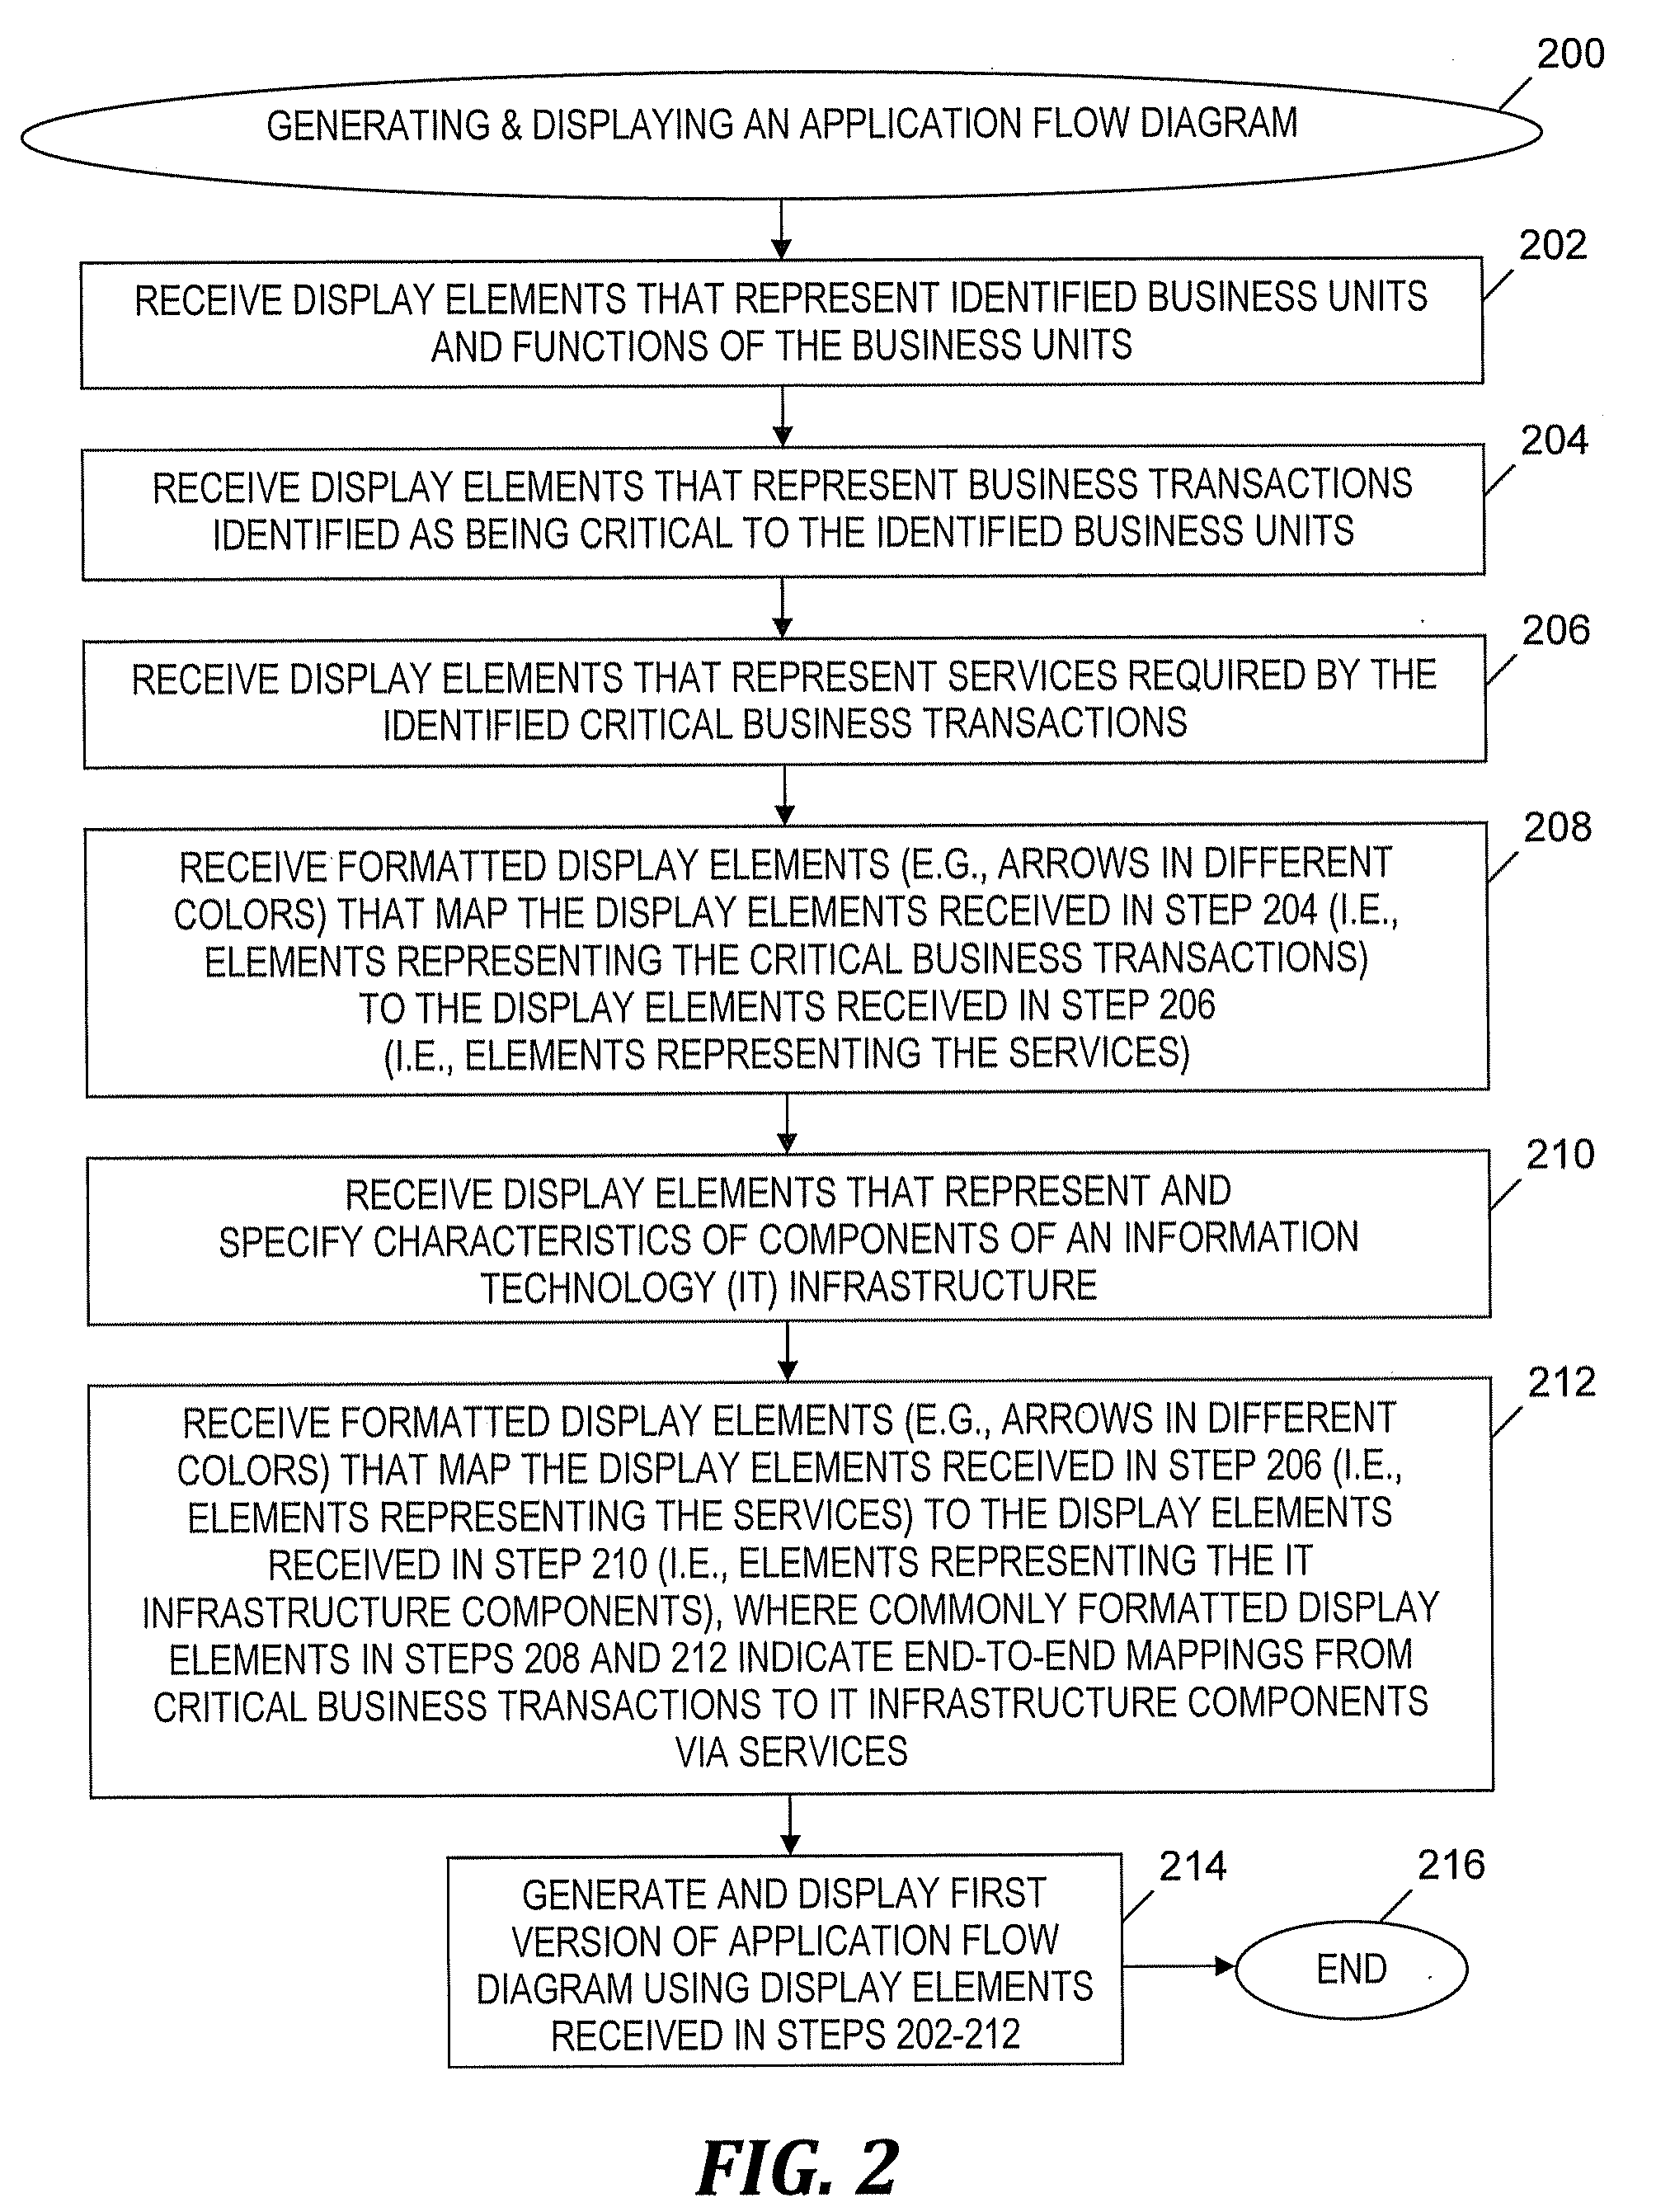
[0071]FIG. 4A-4B is a block diagram of an exemplary service-oriented architecture (SOA) application performance engineering project plan that includes the processes of FIG. 2 and FIGS. 3A-3B, in accordance with embodiments of the present invention. A first portion 400-1 of a SOA application performance engineering project plan is shown in FIG. 4A and includes workshop activities 402-1 and data collection activities 402-2. Workshop activities 402-1 start with step 404. In step 404, a business management team identifies key business units and / or a business grouping structure, along with the functions of the identified business units or groups. Step 404 also includes the identified key business units and / or groups being stored in a computer data storage device and displayed by a display device. Step 404 is an example that includes step 202 (see FIG. 2).

[0072]In step 406, a representative or liaison of an identified business unit or group identifies the critical applications (i.e., crit...


PUM


Abstract

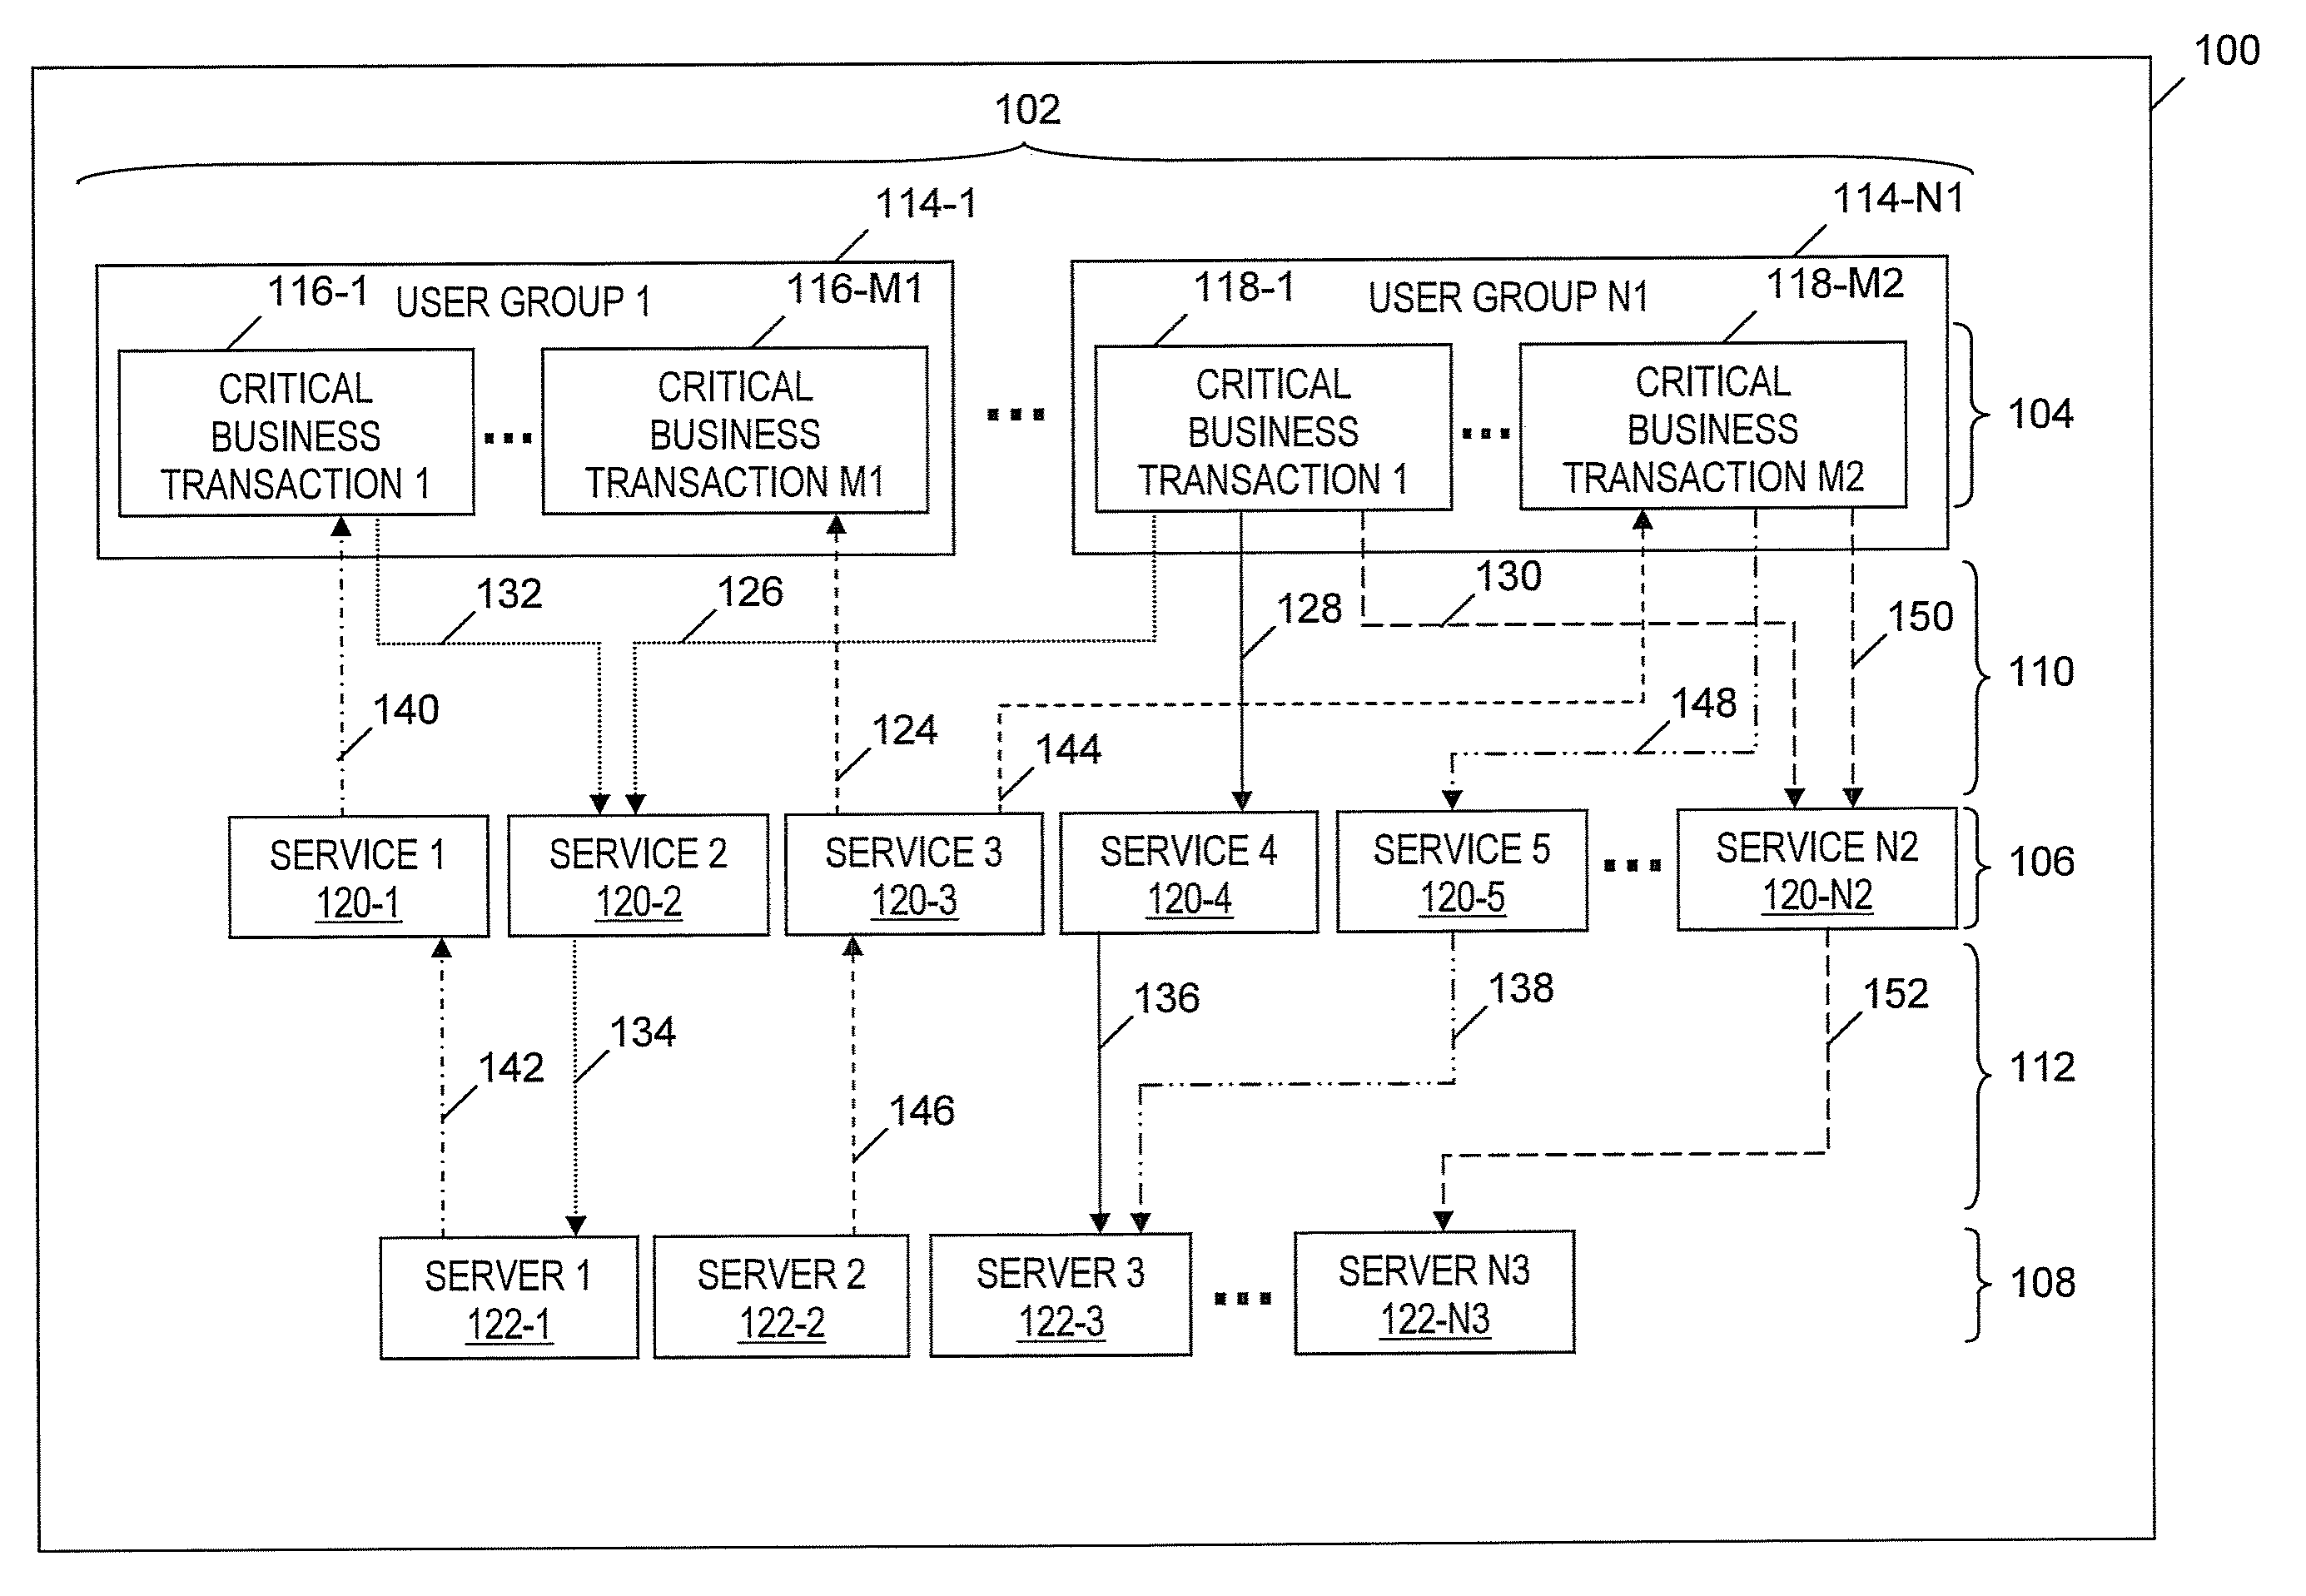
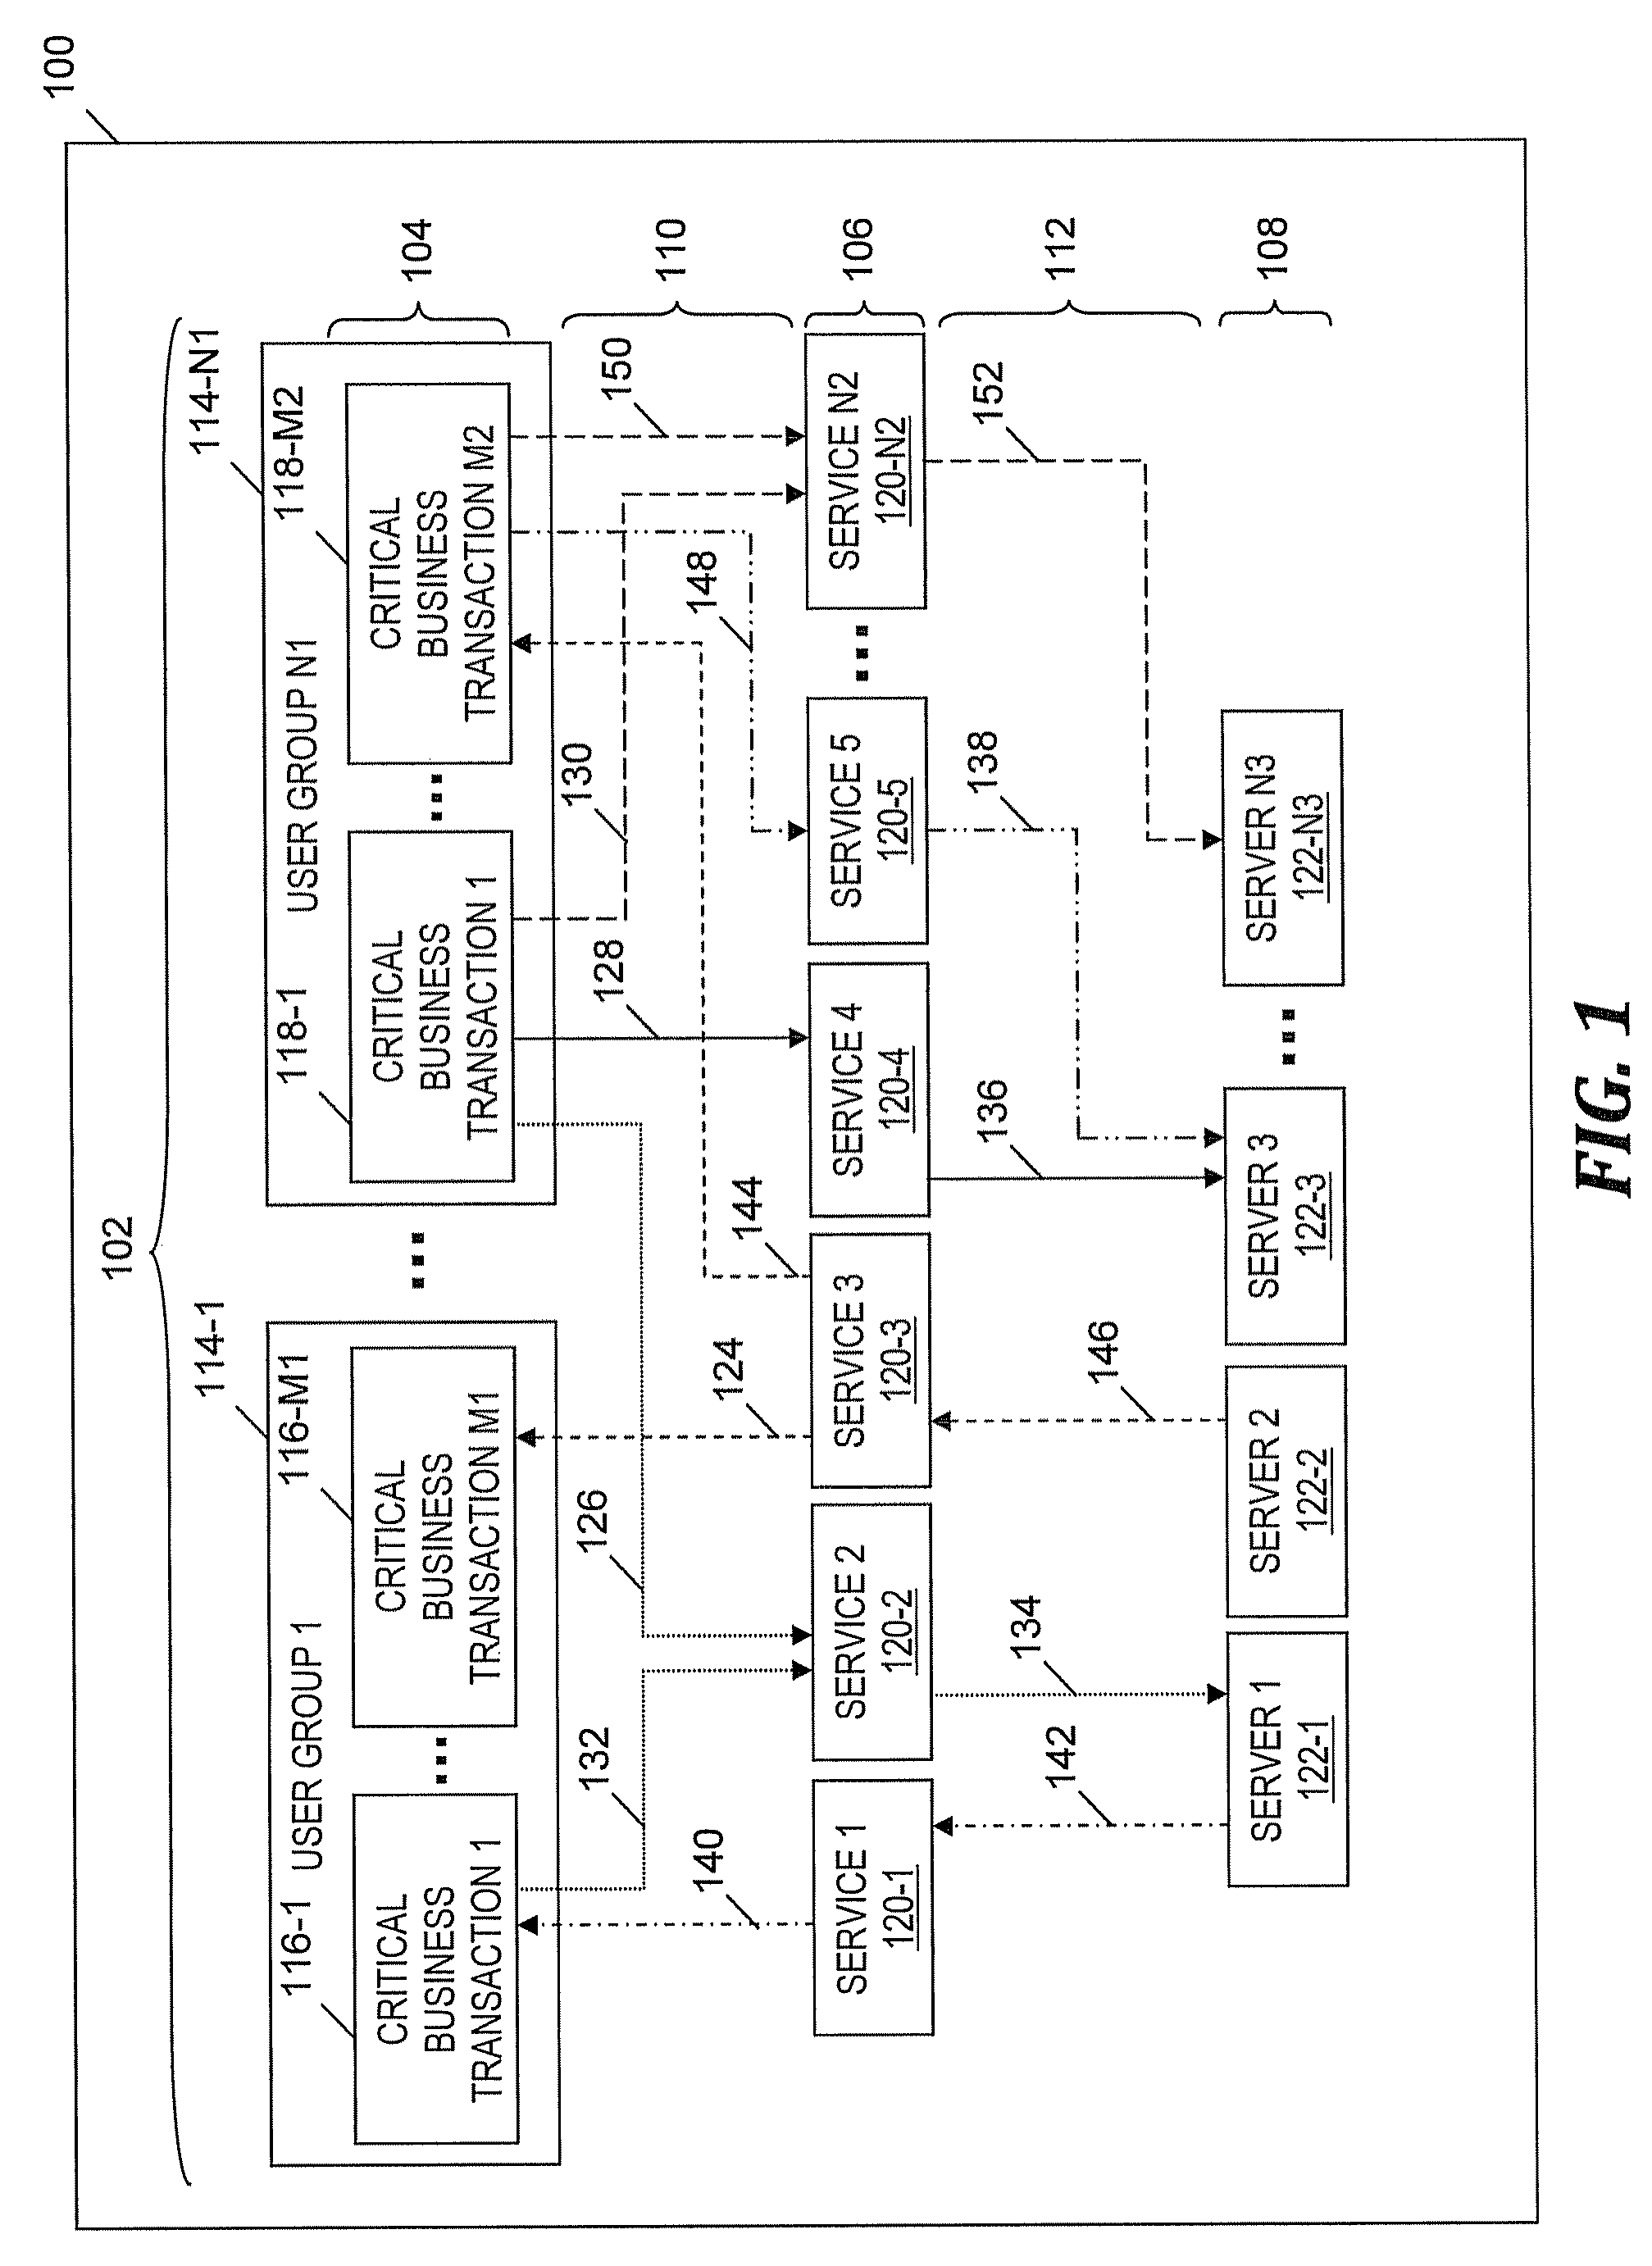
A method and apparatus for generating and displaying an application flow diagram for an application. The application flow diagram includes: a set of business transaction display elements representing critical business transactions that sustain or provide revenue for an organization; a set of service display elements representing services required by the critical business transactions; a set of infrastructure display elements representing information technology (IT) infrastructure components utilized by the services; and formatted display elements (e.g., arrows) that map the business transaction display elements to the service display elements and the service display elements to the infrastructure display elements, thereby indicating an end-to-end flow of data between the critical business transactions and the IT infrastructure components.

Description

FIELD OF THE INVENTION[0001]The present invention relates to display systems and more particularly to display systems that present application flow diagrams.BACKGROUND OF THE INVENTION[0002]In conventional application mapping technologies, information technology (IT) transactions are mapped to infrastructure without resolving the IT transactions to business functions, and critical business assets are not identified and mapped, thereby leaving the critical business assets vulnerable to changes in infrastructure. Furthermore, known application mapping techniques fail to identify the cost and value of critical business assets to facilitate application performance engineering recommendations. Thus, there exists a need to overcome at least one of the preceding deficiencies and limitations of the related art.SUMMARY OF THE INVENTION[0003]The present invention provides an apparatus comprising a display device configured to display an application flow diagram for an application. The applica...

Claims


Application Information

Patent Timeline
Patent Type & Authority Patents(United States)
IPC IPC(8): G06T11/20G06F3/048G06Q10/00
CPCG06Q10/00G06Q10/0637
Inventor HOUGHTLIN, MARK ROBERTMENDEZ, MICHAEL ANTHONY
Owner INT BUSINESS MASCH CORP
Learn More