
Method for performing a blood count and determining the morphology of a blood smear

a technology of blood smear and morphology, which is applied in the field of performing a blood smear and determining the morphology of the blood smear, can solve the problems of insufficient inability to determine the absolute number of cells present in the blood smear, and inability to achieve sufficient control of the smear

Inactive Publication Date: 2014-06-10
ABBOTT LAB INC
View PDF5 Cites 3 Cited by
  • Summary
  • Abstract
  • Description
  • Claims
  • Application Information

AI Technical Summary

Benefits of technology

[0031]The method and the device described herein can consolidate the process of blood counting and review of a blood smear in a single instrument. The method and device described herein require only a few reagents, which reagents are inexpensive. The method and device described herein are not complex in a technological sense, because only a single undiluted volume of whole blood is used.
[0033]The analysis of the blood count and the blood smear can be performed on the same sample of whole blood, thereby giving the user the opportunity to directly review the instrument's interpretation of the classification of cells.

Problems solved by technology

Such a process has two inherent limitations.
When a sample of blood is spread to form a blood smear, the volume of blood used to form the blood smear cannot be sufficiently controlled to a point where an accurate estimate of the volume of blood can be made, with the result that the absolute number of cells present in the blood smear cannot be determined.
Furthermore, although devices in which a monolayer of a blood sample can be deposited have been developed, these devices typically rely on centrifugation to distribute cells evenly across the surface of a rectangular-shaped microscope slide.
Typically, some unknown volume of the blood sample is lost from the microscope slide during the centrifugation process.
Because the quantity of cells lost is unknown and unpredictable, an accurate estimate of the volume of blood remaining on the microscope slide at the end of the analysis cannot be made.
Therefore, only limited information can be derived with respect to the proportions of cells in the blood sample, and no information that requires knowledge of the total volume of the blood sample can be made.
In the thick portion of the blood smear, the cells may overlay one another to such an extent that an automated instrument or a human morphologist is unable to reliably identify and record the morphology of the cells.
For example, two-dimensional imaging algorithms have difficulty in discerning the difference between two small overlapping cells and one larger cell having an irregular shape.
This problem appears to negate the ability to perform a quantitative analysis of the numbers of leukocytes, erythrocytes, and platelets in a blood smear, because the area of a blood smear that is suitable for cell counting would vary unpredictably from blood sample to blood sample with respect to the thickness and length of the blood smear.

Method used


Image

  • Method for performing a blood count and determining the morphology of a blood smear
  • Method for performing a blood count and determining the morphology of a blood smear
  • Method for performing a blood count and determining the morphology of a blood smear

Examples


example 1

[0079]This example illustrates one approach for using a blood smear technique described herein to carry out a quantitative blood count.

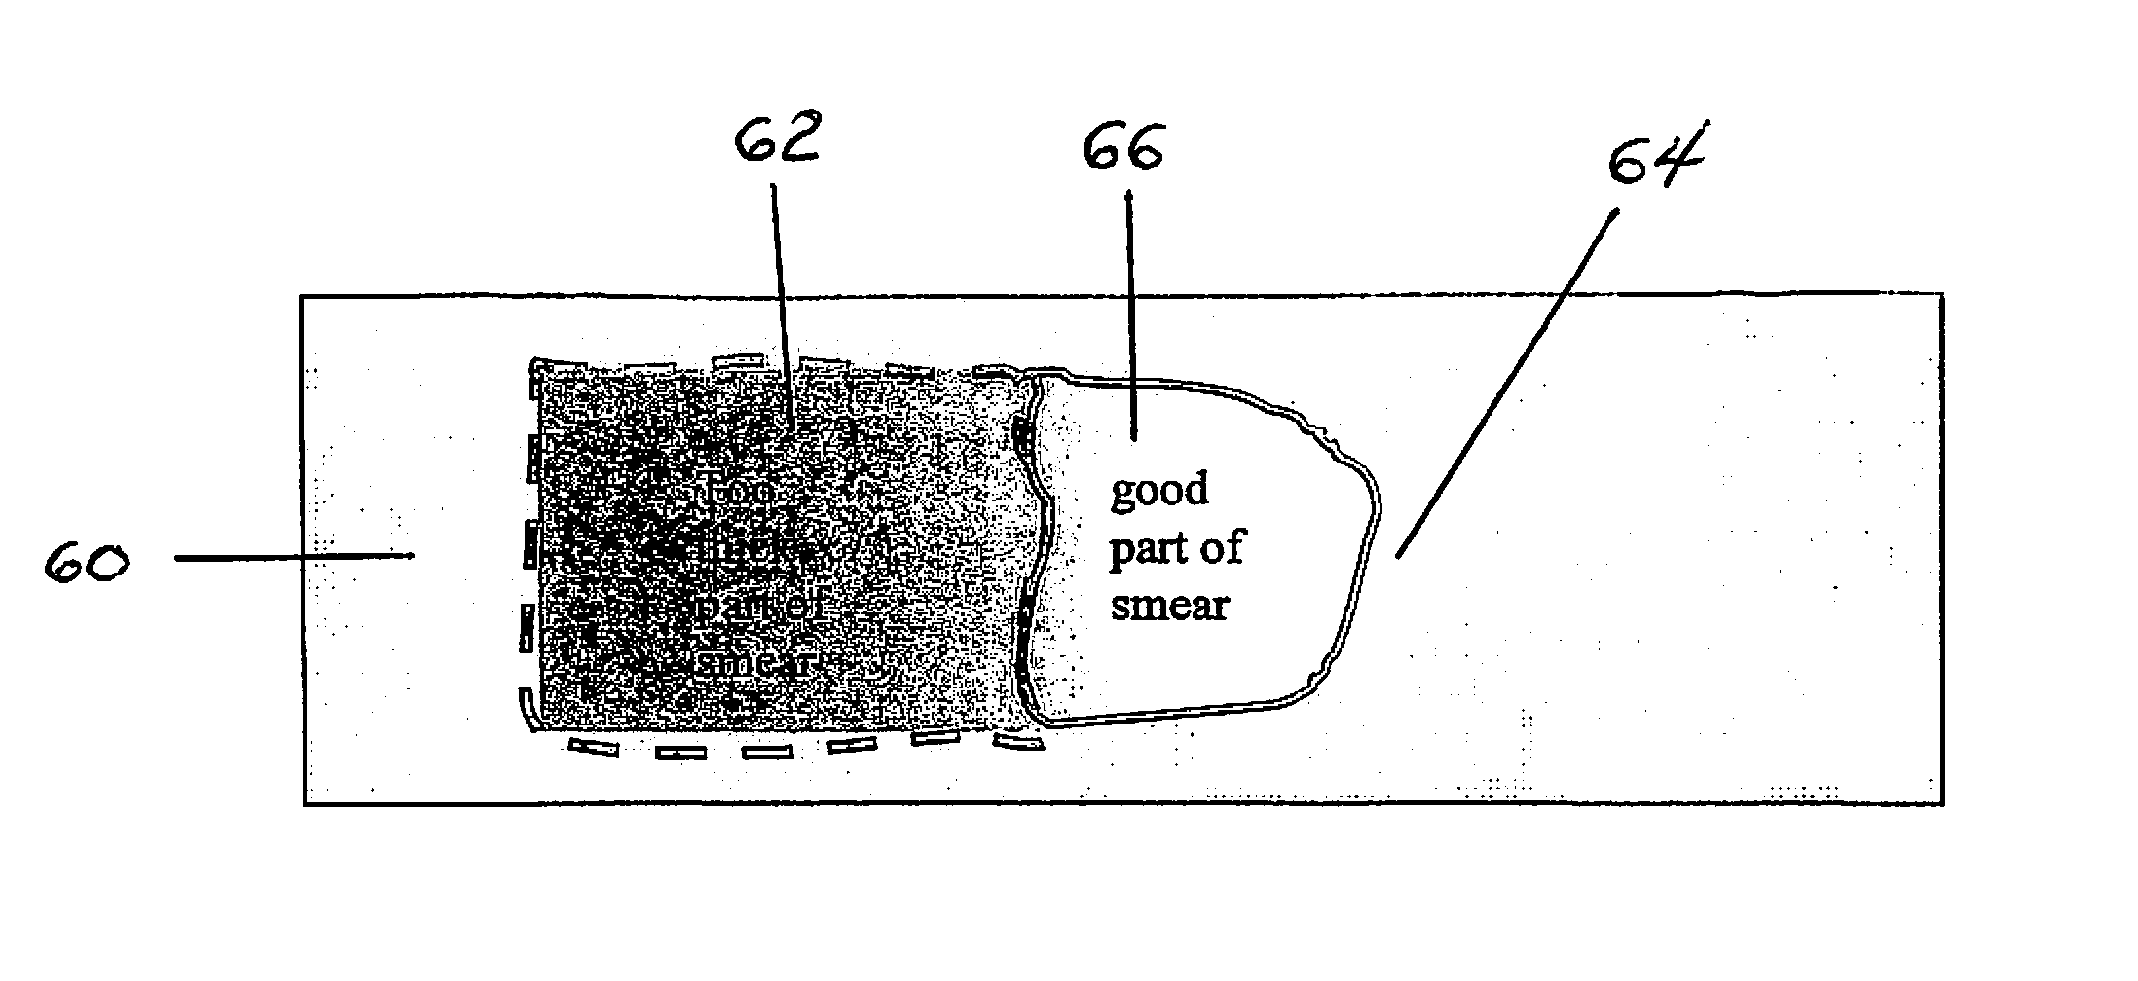
[0080]Referring now to FIG. 7, a sample of whole blood 100 drawn from a sample tube “S” and having a known volume is deposited on a microscope slide 110 in an initial drop 120, e.g., 50 microliters. It is assumed that no blood is lost in the process for creating the blood smear. Accordingly, all of the cells in the blood sample are accounted for in the blood smear. The low power imaging device measures optical density or reflectance resulting from the hemoglobin in a piece-wise fashion (i.e., via pixels) across the entire area of the blood smear. The low power imaging device can be a 10× objective lens of a microscope. It is assumed that the optical density or reflectance value of each piece of the image (i.e., pixel) is proportional to the amount of red blood cells in the piece. The term “piece” is synonymous with the smaller section 68, shown in FI...

example 2

[0084]Referring now to FIG. 8A, several different blood smears, ten (10) in number, are shown. These blood smears represent blood smears made with different samples of whole blood containing varying amounts of hemoglobin, which causes the overall optical density or reflectance of the blood smears to differ in intensity. FIG. 8B shows the thick end of each blood smear and the thin end of each blood smear of FIG. 8A. By means of an appropriate scanning procedure, the optical density profile of the blood smear can be graphed. Each point on the X-axis of the graph represents the distance of a point of the blood smear on the slide, as measured from the point of origin of the drop of whole blood on the slide. The Y-axis of the graph represents the optical density or reflectance at a given point of the blood smear on the slide, as measured from the point of origin of the drop of whole blood on the slide. FIG. 8C shows the optical density profiles or reflectance profiles of the blood smears...

example 3

[0085]This example illustrates a technique for determining a blood count wherein only a narrow portion of the minor axis of the microscope slide is used. Instead of using the approach described in Example 1, the values corresponding to a line of pixels though the center of a slide can be measured by the low power imaging system. It should be noted that the line being scanned has two dimensions, but the minor dimension of the line is much narrower than the minor dimension that is scanned is Example 1. This technique can be used if the device employs a single detection beam through which the slide is moved, i.e., scanned, while the optical density values or reflectance values are recorded. While not being a true imaging system, the same result is produced by scanning a line rather than the plurality of lines needed to make up a larger area. It is believed that this embodiment is less expensive that the embodiment described previously.

[0086]If the pixel values along the line being scan...


PUM

PropertyMeasurementUnit
volumeaaaaaaaaaa
volumeaaaaaaaaaa
volumeaaaaaaaaaa

Abstract

A method for counting blood cells in a sample of whole blood. The method comprises the steps of:(a) providing a sample of whole blood;(b) depositing the sample of whole blood onto a slide, e.g., a microscope slide;(c) employing a spreader to create a blood smear;(d) allowing the blood smear to dry on the slide;(e) measuring absorption or reflectance of light attributable to the hemoglobin in the red blood cells in the blood smear on the slide;(f) recording a magnified two-dimensional digital image of the area of analysis identified by the measurement in step (e) as being of suitable thickness for analysis; and(g) collecting, analyzing, and storing data from the magnified two-dimensional digital image.Optionally, steps of fixing and staining of blood cells on the slide can be employed in the method.

Description

BACKGROUND OF THE INVENTION[0001]1. Field of the Invention[0002]This invention relates to a method for performing a blood count by means of a blood smear.[0003]2. Discussion of the Art[0004]Automated counting of blood cells typically involves counting blood cells after a sample of whole blood having a known volume is obtained and subsequently diluted in an appropriate diluent. Knowledge of the initial volume of the sample and the degree of subsequent dilution allows a quantitative determination of the numbers of different types of cells in the given volume of the original sample of whole blood. For example, if a microliter of whole blood is diluted so as to yield a volume of 1000 microliters, the dilution ratio is said to be 1:1000, and the dilution factor is said to be 1000. If a blood count for this diluted sample of blood indicates that there are 5000 red blood cells per microliter, the red blood cell count in the original undiluted blood sample is equal to the product of 1000 an...

Claims


Application Information

Patent Timeline
Patent Type & Authority Patents(United States)
IPC IPC(8): G01N33/72
CPCG01N2015/1486G01N15/1475G01N2333/805G01N1/2813G01N33/721G01N2015/0073G01N21/59G01N2001/282G01N15/1434G01N21/27G01N21/49G01N2015/008
Inventor KENDALL, RICHARDROCHE, JOHN W.
Owner ABBOTT LAB INC
Learn More