Graphical display with integrated recent period zoom and historical period context data

a zoom and context data technology, applied in the field of graphical display interfaces for displaying time series data, can solve the problems of difficult to figure out why market participants are buying or selling, system failure to offer satisfactory solutions, and almost impossible to see anything as small as a day

Active Publication Date: 2015-11-17
TRADING TECH INT INC
View PDF41 Cites 9 Cited by
  • Summary
  • Abstract
  • Description
  • Claims
  • Application Information

AI Technical Summary

Problems solved by technology

However, trying to figure out why market participants are buying or selling can be very difficult.
However, due to the screen size limitations, the prior art systems do not offer satisfactory solutions for viewing the short-term chart details and the long-term chart details on a single axis.
However, as shown in FIG. 1A, it is almost impossible to see anything as small as a day, and totally impossible to see anything on the order of an hour, a minute, or a second, since there is not enough

Method used


Image

  • Graphical display with integrated recent period zoom and historical period context data
  • Graphical display with integrated recent period zoom and historical period context data
  • Graphical display with integrated recent period zoom and historical period context data

Examples


Embodiment Construction

I. Historical and Current Data Integrated Graph Display Overview

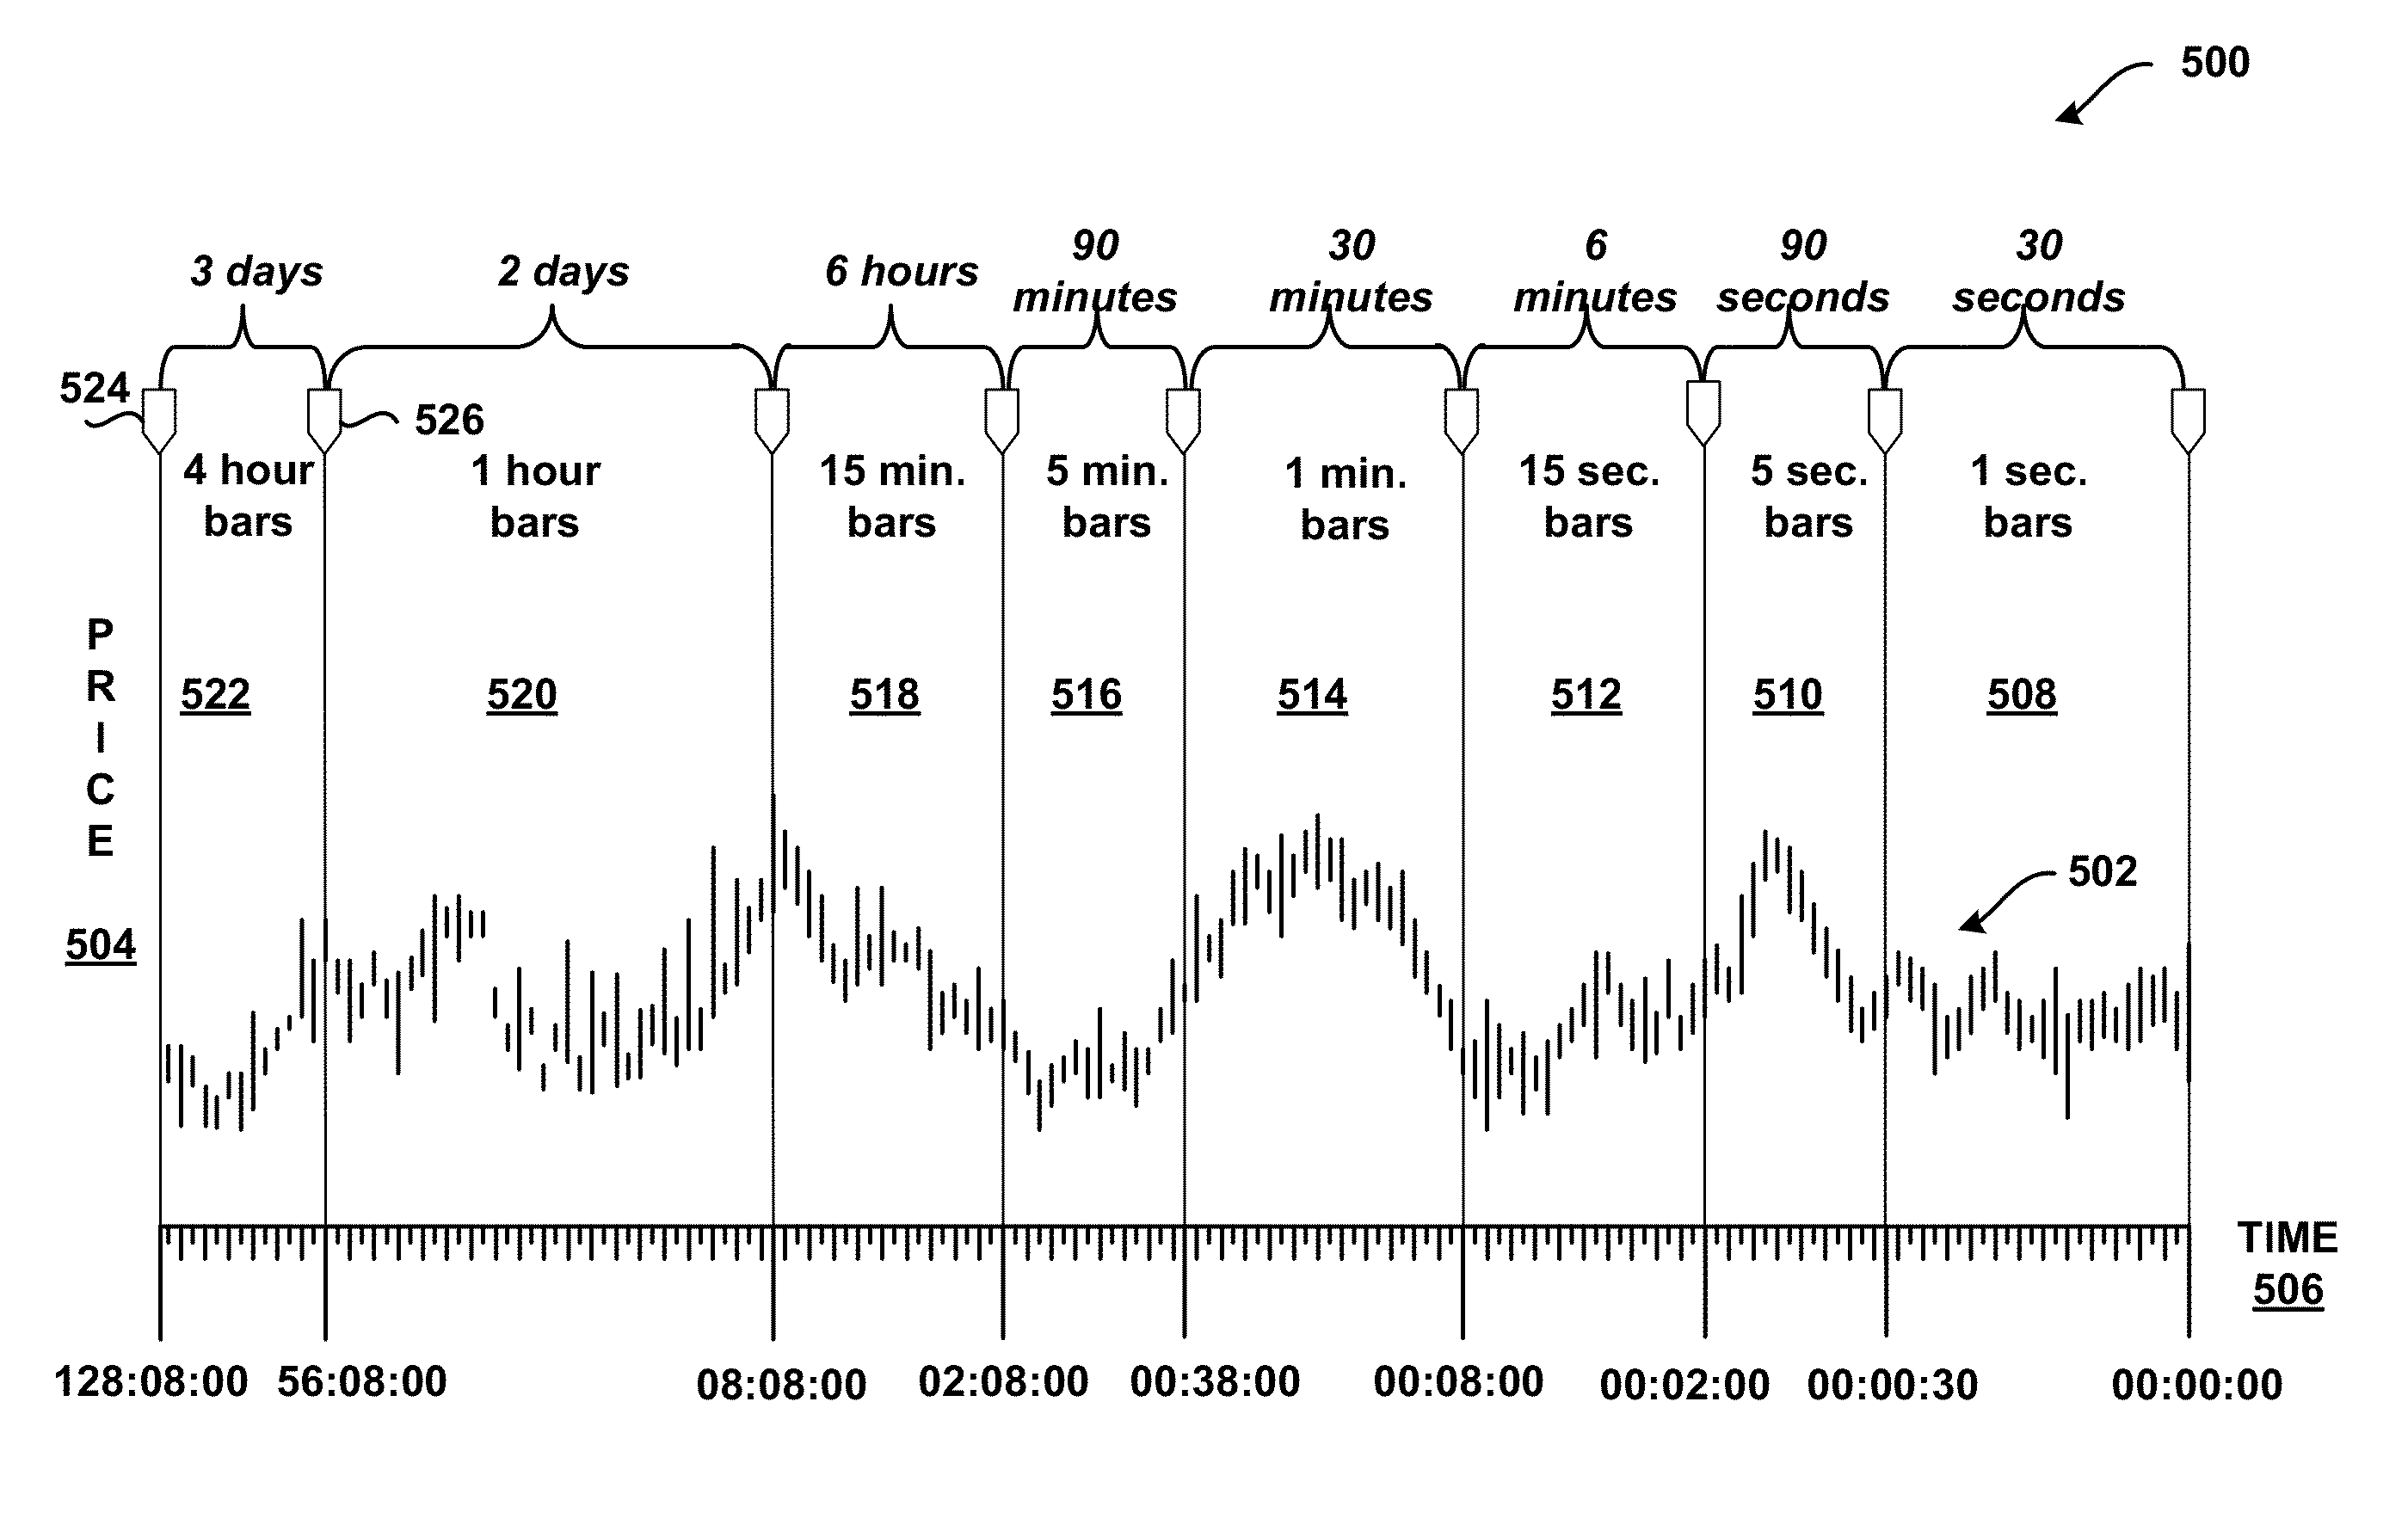
[0023]According to one example embodiment, a graphical interface is provided for displaying at least one data series. The data series can be associated with one or more variables having domains that extend over several orders of magnitude. An example of the data series could be one or more time series data; however, different data series could also be displayed in relation to the graphical interface of the example embodiments. Preferably, the graphical interface includes at least one axis, and the axis is divided into a plurality of axis regions that use different linear scales, while the combination of the regions forms a continuous non-linear scale axis. The graphical interface also includes at least one chart that is displayed in relation to the plurality of axis regions. The chart presents the data series that is plotted in each axis region based on a scale resolution corresponding to each respective axis region.

[00...


PUM


Abstract

A system and method are provided for displaying a data series. In one embodiment, a graphical interface is provided including at least one axis that is divided into a plurality of axis regions. Preferably, each axis region uses a different linear scale, and the plurality of axis regions forms a continuous non-linear scale. The graphical interface also displays the data series in relation to the plurality of axis regions, and the data series is plotted in relation to each axis region based on a scale resolution corresponding to each respective axis region.

Description

CROSS-REFERENCE TO RELATED APPLICATIONS[0001]This application is a continuation of U.S. patent application Ser. No. 13 / 761,145, now U.S. Pat. No. 8,537,161, filed Feb. 6, 2013, which is a continuation of U.S. patent application Ser. No. 13 / 587,865, now U.S. Pat. No. 8,395,625, filed Aug. 16, 2012, which is a continuation of U.S. patent application Ser. No. 13 / 237,440, now U.S. Pat. No. 8,269,774, filed Sep. 20, 2011, which is a continuation of U.S. patent application Ser. No. 13 / 106,770, now U.S. Pat. No. 8,044,959, filed May 12, 2011, which is a continuation of U.S. patent application Ser. No. 12 / 604,979, now U.S. Pat. No. 7,965,292, filed Oct. 23, 2009, which is a continuation of U.S. patent application Ser. No. 12 / 027,073, now U.S. Pat. No. 7,629,975, filed Feb. 6, 2008, which is a continuation of U.S. patent application Ser. No. 11 / 415,977, now U.S. Pat. No. 7,348,981, filed May 2, 2006, which is a continuation of U.S. patent application Ser. No. 10 / 814,986, now U.S. Pat. No. 7,...

Claims


Application Information

Patent Timeline
IPC IPC(8): G06T11/20G06Q30/06
CPCG06T11/206G06Q30/06G06Q40/04G06F3/04817G06F3/04845G06F3/04847G06T3/40
Inventor BUCK, BRIAN J.
Owner TRADING TECH INT INC
Why Eureka
Try Eureka