Method for calculating sensor performance of a sensor grid using dynamic path aggregation

a sensor grid and dynamic path technology, applied in probabilistic networks, instruments, computing, etc., can solve the problems of unrealistically inflating the overall probability of detection, inherently flawed analysis, and no one system will detect every possible weapon

Inactive Publication Date: 2016-12-27
USA REPRESENTED BY THE SEC OF THE NAVY
View PDF5 Cites 1 Cited by
  • Summary
  • Abstract
  • Description
  • Claims
  • Application Information

AI Technical Summary

Benefits of technology

[0029]Selection of the restricted stochastic model comprises utilizing an ExPdMax(s) technique adapted for the restricted stochastic model to reduce a number of required calculations f

Problems solved by technology

Unfortunately, no one system will detect every possible weapon.
This unrealistically inflates overall probability of detection.
However, this analysis is inherently flawed in that each detection opportunity is not independent from the others.
In practice, however, we can only capture a subset of all of the variables that affect sensor performance.
Furthermore, we cannot measure this subset with absolute precision.
However, the idea of a random target explicitly means that both the excluded variables and any random noise components on the variable measurements must be truly random in nature.
Note that for a detection system comprised of a system -of-systems, measuring individual se

Method used


Image

  • Method for calculating sensor performance of a sensor grid using dynamic path aggregation
  • Method for calculating sensor performance of a sensor grid using dynamic path aggregation
  • Method for calculating sensor performance of a sensor grid using dynamic path aggregation

Examples


Embodiment Construction

[0073]Detailed descriptions of the preferred embodiment are provided herein. It is to be understood, however, that the present invention may be embodied in various forms. Therefore, specific details disclosed herein are not to be interpreted as limiting, but rather as a basis for the claims and as a representative basis for teaching one skilled in the art to employ the present invention in virtually any appropriately detailed system, structure or manner.

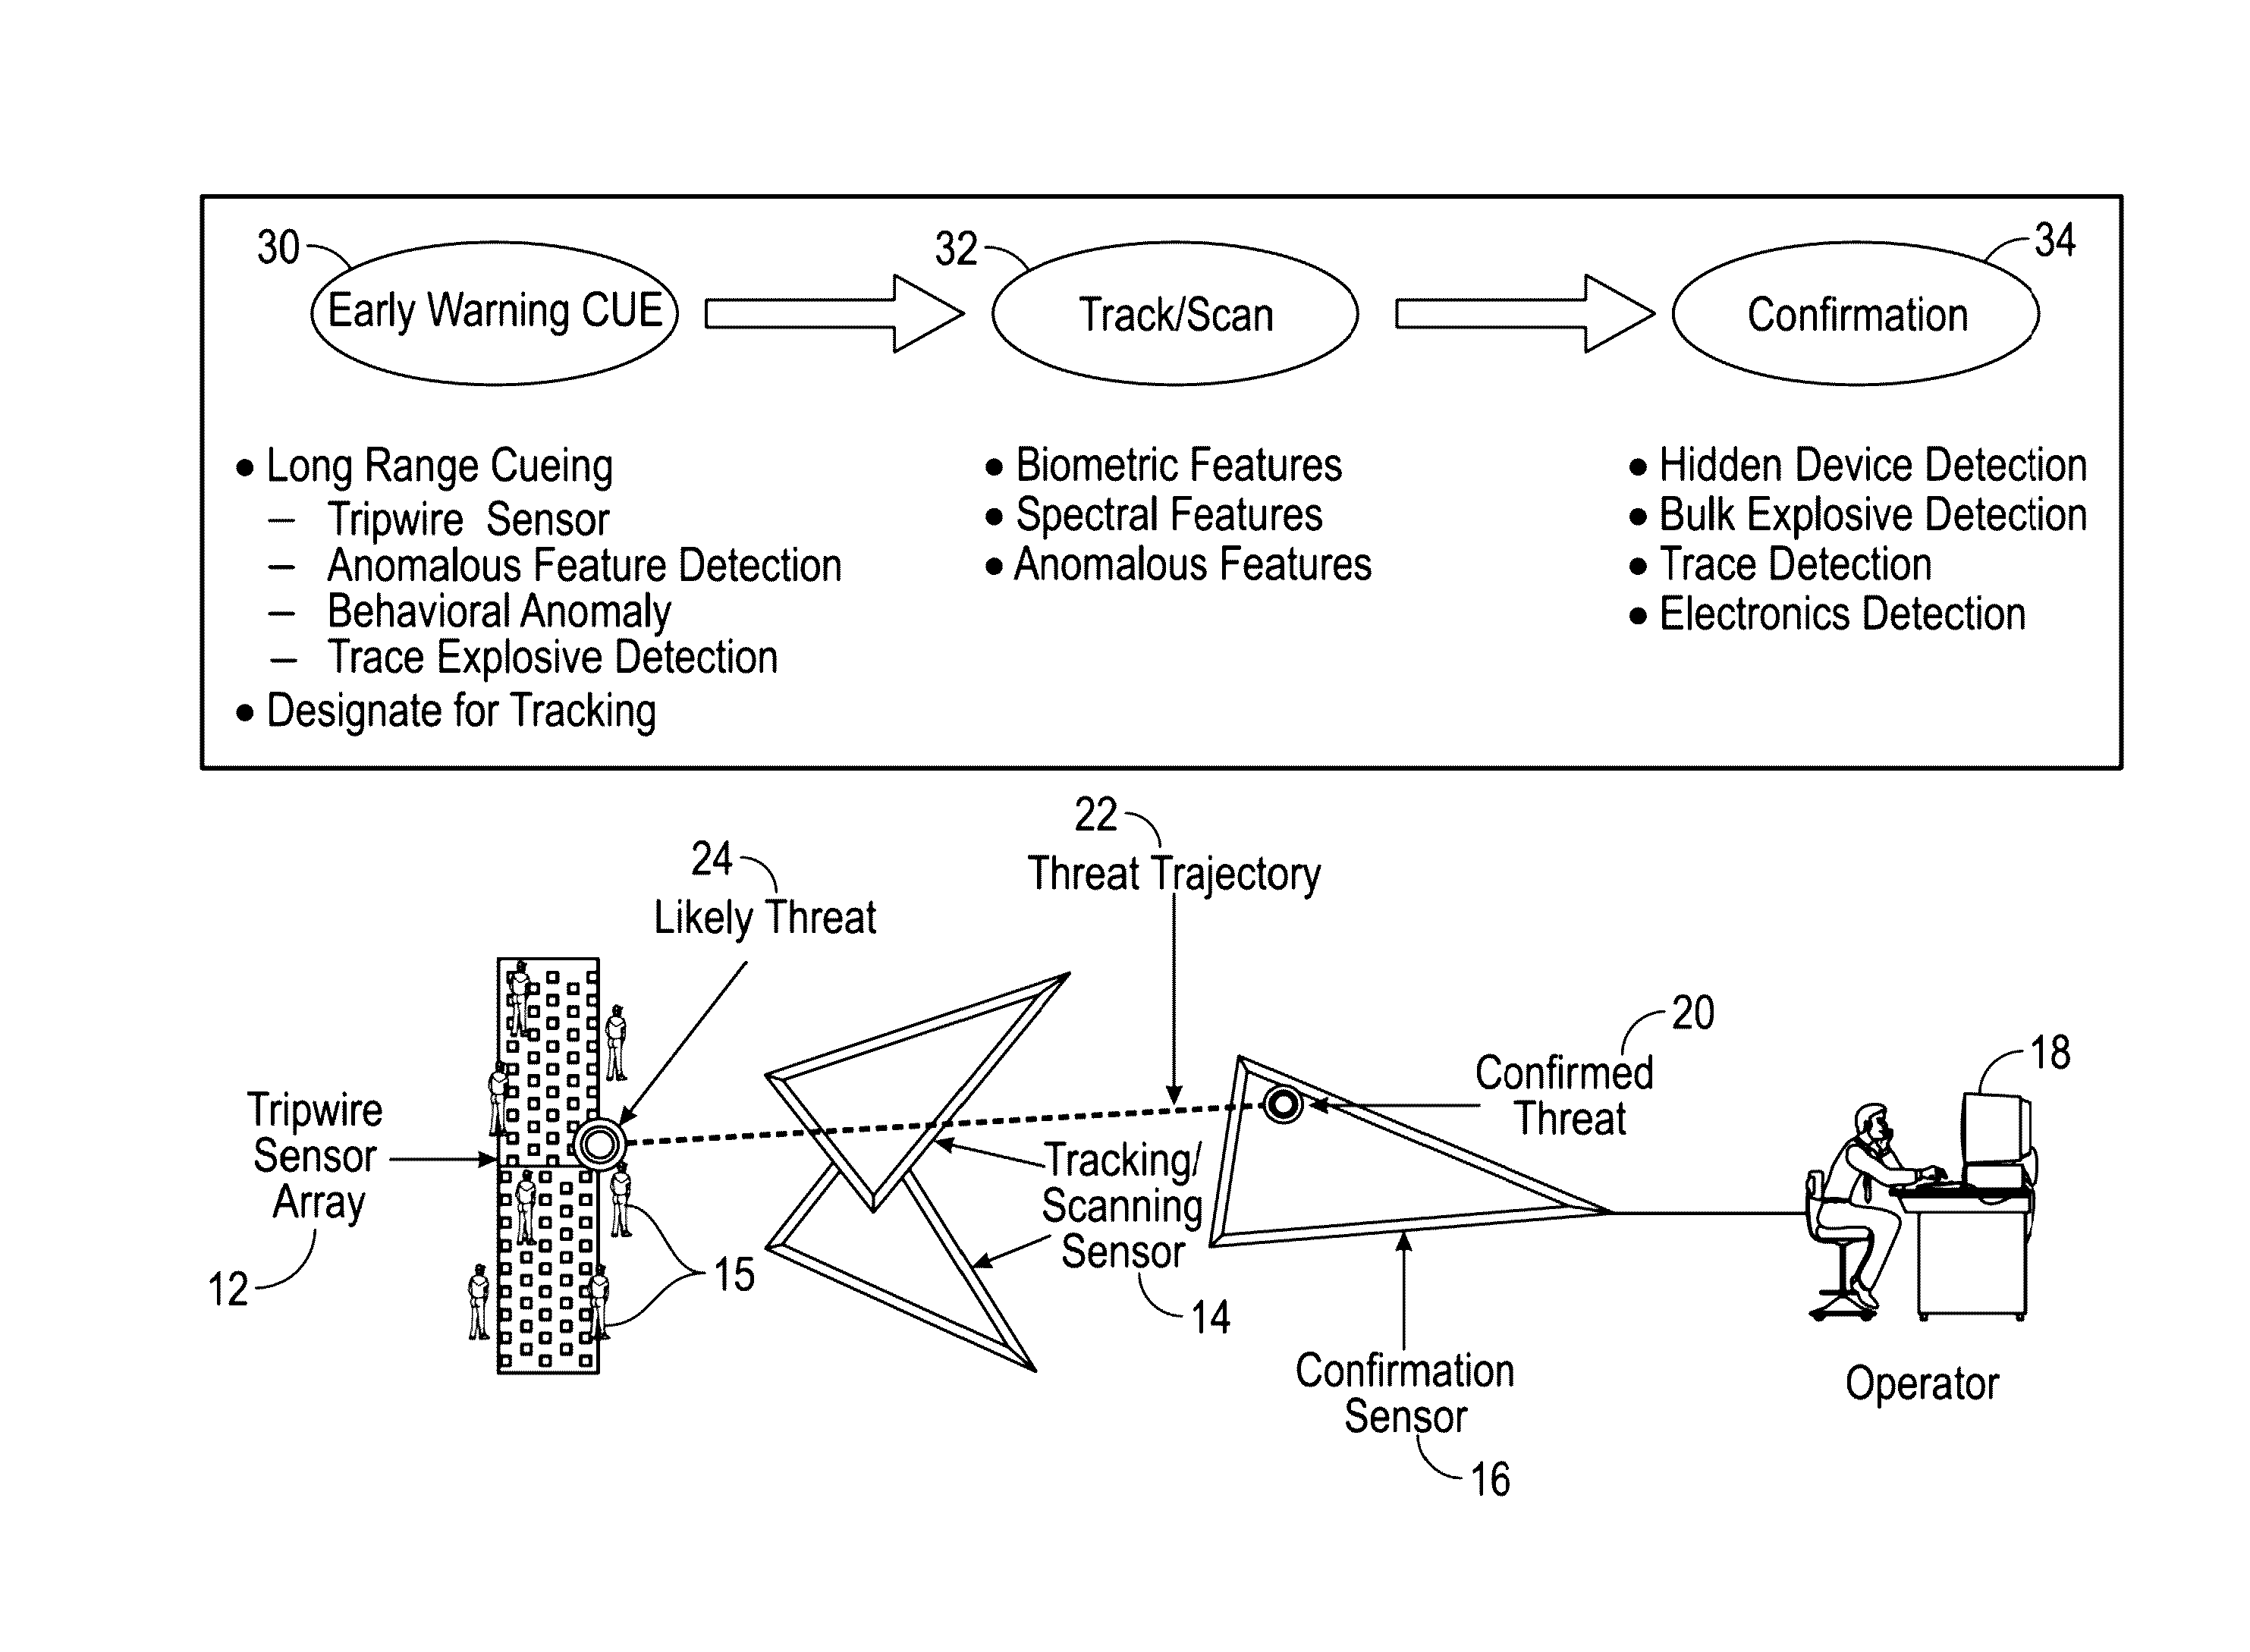
[0074]In general, this invention evaluates a type of nonlinear cost function over all possible event spaces when the number of event spaces is too large to explicitly enumerate. In the invention description, the inventors use maximum probability of detection as the cost function and pedestrian path as the event space. There remain a number of other possible nonlinear cost function examples in which this description is pertinent. For example, instead of maximum probability of detection, one may be interested in minimum detection proba...


PUM


Abstract

A technique is provided for determining expected maximum probability of detection of targets moving through a sensor grid to maximize performance of the sensor grid by changing the sensor grid variables. Non-spatial variables from a plurality of sensors of the sensor grid are removed to provide that sensor performance of the plurality of sensors is a function of spatial variables. A selection is made for the desired description of flow of targets such as pedestrians through the sensor grid between restricted stochastic flow and unrestricted stochastic flow. The specific technique and related equations for determining expected maximum probability of detection for each sensor depends on whether restricted stochastic flow or unrestricted stochastic flow is selected.

Description

STATEMENT OF GOVERNMENT INTEREST[0001]The invention described herein may be manufactured and used by or for the Government of the United States of America for governmental purposes without the payment of any royalties thereon or therefore.BACKGROUND OF THE INVENTION[0002](1) Field of the Invention[0003]The present invention relates generally to threat detection systems. More specifically, the present invention relates to a method for calculating expected maximum sensor performance of a sensor grid for detecting threats when the number of possible threat pathways through the sensor grid is so large that the technique of using all possible pathways to determine the expected maximum probability of detection is impractical.[0004](2) Description of the Prior Art[0005]Over the past decade, reaction to the terrorism threat has led to increased deployment of threat detection systems at airports and densely populated events as well as accelerated research and development of new threat detect...

Claims


Application Information

Patent Timeline
IPC IPC(8): G06N7/00G06N7/08
CPCG06N7/005G06N7/08G06N7/01
Inventor HYLAND, JOHN C.SMITH, CHERYL M.
Owner USA REPRESENTED BY THE SEC OF THE NAVY
Why Eureka
Try Eureka