Automated physical activity classification

a technology of automatic classification and physical activity, applied in the field of exercise and/or activity monitoring, can solve the problems of poor user experience, large variability and error within the data obtained, and the user is difficult to effectively interpret the representation of quality or us

Active Publication Date: 2017-05-30
PEAR LABS LTD
View PDF28 Cites 46 Cited by
  • Summary
  • Abstract
  • Description
  • Claims
  • Application Information

AI Technical Summary

Problems solved by technology

It is often difficult for the user to effectively interpret this representation of quality or use it to compare it against their goals.
There are two fundamental problems with this.
Firstly the user may reach a hill just before he / she starts the 4 minute half marathon race pace effort and have to run it up the hill.
This rigidity of set training for each activity within the workout or activity can mean that the user experience is poor and that the data obtained will have far greater variability and error within it, potentially making it almost meaningless to analyse and to draw conclusions from.
Secondly without understanding the full context of the workout it is difficult for a trainer for example to comment effectively, without for example knowing the terrain or the resistance that the user is experiencing and this can mean interpretation may be reduced to guesswork.
Current systems can also be heavily dependent on the type of monitoring device used as they are generally limited to monitoring specific parameters e.g. heart rate for interpretation of the exercise.
These factors limit the diversity of the systems and in some cases their accuracy, should the user choose to divert from the type of exercise specified by a particular program.
Lastly, the statistics provided by the system may still be meaningless to an unskilled user and would generally require the aid of a specialised trainer to interpret them and provide advice / guidance as to how to modify the user's exercise program so the user can meet their goals.
It is very difficult to extract any clear understanding or information from such raw data.
Hundreds of millions of people around the world exercise ineffectively due to poor understanding of the appropriate strategies to maximizing fitness, sports performance and health improvements through activity.
When tracking a soldier in the field or a user engaging in health related activities throughout a full day, it has been difficult in the past to clearly establish different activities that have occurred during the day, and / or assess levels of fatigue or areas of weakness.

Method used


Image

  • Automated physical activity classification
  • Automated physical activity classification
  • Automated physical activity classification

Examples


example two

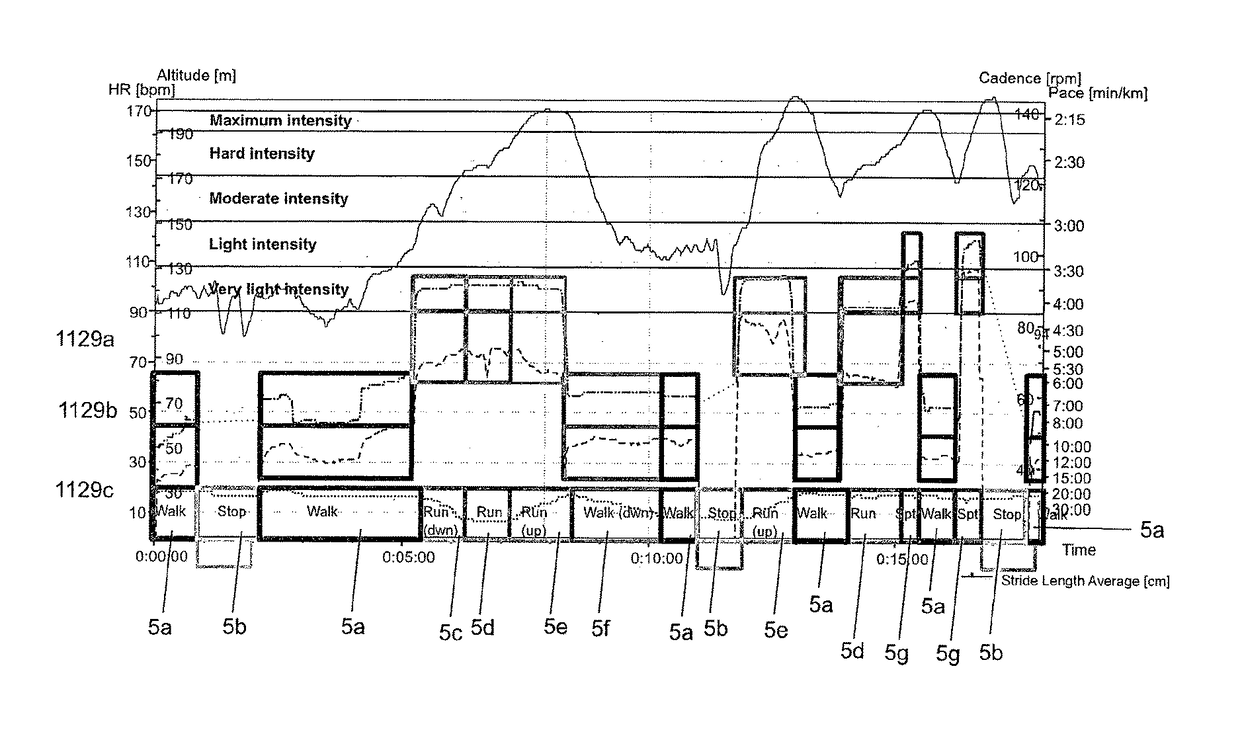
[0112]FIG. 9 shows another example of application of the classification system to identify activities A-P within a workout session from multiple parameter data. Once again, the boxed regions represent the threshold zones within which the data from a particular parameter fits. Different combinations of threshold zones output different types of activities performed during A-P. For instance, during period A, the user is going up a small hill so his leg muscles are working hard. During period B, the user is on the flat and his heart rate is easy so he is carrying out an easy training type of activity. During period C, the user's speed, heart rate and cadence have increased as they travel along flat terrain meaning the user is engaging in an ‘up tempo’ training type of activity. During period D, the speed drops, the heart rate is up but dropping and the user is still travelling on the flat which suggests the user is recovering from the up tempo activity. During period E, the user has ret...

example 1

uration

[0713]The plan for the workout called for 60 mins of running. The actual exercise duration was 70 mins. The user did 10 mins more training than the program specified.

[0714]This means that the user did 116% of what they should have done for the plan. (70 mins divided by 60 mins equals 116% of the plan.)

[0715]Workout Duration Data Thresholds:

[0716]The 116% is applied against a set of thresholds[0717]Less than 85%[0718]85% to 95%[0719]95% to 105%[0720]Greater than 105%

[0721]116% fits into the ‘greater than 105%’ threshold.[0722]Less than 85% “Exercise Duration was far below the plan, please follow the plan carefully”[0723]85% to 95% “Exercise Duration was slightly below the plan, please follow the plan carefully”[0724]95% to 105% “Exercise Duration was correct well done!”[0725]Greater than 105% “Exercise Duration exceeded plan, please follow the plan carefully”

[0726]The coaching feedback / advice would be:

[0727]“Exercise Duration exceeded plan, please follow the plan carefully”

[07...

example 2

Training Type

[0730]The workout plan was for 4 repetitions of 4 mins making a total of 16 mins of the Training Type; Up Tempo.

[0731]Up Tempo is a Training Type that occurs at about 75-85% of effort. (as defined by the calibration system within the Activity Classification method). This is above the Easy Training Type of 65-75% of effort. During a workout the runner spends most of their time at Easy but may decide to increase their effort to 75-85% of maximum to do the Up Tempo Training Type.

[0732]Up Tempo is determined by a heart rate or speed training zone which must occur on flat terrain as per the classification description. 75-85% of maximum might equate to a heart rate of 175-185 bpm or a speed of 12.5-13.5 km / hr as calibrated by the Activity Classification method. (both heart rate and speed parameters might be combined to define effort).

[0733]The runner therefore moves their effort up and heart rate reaches 175 bpm on the flat. The classification system identifies that the user ...


PUM


Abstract

The invention relates to a system and method for analyzing an activity session. Data from a monitoring device worn by a user of the system for example is received over a period of time or distance and a classification system of the invention is utilized in real time or post session to determine the activities performed by the user during the session. The data collected relates to multiple parameters monitored during the activity session. The classification system defines an activity using a set of threshold criteria for a combination of parameters and therefore identifies a particular activity performed during the activity session when a combination of monitored parameters satisfies the threshold criteria for a particular activity. Determining the activities performed in this way allows for more useful interpretation of the data which in turn leads to more effective coaching advice and feedback for the user.

Description

FIELD OF INVENTION[0001]The invention relates to exercise and / or activity monitoring and in particular to classification of exercise or activity measurement data.BACKGROUND[0002]Devices for monitoring physiological information such as heart rate, and other exercise related information such as speed and distance exist. Such devices provide a means of representing the quality of the exercise conducted by a user wearing the device or exercising on a machine incorporating the device. It is often difficult for the user to effectively interpret this representation of quality or use it to compare it against their goals. The state of the art has therefore developed further to provide systems compatible with a particular measurement device for downloading and uploading exercise data to and from the device for processing, with the object of making the data more meaningful for the user. For example, systems are available which enable a user to upload a workout program onto a wearable exercise ...

Claims


Application Information

Patent Timeline
Patent Type & Authority Patents(United States)
IPC IPC(8): G09B19/00A61B5/00G06Q30/02A63B24/00G06Q50/22A61B5/0205
CPCG06Q30/02A63B24/00A63B24/0062A63B24/0075G06Q50/22A61B5/0205A63B2220/00A63B2225/50A63B2230/00A61B5/6898A61B5/002A61B5/0022A61B5/02055A61B5/021A61B5/02405A61B5/02438A61B5/1112A61B5/1118A61B5/112A61B5/1123A61B5/14551A61B5/681A61B2503/10A61B2505/09A61B2560/0242A61B2562/0219G16H20/30G16H50/70G16H50/20G16H40/67A61B5/318
Inventor ACKLAND, JONATHAN EDWARD BELLMCMASTER, KERRI ANNE
Owner PEAR LABS LTD
Why Eureka
Try Eureka