

Method and device for graphical display of network topology
A technology of graphical display and network topology map, applied in the field of network visualization, can solve the problems of insufficient angle allocation, overlapping nodes, limited radius, etc., and achieve the effect of solving overlapping nodes
- Summary
- Abstract
- Description
- Claims
- Application Information
AI Technical Summary
Problems solved by technology
Method used
Image

Examples
Embodiment Construction
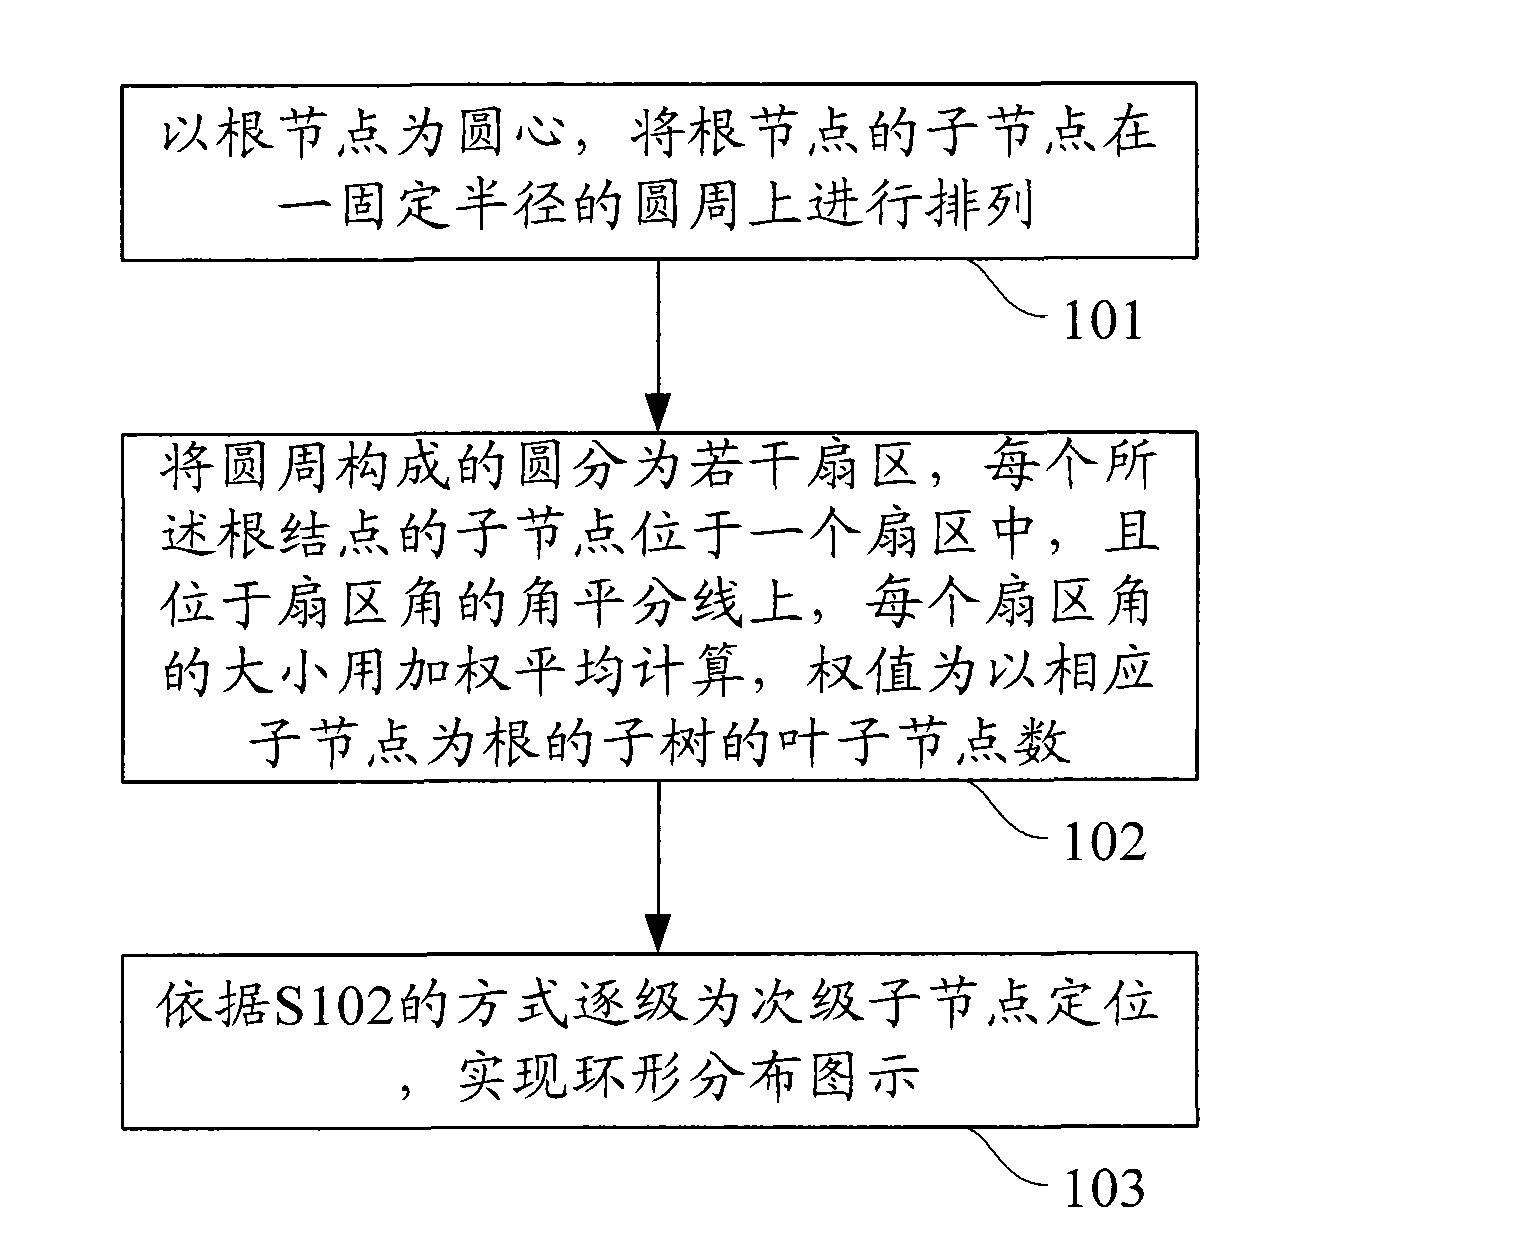
[0045] Embodiments of the present invention provide a method and device for graphically displaying network topology.
[0046] In order to enable those skilled in the art to better understand the solutions of the present invention, the following will clearly and completely describe the technical solutions in the embodiments of the present invention in conjunction with the drawings in the embodiments of the present invention. Obviously, the described embodiments are only It is a part of embodiments of the present invention, but not all embodiments. Based on the embodiments of the present invention, all other embodiments obtained by persons of ordinary skill in the art without creative efforts shall fall within the protection scope of the present invention.
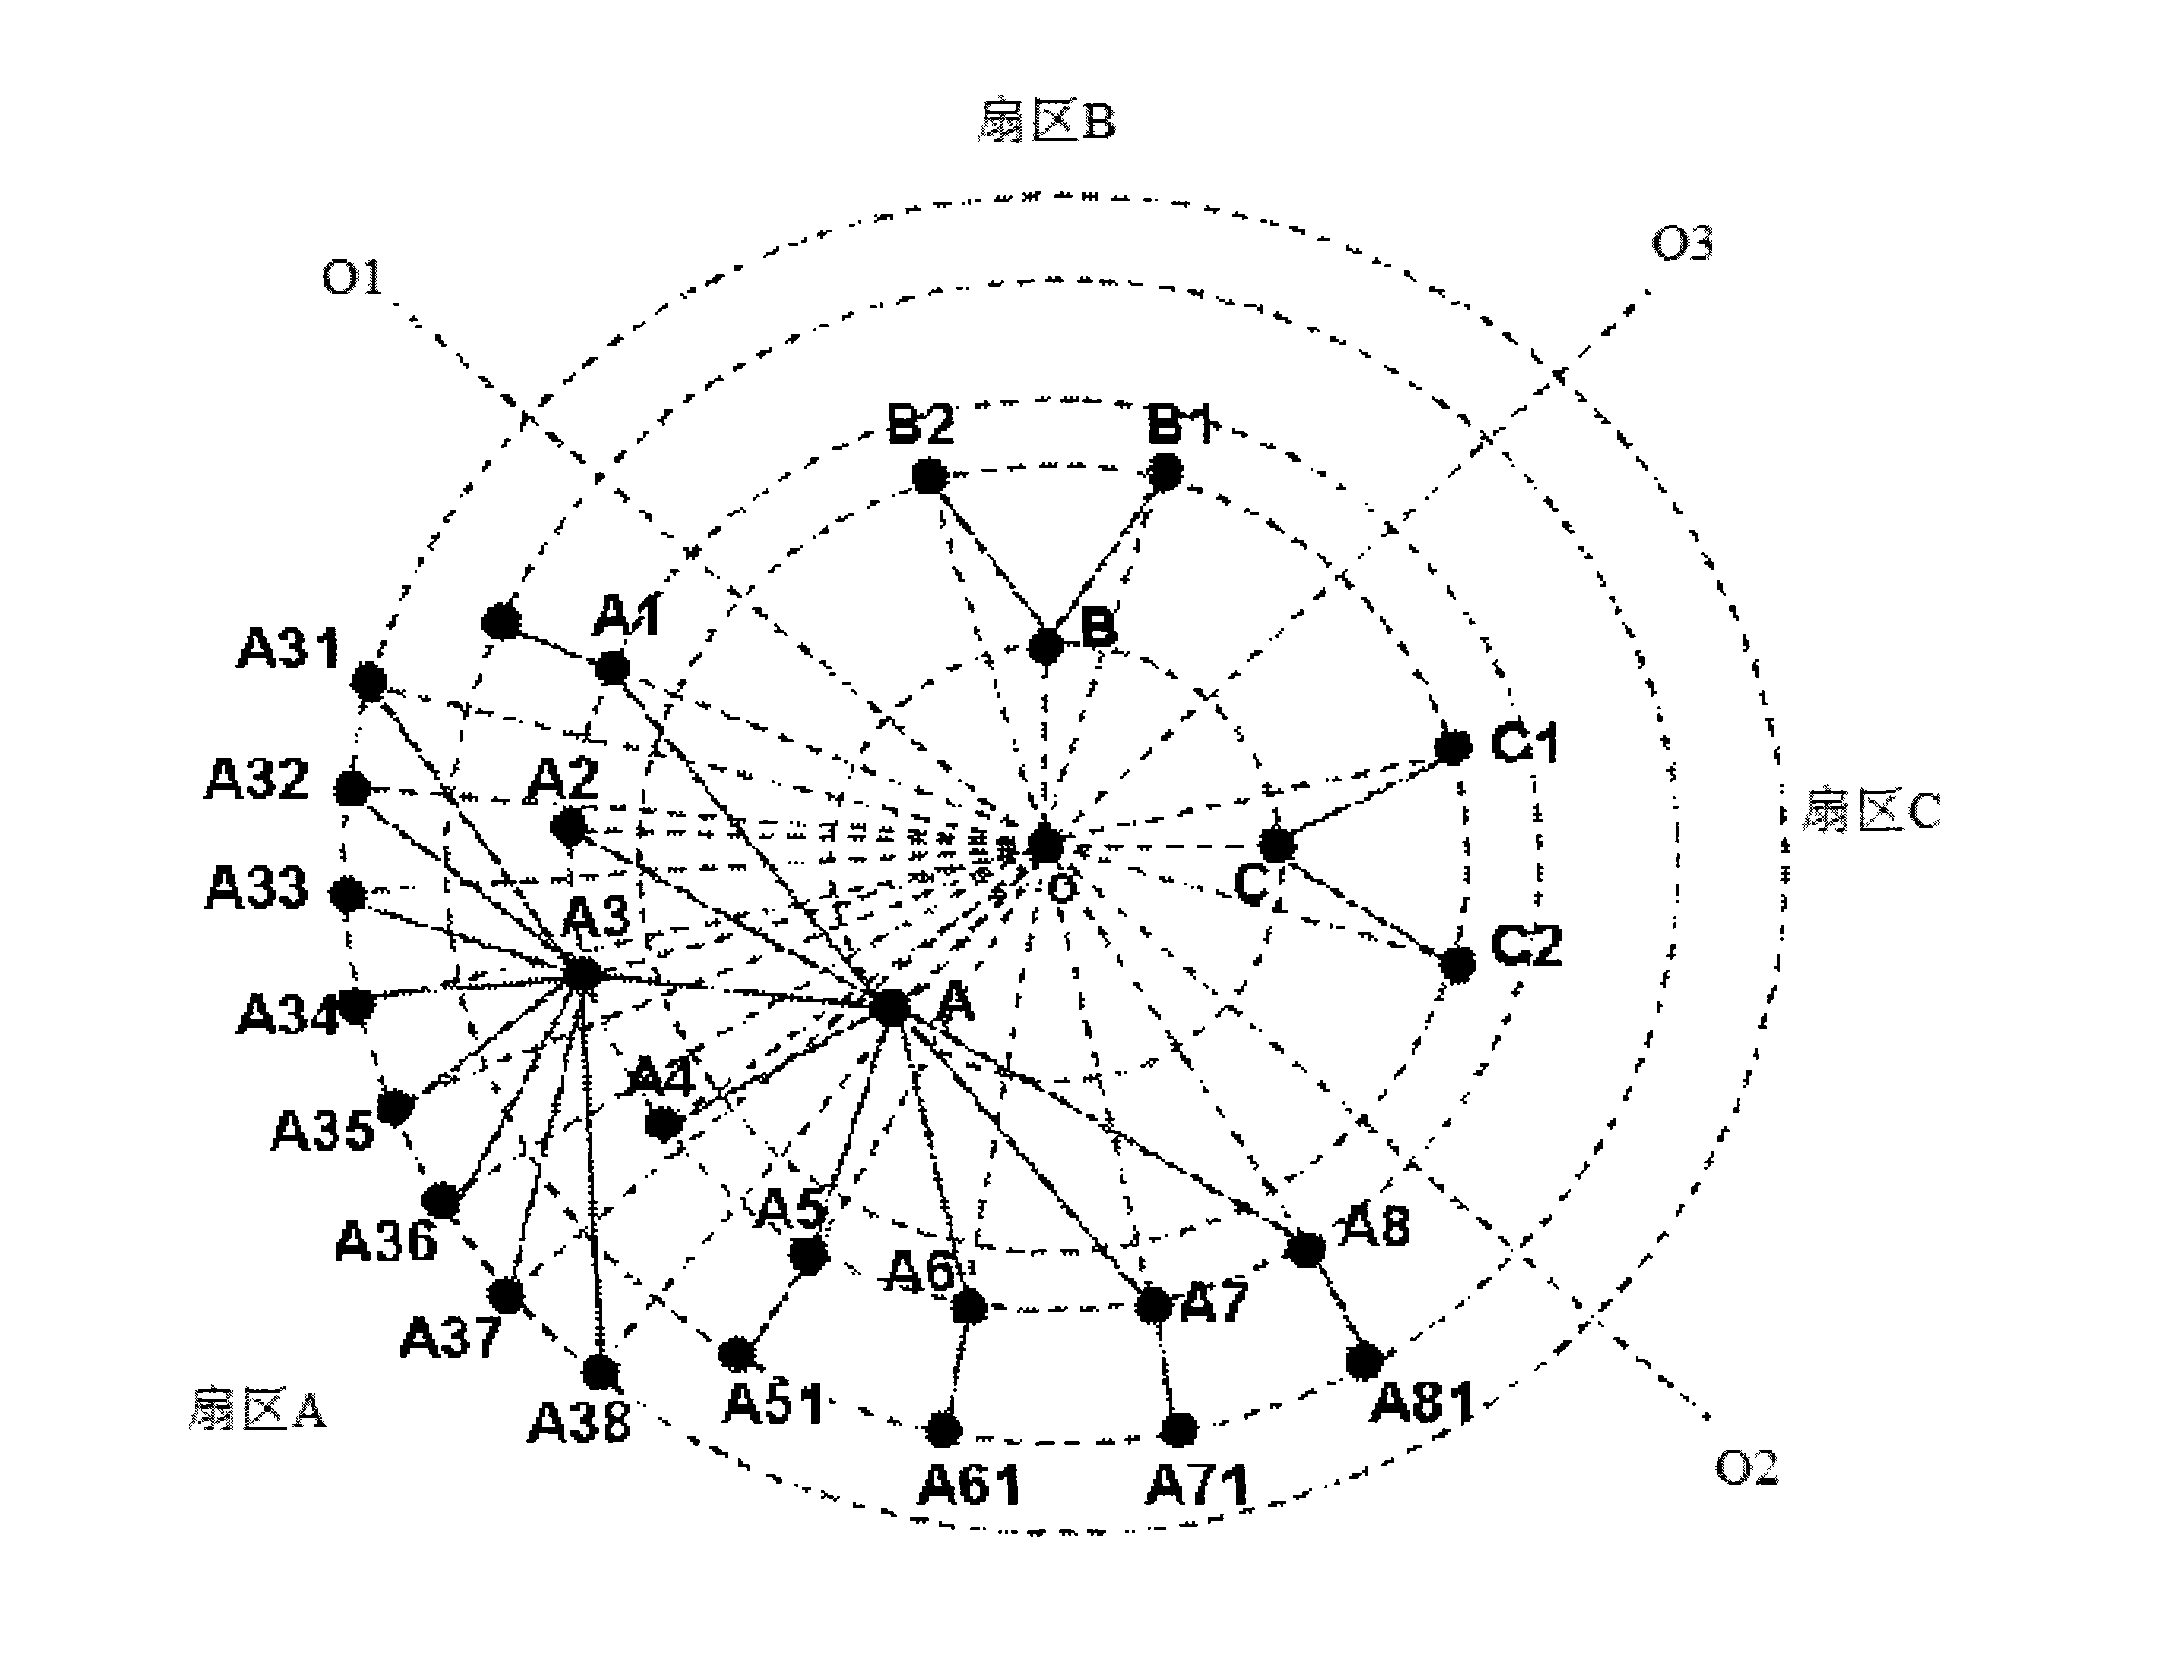
[0047] image 3 It shows the graphical display of the network topology on a limited two-dimensional plane during the implementation of the embodiment of the present invention.
[0048] It should be noted that the display o...
PUM
 Abstract
Description
Claims
Application Information