
Method and system for intuitively displaying interlayer relation of graphic element in multi-level model

A technology for intuitive display and inter-layer relationship, which is applied in 2D image generation, image data processing, instruments, etc. It can solve problems such as a large amount of modeling time, difficulty in modeling inter-layer relationships, and hidden dangers in power grid production and operation, and achieve elimination. The effect of information masking

Inactive Publication Date: 2010-11-24
SHENZHEN ADAM SOFTWARE
View PDF5 Cites 16 Cited by
  • Summary
  • Abstract
  • Description
  • Claims
  • Application Information

AI Technical Summary

Problems solved by technology

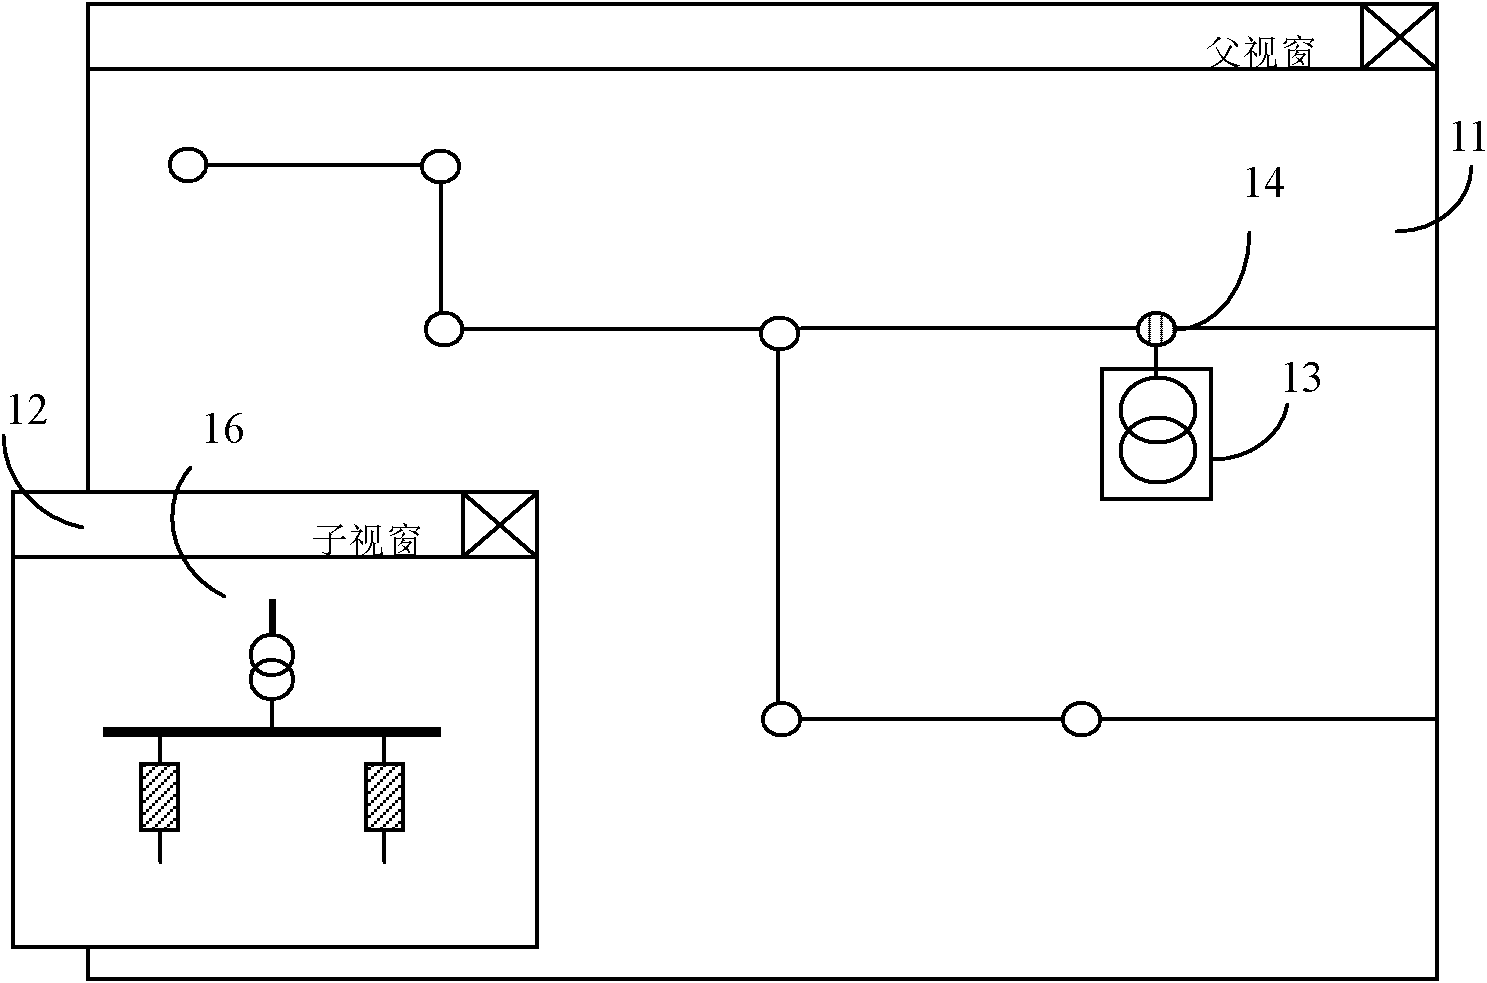
[0010] if figure 1 Given the substation graphics, the sub-window 12 will have more incoming and outgoing lines, and the cross-layer relationship between parent and child windows will be more complicated. At this time, the traditional "multi-window" technology is more difficult to map important equipment Connections are clearly and accurately displayed
If the electrical connection relationship can only be identified through auxiliary labeling or attribute data query, it will not only bring inconvenience to the application operation, but also cause safety hazards to the production and operation of the power grid due to manual misreading of the internal and external connection relationships of the substation.
[0011] The above problems are only the defects of the traditional "multi-window" technology in graphic display. In addition, because the data modeling work of the multi-level model is very complicated, the establishment of the hierarchical relationship and the cross-layer relationship of the graphic elements is the difficult content of the modeling. It will be more difficult to model inter-layer relationships when faced with complex graphics. At this time, not only will it take a lot of original data modeling time, but also in order to ensure the correctness of the modeling data, the verification cost of the multi-level model association information will also increase sharply.

Method used


Image

  • Method and system for intuitively displaying interlayer relation of graphic element in multi-level model
  • Method and system for intuitively displaying interlayer relation of graphic element in multi-level model
  • Method and system for intuitively displaying interlayer relation of graphic element in multi-level model

Examples


Embodiment Construction

[0047] The present invention can intuitively display the association relationship between graphic element layers in the multi-level model by drawing dynamic association lines across windows in the "multi-window" display system, thereby well eliminating the information masking in the traditional "multi-window" display technology The problem.

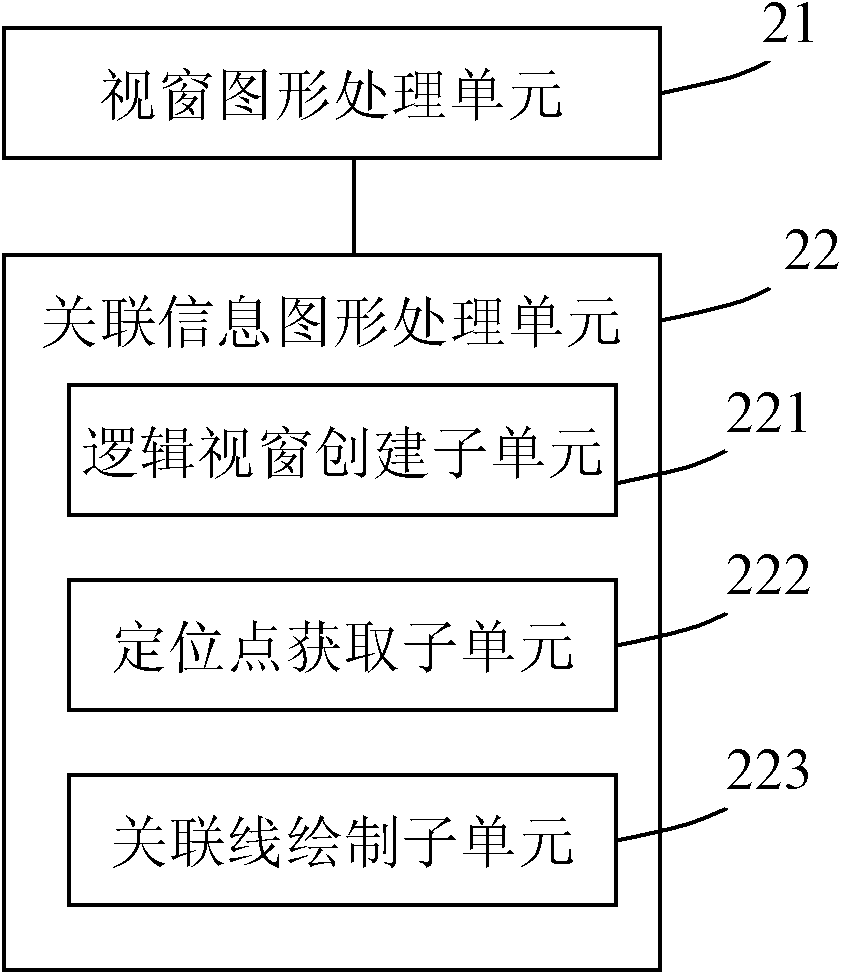
[0048] Such as figure 2 As shown, it is a schematic diagram of the first embodiment of the system for visually displaying the relationship between graphic element layers in the multi-level model of the present invention. In this embodiment, the system includes a window graphics processing unit 21 and an associated information graphics processing unit 22 . Wherein the window graphic processing unit 21 is used to display the graphic data in the window and the window, the top-level model of the multi-level model is displayed as the first parent window and the graphics in the window, and the other layer models are displayed as one or more s...


PUM


Abstract

The invention relates to a method for intuitively displaying an interlayer relation of a graphic element in a multi-level model, comprising the following steps of: a, establishing an associative line logic window which at least covers a parent window and a child window and has a transparent background color and a transparent frame; b, acquiring a first positioning point in the parent window, wherein the positioning point where the graphic element is located corresponds to the child window or is associated with the graphic element in the child window; and acquiring a second positioning point on the child window, wherein the positioning point is arranged in the graphic element associated with the first positioning point of the parent window where the graphic element is located in a frame ofthe child window and / or the child window; c, drawing an associative line from the first positioning point to the second positioning point in the associative line logic window; and d, displaying the associative line logic window including the associative line from the first positioning point to the second positioning point. The invention also provides a corresponding system. In the invention, the interlayer relation of the graphic element in the multi-level model is intuitively displayed through drawing the dynamic associative line of a cross-window, and thereby the information screen problem of the traditional multi-window technology during the displaying of the multi-level model is solved.

Description

technical field [0001] The invention relates to a multi-window graphics display technology, more specifically, to a method and system for visually displaying the relationship between graph element layers in a multi-level model. Background technique [0002] With the in-depth development of the application of computer graphics technology, it is an important technology in the graphic information system to represent the spatial structure of the same application object in multiple graphics, that is, to describe the same application object with multi-scale and multi-type graphic data. An important feature of this type of information system is to use a multi-level spatial structure model (also referred to as a multi-level model) to realize the consistent organization and management of multi-scale and multi-type graphic data. [0003] In terms of information display, these systems use "multi-window" display technology to realize the display of multi-scale and multi-type graphic dat...

Claims


Application Information

Patent Timeline
Patent Type & Authority Applications(China)
IPC IPC(8): G06T11/00
Inventor 温卫红吕珂李毅
Owner SHENZHEN ADAM SOFTWARE
Learn More